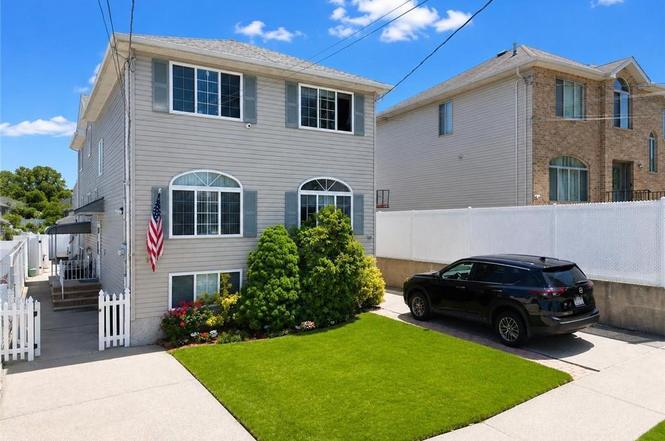
 Duplex
32 Franklin Pl · New York, NY
Flood risk 1/10 · Minimal
- FEMA flood zone
- X (unshaded)
- Chance of flooding over 30 yrs
- 0.0%
- Est. flood insurance / yr
- $507 – $1,088
Fire risk 4/10 · Minor
- Est. fire insurance / yr
- $691 – $1,283
Heat risk 7/10 · Major
- Hot days now (above 98°F)
- 7 days/yr
- Hot days in 30 yrs
- 16 days/yr
Wind risk 6/10 · Moderate
- Chance of severe wind over 30 yrs
- 61.0%
Air-quality risk 4/10 · Minor
- Unhealthy air days now
- 5 days/yr
- Unhealthy air days in 30 yrs
- 7 days/yr
Risk factors via First Street. Map © Google.
Why this score? — see what drove the F grade
The composite is a weighted blend of 9 inputs, each scored 0–100. Each bar is that input's sub-score; the figure is the points it added to the 100-point composite (weight × sub-score).
- Cash flow +7.6/30.0
- Schools +5.0/10.0
- Livability +3.8/5.0
- Rent growth +3.5/5.0
- Condition / age +2.5/5.0
- DSCR +1.7/10.0
- 1% rule +1.4/10.0
- ARV discount +0.0/15.0
- Appreciation +0.0/10.0
$849,900
🖨 Deal sheet (PDF) 📄 Offer letter ✓ Due diligence
Multi-family units
County records classify this as Multi-Family (2-4 Unit). Listing-text estimate: 2 units. confirmed
Listing remarks MLS
Semi-detached legal two (2) family with a private driveway in prime Manor Heights, built in 1998, excellent location, move in ready. Upper 2 stories features a 3-bedroom 1.5 baths duplex over a 1-bedroom unit on lower level. Hardwood flooring throughout, central HVAC, separate utilities, 2 entrances, huge irregular backyard. House is 12x58, lot is 16x107, annual property tax is 6,458. Close to all. Priced to sell. Motivated seller.
Key facts
- Hardwood flooring
- Central hvac
- Separate utilities
Tags
Property features AI
Finance
- Other: Annual tax amount listed (not included per instructions)
- Financial info: Two rental units total
Exterior
- Parking: No attached garage
- Utilities: 220-volt electrical service
- Home design: 3-story multi-family building; Total building area about 2,088
- Construction: Vinyl siding exterior; Year built listed as approximate
- Exterior features: Lot approximately 0.05 acres (about 2,269 sq ft), roughly 16 x 107; Zoned R3
Interior
- Bedrooms: Unit 1: 1 bedroom; Unit 2: 3 bedrooms (located on level 23)
- Bathrooms: 2 full bathrooms; 1 half bathroom
- Heating & cooling: Natural gas forced-air heating; Cooling provided by individual units
- Interior features: Central air conditioning (unit-based)
Neighborhood map
What this means for you Summary
Snapshot
- This is a 2 × 2-bed/1.5-bath units multifamily listed at $850k.
Deal economics
- At list price, monthly cash flow is $-1k ($-12k/yr) — negative. Per door: $-515/mo.
- To cash-flow at today's rent, offer at most $668k (21.4% below list).
- To meet the 1% rule (rent ≥ 1% of price), the offer needs to be $544k (36.0% below list).
- Recommended offer: $544k (36.0% below list) — sets the bar for 1% rule.
- Cap rate 4.8% vs local median 2.6% in New York — top-decile yield for the area; either an underpriced asset or a hidden risk that comps aren't pricing in. Stress-test before assuming the spread holds.
Location & tenants
- Location reads 75/100 on livability (#268 in NY, #4,188 nationally) — a middle-class / working-renter tenant base. Strengths: amenities A+, commute A+, health & safety A; Watch: crime F, cost of living F.
- Zoned schools: Elm Tree Elementary School (math 27% / reading 52%, grade F, #1,444 of 2,108 statewide, top 71%, 806 students, 94% FRL); Is 27 Anning S Prall (math 52% / reading 67%, grade B, #161 of 729 statewide, top 24%, 952 students, 76% FRL); Midwood High School (math 94% / reading 96%, grade A+, #83 of 1,100 statewide, top 8%, 4,062 students, 73% FRL).
- Market conditions: Rents rising (+3.9%/yr); 490 active listings in the ZIP; 1 comparable units currently listed for rent nearby; solid renter incomes; 480 units permitted in Richmond County in 2024 (22 in 5+ unit buildings).
- At $5,440/mo this rent would consume 62% of the median local household income ($105k/yr) (locally 2168% of renters already pay >50% of income on rent) — very limited rent-growth headroom before tenants either downsize or default.
Forward outlook
- Local home prices are declining (-3.0%/yr); year-one equity from $6k of loan paydown is wiped out by about $25k of value loss. Plan a longer hold.
- Richmond County population projected to shrink 5% by 2050 — rents likely to lag national; underwrite the cash flow, not the appreciation.
Negotiation context
- Only 10 days on market — expect competitive offers; lowballing is unlikely to land.
- 3 sale attempts since 23y ago with the ask held roughly flat each time — persistent listings suggest the price (not the market) is what's stuck; bring a comps-based counter.
- Current owner paid $405k; list at $850k implies a 110% gain — meaningful room to come down on a strong offer.
Risks & watch-outs
- Climate carrying-cost: major wind risk, 61% chance of damaging wind over 30y; extreme-heat days projected 7→16/yr by 2055 (HVAC capex compounding) — expect insurance premiums to compound above CPI over the hold.
Questions for the listing agent
- What do current leases actually rent for vs. the listed asking? Can we see a recent rent roll and the last 12 months of T-12 income?
- Can we see the unit-by-unit rent roll, current vacancy, and any below-market leases? What's the average tenancy length?
- What capital expenditures (roof, boiler, parking lot, exteriors) have been made in the last 5 years, and what's planned in the next 2?
- Is there a deadline driving the sale (1031 exchange, divorce, estate, relocation)? That informs how much negotiation room exists.
- Schools are B-rated — typically a magnet for longer-tenancy family renters. What's the average tenant stay here, and is there a school-zone premium baked into asking?
- Crime grade is F in this area — have there been break-ins, vandalism, or insurance claims at this property in the last 3 years? What carrier currently insures it and at what premium?
- The area grade is low — what's the realistic commute time and amenity access for the typical tenant pool here? Any planned neighborhood developments (good or bad) we should know about?
- What's the average days-on-market for RENTAL listings here right now (not sales)? A rising rental-DOM trend means longer vacancies and softer asking-rent achievability than the comps imply.
- What's the recent tenant-quality profile in this submarket — average credit score on applications, eviction rate, late-payment / NSF rate, and stable-employment percentage? A property-management company in the area should have these aggregated.
- How much new apartment / multifamily construction is in the pipeline within 1–3 miles? Heavy new supply (>2% of stock underway) typically softens rents 12–24 months out; light construction supports rent growth.
Investment metrics
- 1% rule
- 0.64% ✗
- Cap rate
- 4.84%
- Cash-on-cash
- -5.19%
- DSCR
- 0.77
- GRM
- 13.0
CMA / ARV
- ARV (on-the-fly)
- $727,030
- Comps found
- 1
Show comp detail 1 sale within ~0.75 mi
| Address | Dist | Beds/Ba | Sqft | Sold | Price | $/sf | Match |
|---|---|---|---|---|---|---|---|
| 86 Clermont Pl | 0.57mi | 3/2.5 (-1) | 1,200 (+10%) | 5mo | $800,000 | $667 | 45 |
Match score weights: distance 35% · size 25% · config 20% · recency 20%. Top-matched comps best support the ARV.
Projected returns pro-forma
-3.0% appreciation · 3.93% rent growth · sell at horizon
- IRR
- -24.3%
- Equity multiple
- 0.17×
- Total profit
- $-198,443
- Equity at exit
- $126,723
- IRR
- -17.6%
- Equity multiple
- 0.00×
- Total profit
- $-236,824
- Equity at exit
- $73,484
Cash invested: $237,972 (down + closing). Projections, not guarantees.
Landlord ↔ Tenant lean methodology
- Overall (CITY)
- 0 Strongly Tenant-Friendly
- State New York
- 15 Strongly Tenant-Friendly · D+10
- County
- — inherits STATE
- City New York
- 0 Strongly Tenant-Friendly · D+34
ZIP-level market 10314
- Rents YoY
- 3.9%
- Active inventory
- 490
- Price-to-rent
- 26.0×
Monthly cashflow live
- Estimated rent
- $5,440 medium interval (Pro) →
- Mortgage (P&I)
- −$4,457
- Tax from tax record
- −$517 /mo · $6,199/yr
- Insurance
- −$354
- HOA
- −$0
- Vacancy / Maint / Mgmt
- −$1,142
- Net cashflow
- $-1,030
Break-even live
Sensitivity live
| Price | -10% $-549 | -5% $-790 | +0% $-1,030 | +5% $-1,271 | +10% $-1,511 |
|---|---|---|---|---|---|
| Rent | -10% $-1,460 | -5% $-1,245 | +0% $-1,030 | +5% $-815 | +10% $-600 |
| Rate | -1.0pp $-602 | -0.5pp $-814 | base $-1,030 | +0.5pp $-1,250 | +1.0pp $-1,474 |
2-unit breakdown (identical units grouped — click to expand)
| Units | Beds | Baths | Est. rent |
|---|---|---|---|
| 2× units | 2 | 1.5 | $5,440 |
| #1 | 2 | 1.5 | $2,720 |
| #2 | 2 | 1.5 | $2,720 |
| Total (2 units) | $5,440 | ||
UW: 25.0% down · 7.5% · 30yr · 1.5% tax · 5.0% vac · 8.0% maint · 8.0% mgmt
Financing live
Cash to close
- Down payment
- $212,475
- Closing costs
- $25,497
- Reserves months
- —
- Total cash needed
- —
Loan-product check · same deal, 3 products live
Conventional
25% down · 7.5% · 30yr
- Down + closing
- —
- Monthly P&I
- —
- Monthly cashflow
- —
- DSCR
- —
- Eligible?
- —
Personal DTI + credit; lowest rate.
DSCR
20% down · 8.5% · 30yr
- Down + closing
- —
- Monthly P&I
- —
- Monthly cashflow
- —
- DSCR
- —
- Eligible?
- —
No personal income docs; deal must DSCR.
Hard money
10% down · 12.0% · 12mo
- Down + closing
- —
- Monthly P&I
- —
- Monthly cashflow
- —
- DSCR
- —
- Eligible?
- —
Short-term bridge; refi at stabilization.
Rent comps 1 comps
| Address | Beds | Baths | Sqft | Rent | $/sqft | DOM | Units | Dist |
|---|---|---|---|---|---|---|---|---|
| 527 Willowbrook Rd Staten Island, NY | 3.0 | 2.0 | 1000 | $4,000 | $4.00 | 4d | 1 | 1.49mi |
Listing history 7 events
-
2026-06-21days on market $849,900 Active 10 DOM
-
2026-06-18days on market $849,900 Active 7 DOM
-
2026-06-17days on market $849,900 Active 6 DOM
-
2026-06-16days on market $849,900 Active 5 DOM
-
2026-06-15days on market $849,900 Active 4 DOM
-
2026-06-13remarks 435-char remark
-
2026-06-13$849,900 Active 2 DOM
ⓘ Source: listings_history table (triggers on properties + properties_extension) + one-shot
backfill from property_details.listing_events for pre-trigger history.
Tax reassessment forecast NY · Partial reset (capped growth)
- Current annual tax
- $6,199 · $517/mo
- Projected year-2 tax
- $10,281 · $857/mo
- Expected delta
- +$4,082/yr (+$340/mo · 65.9%)
ⓘ Screening estimate from a state-policy table — verify with the county assessor before closing.
Climate risk First Street
- Flood 1/10 Low FEMA zone X (unshaded) · 0% chance over 30 yrs
- Wildfire 4/10 Moderate
- Heat 7/10 Severe 7 d/yr ≥98°F today · 16 d/yr by 30 yrs out
- Wind 6/10 Major 61% chance of damaging wind over 30 yrs
- Air quality 4/10 Moderate 5 unhealthy d/yr today · 7 by 30 yrs out
Nearby sold comps map
Loading sold comps map…
Walkable amenities ~0.75 mi
Loading nearby amenities…
Taxation est. · year 1
- Rental income
- $65,280
- − Mortgage interest
- −$47,608
- − Property taxes
- −$6,199
- − Insurance
- −$4,250
- − Repairs & maintenance
- −$5,222
- − Management
- −$5,222
- − Depreciation
- −$24,724
- Taxable loss
- −$27,945
- Est. tax savings @ 24.0%
- +$6,707
- After-tax cash flow
- $-5,654/yr
For passive investors: Depreciation is non-cash, so a rental often shows a tax loss while cash-flowing — sheltering income. Rental losses are passive: they offset passive income freely, and up to $25,000/yr can offset ordinary (W-2) income if you actively participate and your MAGI is under $100k (phasing out to $0 by $150k); unused losses carry forward. On sale, claimed depreciation is recaptured at up to 25%, and gains may owe capital-gains tax (a 1031 exchange can defer both). Figures are a year-1 estimate at your 24.0% rate — not tax advice; consult a CPA.
Schools (NCES district)
No district data.
Livability — New York
- Score
- 75/100
- State rank
- #268
- US rank
- #4188
Category grades
Schools grade is shown separately in the Schools card above.
Census & demographics
- Census place
- New York, NY
- County
- Richmond County · 404,174 people
- City population
- 7,731,280
- Metro
- New York-Newark-Jersey City, NY-NJ-PA
- Population (ZIP)
- 93,915
- Household income
- $104,613
- Rent vs Own
- Severe rent burden
- 2168.0
Population outlook (Richmond County) Hauer SSP2
- Today (2025)
- 482,784 people
- By 2030
- 481,831 · -0.2%
- By 2040
- 473,159 · -2.0%
- By 2050
- 457,242 · -5.3%
- By 2075
- 408,029 · -15.5%
- By 2100
- 341,459 · -29.3%
Race, ethnicity, and origin ACS 2023
- Neighborhood character
- Diverse neighborhood (Simpson 0.58)
- Race & ethnicity
- White 60% Asian 19% Hispanic / Latino 15% Two or more races 8% Black 4%
- Hispanic origin (detail)
- Mexican 3% Puerto Rican 7% Dominican 1%
- Common ancestry
- Romanian 4% Scotch-Irish 2% Subsaharan African 1%
- Foreign-born
- 28% · Canada, China, South Korea
- Languages at home
- 61% English-only · Spanish 9% Chinese 7% Other Indo-European 7%
Political lean MEDSL · Richmond
- 2024 margin
- Strong R (+29.8) · D 35.1% · R 64.9%
- 2008→2024 swing
- -25.7pp toward R · 2008: -4.0pp · 2024: -29.8pp
- All cycles
- 2024: R+29.8 2020: R+14.9 2016: R+16.8 2012: D+0.8 2008: R+4.0
Not yet ingested
- Civics
- —
Market trends
- HPI YoY
- ▼ -553.73%
- Current HPI
- 378.3872
- Rent YoY
- ▲ 3.93%
- Metro
- New York-Newark-Jersey City, NY-NJ-PA
- State GDP YoY
- ▲ 2.60%
- F500 in state
- 92
Industry mix (Fortune 500 HQ in NY)
| Industry | F500 HQs | Revenue |
|---|---|---|
| Financial Services | 10 | $950B |
|
||
| Consumer Goods | 9 | $162B |
|
||
| Insurance | 4 | $225B |
|
||
| Telecommunications | 2 | $144B |
|
||
| Pharmaceuticals | 2 | $112B |
|
||
| Media / Entertainment | 2 | $69B |
|
||
Price history
+392.7% since first listed7 events — show timeline
- 2026-06-11 Listed $849,900 SIBORMLS
- 2026-06-11 Listed $849,900 BNYMLS
- 2004-10-15 Sold (Public Records) $405,000 Public Records
- 2004-07-01 Sold (MLS) $405,000 SIBORMLS
- 2003-12-11 Listed $429,900 SIBORMLS
- 1999-07-19 Sold (Public Records) $193,500 Public Records
- 1999-03-03 Sold (Public Records) $172,500 Public Records
Property tax history
+13.8%/yrLatest (2025): $6,199 · +6.0% YoY. Source: county tax records.
Cash-flow waterfall
monthlySold comps — $/sqft
last 12 mo · ≤1 miLoading sold comps…