 Multi-family
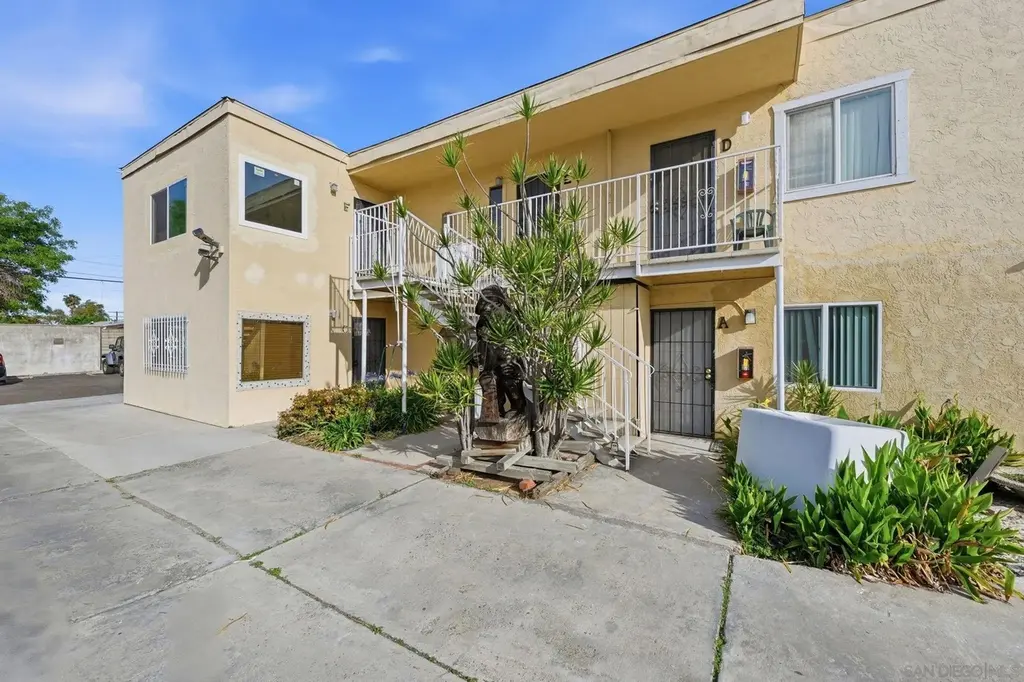
4484 Felton St · San Diego, CA
Flood risk 1/10 · Minimal
- FEMA flood zone
- X (unshaded)
- Chance of flooding over 30 yrs
- 0.0%
- Est. flood insurance / yr
- $507 – $1,088
Fire risk 1/10 · Minimal
- Est. fire insurance / yr
- $659 – $1,223
Heat risk 4/10 · Minor
- Hot days now (above 89°F)
- 7 days/yr
- Hot days in 30 yrs
- 20 days/yr
Wind risk 1/10 · Minimal
- Chance of severe wind over 30 yrs
- —
Air-quality risk 3/10 · Minor
- Unhealthy air days now
- 4 days/yr
- Unhealthy air days in 30 yrs
- 4 days/yr
Risk factors via First Street. Map © Google.
Why this score? — see what drove the C grade
The composite is a weighted blend of 9 inputs, each scored 0–100. Each bar is that input's sub-score; the figure is the points it added to the 100-point composite (weight × sub-score).
- Cash flow +24.8/30.0
- DSCR +8.0/10.0
- ARV discount +7.5/15.0
- 1% rule +6.4/10.0
- Livability +3.8/5.0
- Rent growth +3.0/5.0
- Condition / age +2.5/5.0
- Schools +2.2/10.0
- Appreciation +0.0/10.0
$1,100,000
🖨 Deal sheet (PDF) 📄 Offer letter ✓ Due diligence
Multi-family units
County records classify this as Multi-Family (5+ Unit). Listing-text estimate: 1 unit. estimate disagrees with records
5+ unit building — per-unit beds/baths from public records are typically unavailable; the breakdown below (if shown) is an estimate from the listing text.
Listing remarks MLS
Investor Special
Key facts
- Central location
- Updated countertops
- Two story building
Tags
Neighborhood map
What this means for you Summary
Snapshot
- This is a 2-bed/1.0-bath multifamily listed at $1.10M.
Deal economics
- At list price, monthly cash flow is $2k ($28k/yr) — positive.
- The deal already cash-flows at list — no discount required.
- Meets the 1% rule at list price ($13k rent vs $1.10M).
- Cap rate 8.8% vs local median 2.0% in San Diego — top-decile yield for the area; either an underpriced asset or a hidden risk that comps aren't pricing in. Stress-test before assuming the spread holds.
Location & tenants
- Location reads 75/100 on livability (#123 in CA, #4,206 nationally) — a middle-class / working-renter tenant base. Strengths: amenities A+, commute A+, employment A+; Watch: health & safety C-, crime D+, cost of living F.
- San Diego Unified (urban): math 19% / reading 29% proficiency, ranked #393 of 517 in CA (top 76%) — low school quality limits family demand, transient renter base, plan for 1-2y turnover.
- Zoned schools: Adams Elementary (257 students, 70% FRL); Wilson Middle (math 10% / reading 10%, grade F, #474 of 498 statewide, top 99%, 732 students, 88% FRL); Hoover High (2,265 students, 81% FRL) — zoned schools average 80% FRL vs 52% district-wide (28 pts higher); higher-poverty schools than district average — tighter screening recommended.
- Zoned-school proficiency averages 10% at this address vs 24% district-wide (-14 pts) — the specific schools serving this property underperform the San Diego Unified average; the district grade overstates school quality for this exact location.
- Market conditions: Rents rising (+1.9%/yr); 120 active listings in the ZIP; 40 comparable units currently listed for rent nearby; rentals at typical pace (median 23d on market — plan ~3-4 weeks tenant-placement turnaround); solid renter incomes; 11,759 units permitted in San Diego County in 2024 (7,244 in 5+ unit buildings).
- At $12,577/mo this rent would consume 154% of the median local household income ($98k/yr) (locally 2385% of renters already pay >50% of income on rent) — very limited rent-growth headroom before tenants either downsize or default.
Forward outlook
- Local home prices are declining (-3.0%/yr); year-one equity from $8k of loan paydown is wiped out by about $33k of value loss. Plan a longer hold.
- San Diego County population projected at +20% by 2050 — long-run rental-demand tailwind backs the buy-and-hold thesis.
Negotiation context
- Only 1 days on market — expect competitive offers; lowballing is unlikely to land.
- 6 sale attempts since 3y ago with the ask held roughly flat each time — persistent listings suggest the price (not the market) is what's stuck; bring a comps-based counter.
Questions for the listing agent
- Is there a deadline driving the sale (1031 exchange, divorce, estate, relocation)? That informs how much negotiation room exists.
- Schools are B-rated — typically a magnet for longer-tenancy family renters. What's the average tenant stay here, and is there a school-zone premium baked into asking?
- Crime grade is D in this area — have there been break-ins, vandalism, or insurance claims at this property in the last 3 years? What carrier currently insures it and at what premium?
- What's the average days-on-market for RENTAL listings here right now (not sales)? A rising rental-DOM trend means longer vacancies and softer asking-rent achievability than the comps imply.
- What's the recent tenant-quality profile in this submarket — average credit score on applications, eviction rate, late-payment / NSF rate, and stable-employment percentage? A property-management company in the area should have these aggregated.
- How much new apartment / multifamily construction is in the pipeline within 1–3 miles? Heavy new supply (>2% of stock underway) typically softens rents 12–24 months out; light construction supports rent growth.
Investment metrics
- 1% rule
- 1.14% ✓
- Cap rate
- 8.84%
- Cash-on-cash
- 9.09%
- DSCR
- 1.40
- GRM
- 7.3
CMA / ARV
No comps found within radius.
Projected returns pro-forma
-3.0% appreciation · 1.92% rent growth · sell at horizon
- IRR
- -3.8%
- Equity multiple
- 0.86×
- Total profit
- $-42,928
- Equity at exit
- $164,014
- IRR
- 4.7%
- Equity multiple
- 1.33×
- Total profit
- $100,511
- Equity at exit
- $95,108
Cash invested: $308,000 (down + closing). Projections, not guarantees.
Landlord ↔ Tenant lean methodology
- Overall (STATE)
- 18 Strongly Tenant-Friendly
- State California
- 18 Strongly Tenant-Friendly · D+13
- County
- — inherits STATE
- City
- — inherits STATE
ZIP-level market 92116
- Rents YoY
- 1.9%
- Active inventory
- 120
- Price-to-rent
- 43.7×
Monthly cashflow live
- Estimated rent
- $12,577 high interval (Pro) →
- Mortgage (P&I)
- −$5,769
- Tax est. 1.5%
- −$1,375 /mo · $16,500/yr
- Insurance
- −$458
- HOA
- −$0
- Lot rent
- −$0
- Vacancy / Maint / Mgmt
- −$2,641
- Net cashflow
- $2,334
Break-even live
Sensitivity live
| Price | -10% $3,094 | -5% $2,714 | +0% $2,334 | +5% $1,954 | +10% $1,574 |
|---|---|---|---|---|---|
| Rent | -10% $1,340 | -5% $1,837 | +0% $2,334 | +5% $2,831 | +10% $3,328 |
| Rate | -1.0pp $2,888 | -0.5pp $2,614 | base $2,334 | +0.5pp $2,049 | +1.0pp $1,759 |
6-unit breakdown (identical units grouped — click to expand)
| Units | Beds | Baths | Est. rent |
|---|---|---|---|
| 6× units | 1 | 1 | $12,576 |
| #1 | 1 | 1 | $2,096 |
| #2 | 1 | 1 | $2,096 |
| #3 | 1 | 1 | $2,096 |
| #4 | 1 | 1 | $2,096 |
| #5 | 1 | 1 | $2,096 |
| #6 | 1 | 1 | $2,096 |
| Total (6 units) | $12,577 | ||
UW: 25.0% down · 7.5% · 30yr · 1.5% tax · 5.0% vac · 8.0% maint · 8.0% mgmt
Financing live
Cash to close
- Down payment
- $275,000
- Closing costs
- $33,000
- Reserves months
- —
- Total cash needed
- —
Loan-product check · same deal, 3 products live
Conventional
25% down · 7.5% · 30yr
- Down + closing
- —
- Monthly P&I
- —
- Monthly cashflow
- —
- DSCR
- —
- Eligible?
- —
Personal DTI + credit; lowest rate.
DSCR
20% down · 8.5% · 30yr
- Down + closing
- —
- Monthly P&I
- —
- Monthly cashflow
- —
- DSCR
- —
- Eligible?
- —
No personal income docs; deal must DSCR.
Hard money
10% down · 12.0% · 12mo
- Down + closing
- —
- Monthly P&I
- —
- Monthly cashflow
- —
- DSCR
- —
- Eligible?
- —
Short-term bridge; refi at stabilization.
Rent comps 40 comps
| Address | Beds | Baths | Sqft | Rent | $/sqft | DOM | Units | Dist |
|---|---|---|---|---|---|---|---|---|
| 3418 Monroe Ave #20 San Diego, CA | 1.0 | 1.0 | 700 | $2,800 | $4.00 | 27d | 1 | 0.05mi |
| 4584 Felton St #3 San Diego, CA | 2.0 | 1.5 | 744 | $3,300 | $4.44 | 27d | 1 | 0.13mi |
| 4580 33rd St Apt 6 San Diego, CA | 2.0 | 1.0 | 750 | $2,200 | $2.93 | 23d | 1 | 0.18mi |
| 4620 Hawley Blvd Unit HAW4620-7 San Diego, CA | 1.0 | 1.0 | 650 | $1,895 | $2.92 | 27d | 1 | 0.19mi |
| 4514 Bancroft St San Diego, CA | 1.0 | 1.0 | 465 | $2,475 | $5.32 | 4d | 4 | 0.20mi |
| 4515 35th St Unit 4515-04 San Diego, CA | 1.0 | 1.0 | 618 | $1,800 | $2.91 | 27d | 1 | 0.20mi |
| 4326 Felton St Unit 4330 San Diego, CA | 1.0 | 1.0 | 490 | $2,350 | $4.80 | 27d | 1 | 0.22mi |
| 3231 Madison Ave San Diego, CA | 2.0 | 1.0 | 700 | $2,195 | $3.14 | 10d | 1 | 0.23mi |
| 4326 1/2 Swift Ave San Diego, CA | 1.0 | 1.0 | 450 | $1,895 | $4.21 | 5d | 1 | 0.24mi |
| 3211 Madison Ave San Diego, CA | 1.0 | 1.0 | 660 | $2,150 | $3.26 | 2d | 1 | 0.25mi |
| 4516 32nd St Unit 2A San Diego, CA | 1.0 | 1.0 | 576 | $2,275 | $3.95 | 27d | 1 | 0.25mi |
| 4462 32nd St San Diego, CA | 2.0 | 2.0 | 700 | $2,195 | $3.14 | 27d | 1 | 0.25mi |
| 3450 El Cajon Blvd San Diego, CA | 1.0 | 1.0 | 427 | $2,295 | $5.37 | 27d | 9 | 0.27mi |
| 4640 Bancroft St Apt 2 San Diego, CA | 1.0 | 1.0 | 560 | $1,950 | $3.48 | 23d | 1 | 0.28mi |
| 4645 32nd St Apt 3 San Diego, CA | 2.0 | 1.0 | 750 | $2,495 | $3.33 | 27d | 1 | 0.30mi |
| 4645 32nd St Unit 4 San Diego, CA | 1.0 | 1.0 | 650 | $2,175 | $3.35 | 17d | 1 | 0.30mi |
| 4674 Bancroft St Unit 6 San Diego, CA | 1.0 | 1.0 | 475 | $1,995 | $4.20 | 27d | 1 | 0.33mi |
| 4240 Felton St San Diego, CA | 1.0–2.0 | 1.0–2.0 | 695 | $2,950 | $4.24 | 27d | 4 | 0.34mi |
| 4236 34th St Unit 03 San Diego, CA | 1.0 | 1.0 | 600 | $1,895 | $3.16 | 10d | 1 | 0.35mi |
| 3590 Madison Ave San Diego, CA | 2.0 | 1.0 | 670 | $3,150 | $4.70 | 27d | 1 | 0.36mi |
| 4429 36th St Unit 44315 San Diego, CA | 2.0 | 1.0 | 560 | $2,675 | $4.78 | 7d | 1 | 0.36mi |
| 4539 36th St San Diego, CA | 1.0 | 1.0 | 570 | $2,395 | $4.20 | 16d | 1 | 0.36mi |
| 4539 36th St Unit 3 San Diego, CA | 1.0 | 1.0 | 570 | $2,395 | $4.20 | 7d | 1 | 0.36mi |
| 4237 Swift Ave San Diego, CA | 2.0 | 1.0 | 750 | $2,200 | $2.93 | 17d | 1 | 0.36mi |
| 4235 Swift Ave San Diego, CA | 2.0 | 1.0 | 750 | $2,200 | $2.93 | 17d | 1 | 0.36mi |
| 4732 Hawley Blvd San Diego, CA | 1.0 | 1.0 | 610 | $2,250 | $3.69 | 1d | 2 | 0.37mi |
| 4233 Swift Ave San Diego, CA | 2.0 | 1.0 | 750 | $2,200 | $2.93 | 17d | 1 | 0.37mi |
| 4620 36th St San Diego, CA | 2.0 | 2.0 | 732 | $3,100 | $4.23 | 27d | 1 | 0.37mi |
| 4221 34th St San Diego, CA | 1.0 | 1.0 | 672 | $2,095 | $3.12 | 20d | 1 | 0.37mi |
| 4485 Illinois St Unit 7 San Diego, CA | 2.0 | 1.0 | 750 | $2,100 | $2.80 | 27d | 1 | 0.37mi |
| 3245 Bramson Pl Unit 3249 San Diego, CA | 1.0 | 1.0 | 450 | $1,868 | $4.15 | 27d | 1 | 0.37mi |
| 4262 Wilson Ave #8 San Diego, CA | 1.0 | 1.0 | 550 | $1,895 | $3.45 | 5d | 1 | 0.38mi |
| 4262 Wilson Ave #8 San Diego, CA | 1.0 | 1.0 | 550 | $1,895 | $3.45 | 2d | 1 | 0.38mi |
| 4546 Boundary St Unit 4550 San Diego, CA | 1.0 | 1.0 | 550 | $1,795 | $3.26 | 23d | 1 | 0.39mi |
| 4440 Cherokee Ave #7 San Diego, CA | 1.0 | 1.0 | 511 | $2,100 | $4.11 | 27d | 1 | 0.39mi |
| 3428 Orange Ave San Diego, CA | 1.0 | 1.0 | 485 | $3,200 | $6.60 | 27d | 1 | 0.39mi |
| 4755 Felton St Unit 8 San Diego, CA | 1.0 | 1.0 | 650 | $2,725 | $4.19 | 10d | 1 | 0.39mi |
| 4422 Cherokee Ave Unit 4424 San Diego, CA | 1.0 | 1.0 | 500 | $2,495 | $4.99 | 2d | 1 | 0.40mi |
| 4436 Cherokee Ave San Diego, CA | 2.0 | 1.0 | 610 | $2,595 | $4.25 | 2d | 1 | 0.40mi |
| 4739 Bancroft St Unit 4743 San Diego, CA | 2.0 | 1.0 | 700 | $1,895 | $2.71 | 5d | 1 | 0.40mi |
Listing history 16 events
-
2026-03-17status Pending
-
2026-03-17$1,100,000 Active
-
2025-11-21soldstatus $1,100,000 Closed 16-char remark
Show marketing remark (16 chars)
Investor Special
-
2025-11-03status Pending 16-char remark
Show marketing remark (16 chars)
Investor Special
-
2025-10-28status Active 16-char remark
Show marketing remark (16 chars)
Investor Special
-
2025-09-23$1,100,000 16-char remark
Show marketing remark (16 chars)
Investor Special
-
2025-09-23historical 16-char remark
Show marketing remark (16 chars)
Investor Special
-
2024-04-07historical $1,595
-
2024-04-06historical $1,595
-
2024-03-22price $1,595
-
2024-03-21price $1,595
-
2024-03-13$1,695
-
2024-02-23$1,695
-
2023-12-10historical $1,495
-
2023-11-07price $1,495
-
2023-09-22$1,695
ⓘ Source: listings_history table (triggers on properties + properties_extension) + one-shot
backfill from property_details.listing_events for pre-trigger history.
Climate risk First Street
- Flood 1/10 Low FEMA zone X (unshaded) · 0% chance over 30 yrs
- Wildfire 1/10 Low
- Heat 4/10 Moderate 7 d/yr ≥89°F today · 20 d/yr by 30 yrs out
- Wind 1/10 Low
- Air quality 3/10 Moderate 4 unhealthy d/yr today · 4 by 30 yrs out
Nearby sold comps map
Loading sold comps map…
Walkable amenities ~0.75 mi
Loading nearby amenities…
Taxation est. · year 1
- Rental income
- $150,924
- − Mortgage interest
- −$61,617
- − Property taxes
- −$16,500
- − Insurance
- −$5,500
- − Repairs & maintenance
- −$12,074
- − Management
- −$12,074
- − Depreciation
- −$32,000
- Taxable income
- $11,159
- Est. tax owed @ 24.0%
- −$2,678
- After-tax cash flow
- $25,330/yr
For passive investors: Depreciation is non-cash, so a rental often shows a tax loss while cash-flowing — sheltering income. Rental losses are passive: they offset passive income freely, and up to $25,000/yr can offset ordinary (W-2) income if you actively participate and your MAGI is under $100k (phasing out to $0 by $150k); unused losses carry forward. On sale, claimed depreciation is recaptured at up to 25%, and gains may owe capital-gains tax (a 1031 exchange can defer both). Figures are a year-1 estimate at your 24.0% rate — not tax advice; consult a CPA.
Schools (NCES district)
- District
- San Diego Unified
- NCES district ID
- 0634320
- Math proficiency
- 19% ▼ -29.00%
- Reading proficiency
- 29% ▼ -28.00%
- Median HH income
- $61,673
- Composite
- 22.31/100
- National rank
- #8135
- State rank
- #393 of 517 in CA
Livability — San Diego
- Score
- 75/100
- State rank
- #123
- US rank
- #4206
Category grades
Schools grade is shown separately in the Schools card above.
Census & demographics
- Census place
- San Diego, CA
- County
- San Diego County · 3,178,799 people
- City population
- 1,397,612
- Metro
- San Diego-Chula Vista-Carlsbad, CA
- Population (ZIP)
- 31,843
- Household income
- $98,154
- Rent vs Own
- Severe rent burden
- 2385.0
Population outlook (San Diego County) Hauer SSP2
- Today (2025)
- 3,678,185 people
- By 2030
- 3,856,546 · +4.8%
- By 2040
- 4,171,407 · +13.4%
- By 2050
- 4,421,607 · +20.2%
- By 2075
- 4,831,599 · +31.4%
- By 2100
- 4,832,502 · +31.4%
Race, ethnicity, and origin ACS 2023
- Neighborhood character
- Diverse neighborhood (Simpson 0.62)
- Race & ethnicity
- White 54% Hispanic / Latino 30% Two or more races 17% Asian 6% Black 4%
- Hispanic origin (detail)
- Mexican 23%
- Common ancestry
- Romanian 3% Lithuanian 2% Portuguese 2%
- Foreign-born
- 15% · Canada, South Korea, China
- Languages at home
- 72% English-only · Spanish 21% Other Indo-European 2% Other Asian/Pacific 1%
Political lean MEDSL · San Diego
- 2024 margin
- D (+16.8) · D 56.9% · R 40.1% · Other 2.9%
- 2008→2024 swing
- +6.6pp toward D · 2008: 10.2pp · 2024: 16.8pp
- All cycles
- 2024: D+16.8 2020: D+22.8 2016: D+17.8 2012: D+5.1 2008: D+10.2
Not yet ingested
- Civics
- —
Market trends
- HPI YoY
- ▼ -863.79%
- Current HPI
- 378.6597
- Rent YoY
- ▲ 1.92%
- Metro
- San Diego-Chula Vista-Carlsbad, CA
- State GDP YoY
- ▲ 3.21%
- F500 in state
- 116
Industry mix (Fortune 500 HQ in CA)
| Industry | F500 HQs | Revenue |
|---|---|---|
| Technology | 27 | $1,492B |
|
||
| Financial Services | 3 | $174B |
|
||
| Retail | 3 | $44B |
|
||
| Insurance | 3 | $26B |
|
||
| Media / Entertainment | 2 | $115B |
|
||
| Pharmaceuticals / Biotech | 2 | $62B |
|
||
Price history
+64796.8% since first listed16 events — show timeline
- 2026-03-17 Pending — SDMLS
- 2026-03-17 Listed $1,100,000 SDMLS
- 2025-11-21 Sold (MLS) $1,100,000 SDMLS
- 2025-11-03 Pending — SDMLS
- 2025-10-28 Relisted — SDMLS
- 2025-09-23 Listing Removed — SDMLS
- 2025-09-23 Listed $1,100,000 SDMLS
- 2024-04-07 Rental Removed $1,595 APPFOLIO
- 2024-04-06 Rental Removed $1,595 RENT.
- 2024-03-22 Price Changed $1,595 RENT.
- 2024-03-21 Price Changed $1,595 APPFOLIO
- 2024-03-13 Listed for Rent $1,695 APPFOLIO
- 2024-02-23 Listed for Rent $1,695 RENT.
- 2023-12-10 Rental Removed $1,495 RENT.
- 2023-11-07 Price Changed $1,495 RENT.
- 2023-09-22 Listed for Rent $1,695 RENT.
Property tax history
+2.5%/yrLatest (2025): $1,629 · +4.0% YoY. Source: county tax records.
Cash-flow waterfall
monthlySold comps — $/sqft
last 12 mo · ≤1 miLoading sold comps…