 🏷️ Likely Rental
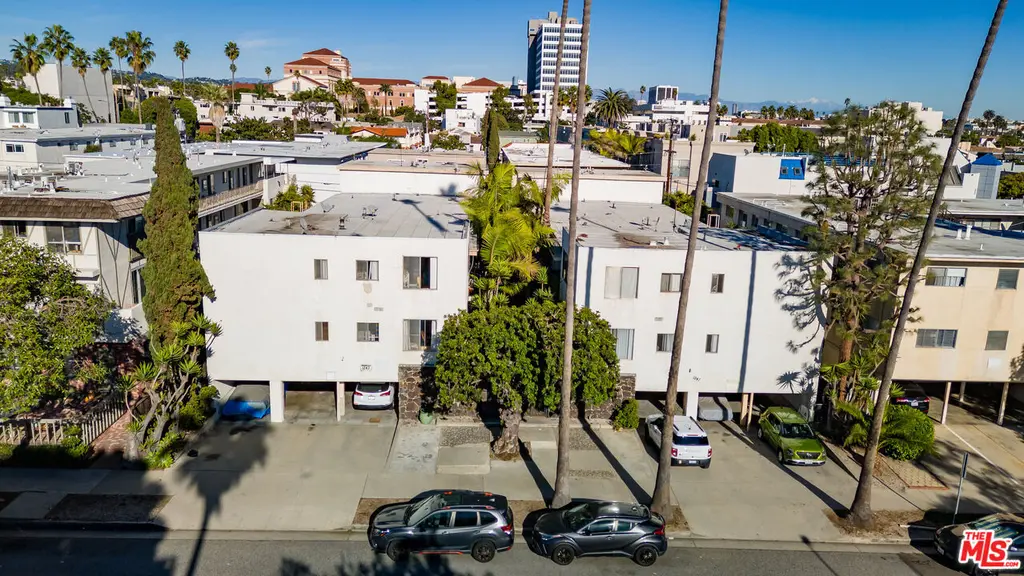
1243 12th St · Santa Monica, CA
Flood risk 1/10 · Minimal
- FEMA flood zone
- X (unshaded)
- Chance of flooding over 30 yrs
- 0.0%
- Est. flood insurance / yr
- $507 – $1,088
Fire risk 1/10 · Minimal
- Est. fire insurance / yr
- $659 – $1,223
Heat risk 7/10 · Major
- Hot days now (above 80°F)
- 7 days/yr
- Hot days in 30 yrs
- 20 days/yr
Wind risk 1/10 · Minimal
- Chance of severe wind over 30 yrs
- —
Air-quality risk 4/10 · Minor
- Unhealthy air days now
- 5 days/yr
- Unhealthy air days in 30 yrs
- 6 days/yr
Risk factors via First Street. Map © Google.
Why this score? — see what drove the A- grade
The composite is a weighted blend of 9 inputs, each scored 0–100. Each bar is that input's sub-score; the figure is the points it added to the 100-point composite (weight × sub-score).
- Cash flow +30.0/30.0
- ARV discount +15.0/15.0
- DSCR +10.0/10.0
- 1% rule +9.5/10.0
- Schools +6.2/10.0
- Appreciation +5.7/10.0
- Livability +3.6/5.0
- Condition / age +2.5/5.0
- Rent growth +1.5/5.0
$5,250,000
🖨 Deal sheet (PDF) 📄 Offer letter ✓ Due diligence
Multi-family units
County records classify this as Multi-Family (5+ Unit). Listing-text estimate: 20 units. confirmed
5+ unit building — per-unit beds/baths from public records are typically unavailable; the breakdown below (if shown) is an estimate from the listing text.
Listing remarks MLS
1243 & 1247 12th St consist of two adjacent ten-unit apartment buildings located between Wilshire Blvd and Arizona Ave in prime Santa Monica, approximately 12 blocks from the beach. Built in 1959, the properties total 18,832 square feet of improvements on a 15,007-square-foot double lot with two separate APNs, offering long-term ownership, financing, and disposition flexibility. Each building is approximately 9,416 square feet, and together the portfolio features an attractive and highly functional 20-unit mix comprised of (4) 1-bed/1-bath, (6) 2-bed/1.5-bath, (6) 2-bed/2-bath, (2) 3-bed/1.5-bath, and (2) 3-bed/2-bath units. This balanced mix appeals to a wide renter base and positions the asset for long-term revenue growth as turnover occurs. The property provides 22 parking spaces, including six tandem spaces at the front and ten standard spaces at the rear, along with a controlled-access, gated entry and on-site laundry facilities. The soft-story seismic retrofit has been completed (buyer to verify). Priced at an attractive basis compared to recent sale comparables at $327k/unit and $428/square-foot, with strong underlying land value and scale in one of the Westside's most supply-constrained submarkets. 1243 & 1247 12th St offer investors a rare opportunity to acquire two contiguous buildings in an irreplaceable coastal location with meaningful operational and appreciation upside.
Key facts
- 20-unit mix
- 15
- Two separate apns
Tags
Neighborhood map
What this means for you Summary
Snapshot
- This is a 4×1bd/1ba + 6×2bd/1.5ba + 6×2bd/2ba units multifamily listed at $5.25M.
Deal economics
- At list price, monthly cash flow is $28k ($337k/yr) — positive. Per door: $1k/mo.
- The deal already cash-flows at list — no discount required.
- Meets the 1% rule at list price ($76k rent vs $5.25M).
- Recommended offer: $4.62M (12.0% below list) — sets the bar for market timing.
Location & tenants
- Location reads 72/100 on livability (#178 in CA) — a middle-class / working-renter tenant base. Strengths: amenities A+, commute A+, employment A+; Watch: health & safety C-, crime F, cost of living F.
- Santa Monica-Malibu Unified (urban): math 61% / reading 74% proficiency, ranked #123 of 1,400 in CA (top 9%) — acceptable for families but not a draw, mixed tenant base, ~2y average lease.
- Zoned schools: Mckinley Elementary (403 students, 34% FRL); Lincoln Middle (math 24% / reading 24%, grade F, #277 of 498 statewide, top 73%, 854 students, 22% FRL); Santa Monica High (2,678 students, 30% FRL).
- Zoned-school proficiency averages 24% at this address vs 68% district-wide (-43 pts) — the specific schools serving this property underperform the Santa Monica-Malibu Unified average; the district grade overstates school quality for this exact location.
- Market conditions: Rents falling (-4.1%/yr); 28 active listings in the ZIP; high-income renter base; 19,697 units permitted in Los Angeles County in 2024 (9,426 in 5+ unit buildings).
Forward outlook
- In year one you build about $113k of equity ($36k loan paydown + $77k appreciation (1.5% local appreciation)).
- Los Angeles County population projected at +9% by 2050 — modest demand growth; plan on rents tracking national, not racing it.
- At projected returns (1.5% appreciation + 0.0% rent growth), your $1.47M cash investment doubles in ~4 years — after that, you're playing with house money.
- By year 4, paydown + projected appreciation supports a ~$398k cash-out refi (75% LTV) — recoverable capital for the next deal without selling this one.
Negotiation context
- It's been on market 181 days — a 12% lower offer ($4.62M) is reasonable based on typical stale-listing flexibility.
- 2 sale attempts; this cycle's ask has dropped $750k (12%) from the opening price — seller is motivated, your offer sets the floor, not the list.
- Current owner paid $1.51M; list at $5.25M implies a 249% gain — meaningful room to come down on a strong offer.
Risks & watch-outs
- Watch-outs: built in 1959 — expect roof / HVAC / electrical / plumbing capex.
Questions for the listing agent
- It's been on market 181 days. Have you received any prior offers? Is the seller open to a 12% concession, seller financing, or rate buy-down credit?
- Can we see the unit-by-unit rent roll, current vacancy, and any below-market leases? What's the average tenancy length?
- What capital expenditures (roof, boiler, parking lot, exteriors) have been made in the last 5 years, and what's planned in the next 2?
- Built in 1959 — when were the roof, HVAC, electrical panel, plumbing, and water heater last replaced?
- Why hasn't it sold? Are there any deal-killer items the seller is aware of (foundation, flood, title, zoning, code violations)?
- Is there a deadline driving the sale (1031 exchange, divorce, estate, relocation)? That informs how much negotiation room exists.
- Schools are A-rated — typically a magnet for longer-tenancy family renters. What's the average tenant stay here, and is there a school-zone premium baked into asking?
- Crime grade is F in this area — have there been break-ins, vandalism, or insurance claims at this property in the last 3 years? What carrier currently insures it and at what premium?
- What's the average days-on-market for RENTAL listings here right now (not sales)? A rising rental-DOM trend means longer vacancies and softer asking-rent achievability than the comps imply.
- What's the recent tenant-quality profile in this submarket — average credit score on applications, eviction rate, late-payment / NSF rate, and stable-employment percentage? A property-management company in the area should have these aggregated.
- How much new apartment / multifamily construction is in the pipeline within 1–3 miles? Heavy new supply (>2% of stock underway) typically softens rents 12–24 months out; light construction supports rent growth.
Investment metrics
- 1% rule
- 1.45% ✓
- Cap rate
- 12.70%
- Cash-on-cash
- 22.90%
- DSCR
- 2.02
- GRM
- 5.7
CMA / ARV
- ARV (median comp)
- $6,664,362
- List price
- $5,250,000
- Delta
- -21.22%
- Verdict
- UNDERPRICED
- Comps
- 5 within 1.0 mi
Show comp detail 4 sales within ~0.75 mi
| Address | Dist | Beds/Ba | Sqft | Sold | Price | $/sf | Match |
|---|---|---|---|---|---|---|---|
| 1518 10th St | 0.39mi | 17/18.0 (-1) | 10,080 (+7%) | 10mo | $3,637,000 | $361 | 57 |
| 1111 Lincoln Blvd | 0.37mi | 18/18.0 | 10,356 (+10%) | 22mo | $3,874,000 | $374 | 48 |
| 854 9th St | 0.57mi | 18/18.0 | 10,356 (+10%) | 15mo | $3,815,000 | $368 | 44 |
| 1427 15th St | 0.32mi | 18/13.0 | 8,623 (-8%) | 15mo | $2,110,000 | $245 | 39 |
Match score weights: distance 35% · size 25% · config 20% · recency 20%. Top-matched comps best support the ARV.
Projected returns pro-forma
1.46% appreciation · 0.0% rent growth · sell at horizon
- IRR
- 23.7%
- Equity multiple
- 2.21×
- Total profit
- $1,779,324
- Equity at exit
- $1,919,266
- IRR
- 24.3%
- Equity multiple
- 3.80×
- Total profit
- $4,116,909
- Equity at exit
- $2,651,797
Cash invested: $1,470,000 (down + closing). Projections, not guarantees.
Landlord ↔ Tenant lean methodology
- Overall (STATE)
- 18 Strongly Tenant-Friendly
- State California
- 18 Strongly Tenant-Friendly · D+13
- County
- — inherits STATE
- City
- — inherits STATE
ZIP-level market 90401
- Home prices YoY
- 0.5%
- Rents YoY
- -4.1%
- Active inventory
- 28
- Price-to-rent
- 145.7×
Monthly cashflow live
- Estimated rent
- $76,192 high interval (Pro) →
- Mortgage (P&I)
- −$27,532
- Tax from tax record
- −$2,424 /mo · $29,085/yr
- Insurance
- −$2,188
- HOA
- −$0
- Vacancy / Maint / Mgmt
- −$16,000
- Net cashflow
- $28,049
Break-even live
Sensitivity live
| Price | -10% $31,021 | -5% $29,535 | +0% $28,049 | +5% $26,563 | +10% $25,077 |
|---|---|---|---|---|---|
| Rent | -10% $22,030 | -5% $25,039 | +0% $28,049 | +5% $31,058 | +10% $34,068 |
| Rate | -1.0pp $30,693 | -0.5pp $29,384 | base $28,049 | +0.5pp $26,688 | +1.0pp $25,304 |
20-unit breakdown (identical units grouped — click to expand)
| Units | Beds | Baths | Est. rent |
|---|---|---|---|
| 4× units | 1 | 1 | $12,008 |
| #1 | 1 | 1 | $3,002 |
| #2 | 1 | 1 | $3,002 |
| #3 | 1 | 1 | $3,002 |
| #4 | 1 | 1 | $3,002 |
| 6× units | 2 | 1.5 | $21,426 |
| #5 | 2 | 1.5 | $3,571 |
| #6 | 2 | 1.5 | $3,571 |
| #7 | 2 | 1.5 | $3,571 |
| #8 | 2 | 1.5 | $3,571 |
| #9 | 2 | 1.5 | $3,571 |
| #10 | 2 | 1.5 | $3,571 |
| 6× units | 2 | 2 | $21,426 |
| #11 | 2 | 2 | $3,571 |
| #12 | 2 | 2 | $3,571 |
| #13 | 2 | 2 | $3,571 |
| #14 | 2 | 2 | $3,571 |
| #15 | 2 | 2 | $3,571 |
| #16 | 2 | 2 | $3,571 |
| 2× units | 3 | 1.5 | $10,664 |
| #17 | 3 | 1.5 | $5,332 |
| #18 | 3 | 1.5 | $5,332 |
| 2× units | 3 | 2 | $10,664 |
| #19 | 3 | 2 | $5,332 |
| #20 | 3 | 2 | $5,332 |
| Total (20 units) | $76,192 | ||
UW: 25.0% down · 7.5% · 30yr · 1.5% tax · 5.0% vac · 8.0% maint · 8.0% mgmt
Financing live
Cash to close
- Down payment
- $1,312,500
- Closing costs
- $157,500
- Reserves months
- —
- Total cash needed
- —
Loan-product check · same deal, 3 products live
Conventional
25% down · 7.5% · 30yr
- Down + closing
- —
- Monthly P&I
- —
- Monthly cashflow
- —
- DSCR
- —
- Eligible?
- —
Personal DTI + credit; lowest rate.
DSCR
20% down · 8.5% · 30yr
- Down + closing
- —
- Monthly P&I
- —
- Monthly cashflow
- —
- DSCR
- —
- Eligible?
- —
No personal income docs; deal must DSCR.
Hard money
10% down · 12.0% · 12mo
- Down + closing
- —
- Monthly P&I
- —
- Monthly cashflow
- —
- DSCR
- —
- Eligible?
- —
Short-term bridge; refi at stabilization.
Listing history 23 events
-
2026-06-21days on market $5,250,000 Active 181 DOM
-
2026-06-18days on market $5,250,000 Active 178 DOM
-
2026-06-17days on market $5,250,000 Active 177 DOM
-
2026-06-16days on market $5,250,000 Active 176 DOM
-
2026-06-15days on market $5,250,000 Active 175 DOM
-
2026-06-13days on market $5,250,000 Active 173 DOM
-
2026-06-13days on market $5,250,000 Active 172 DOM
-
2026-06-09days on market $5,250,000 Active 169 DOM
-
2026-06-08days on market $5,250,000 Active 168 DOM
-
2026-06-07days on market $5,250,000 Active 167 DOM
-
2026-06-04days on market $5,250,000 Active 164 DOM
-
2026-06-03days on market $5,250,000 Active 163 DOM
-
2026-06-02days on market $5,250,000 Active 162 DOM
-
2026-06-01days on market $5,250,000 Active 161 DOM
-
2026-05-31days on market $5,250,000 Active 160 DOM
-
2026-05-15status Active 1418-char remark
Show marketing remark (1418 chars)
1243 & 1247 12th St consist of two adjacent ten-unit apartment buildings located between Wilshire Blvd and Arizona Ave in prime Santa Monica, approximately 12 blocks from the beach. Built in 1959, the properties total 18,832 square feet of improvements on a 15,007-square-foot double lot with two separate APNs, offering long-term ownership, financing, and disposition flexibility. Each building is approximately 9,416 square feet, and together the portfolio features an attractive and highly functional 20-unit mix comprised of (4) 1-bed/1-bath, (6) 2-bed/1.5-bath, (6) 2-bed/2-bath, (2) 3-bed/1.5-bath, and (2) 3-bed/2-bath units. This balanced mix appeals to a wide renter base and positions the asset for long-term revenue growth as turnover occurs. The property provides 22 parking spaces, including six tandem spaces at the front and ten standard spaces at the rear, along with a controlled-access, gated entry and on-site laundry facilities. The soft-story seismic retrofit has been completed (buyer to verify). Priced at an attractive basis compared to recent sale comparables at $327k/unit and $428/square-foot, with strong underlying land value and scale in one of the Westside's most supply-constrained submarkets. 1243 & 1247 12th St offer investors a rare opportunity to acquire two contiguous buildings in an irreplaceable coastal location with meaningful operational and appreciation upside.
-
2026-05-15price $5,250,000 1418-char remark
Show marketing remark (1418 chars)
1243 & 1247 12th St consist of two adjacent ten-unit apartment buildings located between Wilshire Blvd and Arizona Ave in prime Santa Monica, approximately 12 blocks from the beach. Built in 1959, the properties total 18,832 square feet of improvements on a 15,007-square-foot double lot with two separate APNs, offering long-term ownership, financing, and disposition flexibility. Each building is approximately 9,416 square feet, and together the portfolio features an attractive and highly functional 20-unit mix comprised of (4) 1-bed/1-bath, (6) 2-bed/1.5-bath, (6) 2-bed/2-bath, (2) 3-bed/1.5-bath, and (2) 3-bed/2-bath units. This balanced mix appeals to a wide renter base and positions the asset for long-term revenue growth as turnover occurs. The property provides 22 parking spaces, including six tandem spaces at the front and ten standard spaces at the rear, along with a controlled-access, gated entry and on-site laundry facilities. The soft-story seismic retrofit has been completed (buyer to verify). Priced at an attractive basis compared to recent sale comparables at $327k/unit and $428/square-foot, with strong underlying land value and scale in one of the Westside's most supply-constrained submarkets. 1243 & 1247 12th St offer investors a rare opportunity to acquire two contiguous buildings in an irreplaceable coastal location with meaningful operational and appreciation upside.
-
2026-02-17historical Backup Offers Accepted 1418-char remark
Show marketing remark (1418 chars)
1243 & 1247 12th St consist of two adjacent ten-unit apartment buildings located between Wilshire Blvd and Arizona Ave in prime Santa Monica, approximately 12 blocks from the beach. Built in 1959, the properties total 18,832 square feet of improvements on a 15,007-square-foot double lot with two separate APNs, offering long-term ownership, financing, and disposition flexibility. Each building is approximately 9,416 square feet, and together the portfolio features an attractive and highly functional 20-unit mix comprised of (4) 1-bed/1-bath, (6) 2-bed/1.5-bath, (6) 2-bed/2-bath, (2) 3-bed/1.5-bath, and (2) 3-bed/2-bath units. This balanced mix appeals to a wide renter base and positions the asset for long-term revenue growth as turnover occurs. The property provides 22 parking spaces, including six tandem spaces at the front and ten standard spaces at the rear, along with a controlled-access, gated entry and on-site laundry facilities. The soft-story seismic retrofit has been completed (buyer to verify). Priced at an attractive basis compared to recent sale comparables at $327k/unit and $428/square-foot, with strong underlying land value and scale in one of the Westside's most supply-constrained submarkets. 1243 & 1247 12th St offer investors a rare opportunity to acquire two contiguous buildings in an irreplaceable coastal location with meaningful operational and appreciation upside.
-
2025-12-22$6,000,000 Active 1418-char remark
Show marketing remark (1418 chars)
1243 & 1247 12th St consist of two adjacent ten-unit apartment buildings located between Wilshire Blvd and Arizona Ave in prime Santa Monica, approximately 12 blocks from the beach. Built in 1959, the properties total 18,832 square feet of improvements on a 15,007-square-foot double lot with two separate APNs, offering long-term ownership, financing, and disposition flexibility. Each building is approximately 9,416 square feet, and together the portfolio features an attractive and highly functional 20-unit mix comprised of (4) 1-bed/1-bath, (6) 2-bed/1.5-bath, (6) 2-bed/2-bath, (2) 3-bed/1.5-bath, and (2) 3-bed/2-bath units. This balanced mix appeals to a wide renter base and positions the asset for long-term revenue growth as turnover occurs. The property provides 22 parking spaces, including six tandem spaces at the front and ten standard spaces at the rear, along with a controlled-access, gated entry and on-site laundry facilities. The soft-story seismic retrofit has been completed (buyer to verify). Priced at an attractive basis compared to recent sale comparables at $327k/unit and $428/square-foot, with strong underlying land value and scale in one of the Westside's most supply-constrained submarkets. 1243 & 1247 12th St offer investors a rare opportunity to acquire two contiguous buildings in an irreplaceable coastal location with meaningful operational and appreciation upside.
-
2022-03-13price $2,250
-
2006-06-07soldstatus $1,506,000
-
1985-06-19soldstatus $900,000
-
1985-06-19soldstatus $20,000
ⓘ Source: listings_history table (triggers on properties + properties_extension) + one-shot
backfill from property_details.listing_events for pre-trigger history.
Tax reassessment forecast CA · Resets to sale price
- Current annual tax
- $29,085 · $2,424/mo
- Projected year-2 tax
- $39,900 · $3,325/mo
- Expected delta
- +$10,815/yr (+$901/mo · 37.2%)
ⓘ Screening estimate from a state-policy table — verify with the county assessor before closing.
Climate risk First Street
- Flood 1/10 Low FEMA zone X (unshaded) · 0% chance over 30 yrs
- Wildfire 1/10 Low
- Heat 7/10 Severe 7 d/yr ≥80°F today · 20 d/yr by 30 yrs out
- Wind 1/10 Low
- Air quality 4/10 Moderate 5 unhealthy d/yr today · 6 by 30 yrs out
Nearby sold comps map
Loading sold comps map…
Walkable amenities ~0.75 mi
Loading nearby amenities…
Taxation est. · year 1
- Rental income
- $914,304
- − Mortgage interest
- −$294,082
- − Property taxes
- −$29,085
- − Insurance
- −$26,250
- − Repairs & maintenance
- −$73,144
- − Management
- −$73,144
- − Depreciation
- −$152,727
- Taxable income
- $265,871
- Est. tax owed @ 24.0%
- −$63,809
- After-tax cash flow
- $272,777/yr
For passive investors: Depreciation is non-cash, so a rental often shows a tax loss while cash-flowing — sheltering income. Rental losses are passive: they offset passive income freely, and up to $25,000/yr can offset ordinary (W-2) income if you actively participate and your MAGI is under $100k (phasing out to $0 by $150k); unused losses carry forward. On sale, claimed depreciation is recaptured at up to 25%, and gains may owe capital-gains tax (a 1031 exchange can defer both). Figures are a year-1 estimate at your 24.0% rate — not tax advice; consult a CPA.
Schools (NCES district)
- District
- Santa Monica-Malibu Unified
- NCES district ID
- 0635700
- Math proficiency
- 61% ▬ 0.00%
- Reading proficiency
- 74% ▬ 0.00%
- Median HH income
- $81,489
- Composite
- 61.58/100
- National rank
- #1535
- State rank
- #123 of 1400 in CA
Livability — Santa Monica
- Score
- 72/100
- State rank
- #178
- US rank
- #5878
Category grades
Schools grade is shown separately in the Schools card above.
Census & demographics
- Census place
- Santa Monica, CA
- County
- Los Angeles County · 9,444,647 people
- City population
- 93,581
- Metro
- Los Angeles-Long Beach-Anaheim, CA
- Population (ZIP)
- 8,101
- Household income
- $110,385
- Rent vs Own
- Severe rent burden
- 1039.0
Population outlook (Los Angeles County) Hauer SSP2
- Today (2025)
- 10,940,515 people
- By 2030
- 11,256,481 · +2.9%
- By 2040
- 11,729,929 · +7.2%
- By 2050
- 11,948,407 · +9.2%
- By 2075
- 11,818,114 · +8.0%
- By 2100
- 10,842,928 · -0.9%
Race, ethnicity, and origin ACS 2023
- Neighborhood character
- Predominantly White (71%)
- Race & ethnicity
- White 71% Two or more races 14% Hispanic / Latino 10% Asian 6% Black 4%
- Hispanic origin (detail)
- Mexican 5% Salvadoran 1%
- Common ancestry
- Scotch-Irish 6% Romanian 4% Italian 4%
- Foreign-born
- 28% · Canada, China, Dominican Republic
- Languages at home
- 75% English-only · Spanish 7% Other Indo-European 6% Russian/Polish/Slavic 2%
Political lean MEDSL · Los Angeles
- 2024 margin
- Solid D (+32.9) · D 64.8% · R 31.9% · Other 3.3%
- 2008→2024 swing
- -7.4pp toward R · 2008: 40.4pp · 2024: 32.9pp
- All cycles
- 2024: D+32.9 2020: D+44.2 2016: D+48.0 2012: D+40.0 2008: D+40.4
Not yet ingested
- Civics
- —
Market trends
- HPI YoY
- ▲ 1.46%
- Current HPI
- 273.1797
- Rent YoY
- ▼ -4.14%
- Metro
- Los Angeles-Long Beach-Anaheim, CA
- State GDP YoY
- ▲ 3.21%
- F500 in state
- 116
Industry mix (Fortune 500 HQ in CA)
| Industry | F500 HQs | Revenue |
|---|---|---|
| Technology | 27 | $1,492B |
|
||
| Financial Services | 3 | $174B |
|
||
| Retail | 3 | $44B |
|
||
| Insurance | 3 | $26B |
|
||
| Media / Entertainment | 2 | $115B |
|
||
| Pharmaceuticals / Biotech | 2 | $62B |
|
||
Price history
+483.3% since first listed8 events — show timeline
- 2026-05-15 Relisted — TheMLS
- 2026-05-15 Price Changed $5,250,000 TheMLS
- 2026-02-17 Contingent — TheMLS
- 2025-12-22 Listed $6,000,000 TheMLS
- 2022-03-13 Price Changed $2,250 RENT.
- 2006-06-07 Sold (Public Records) $1,506,000 Public Records
- 1985-06-19 Sold (Public Records) $20,000 Public Records
- 1985-06-19 Sold (Public Records) $900,000 Public Records
Property tax history
+2.2%/yrLatest (2025): $29,085 · +6.7% YoY. Source: county tax records.
Cash-flow waterfall
monthlySold comps — $/sqft
last 12 mo · ≤1 miLoading sold comps…