 5-Plex
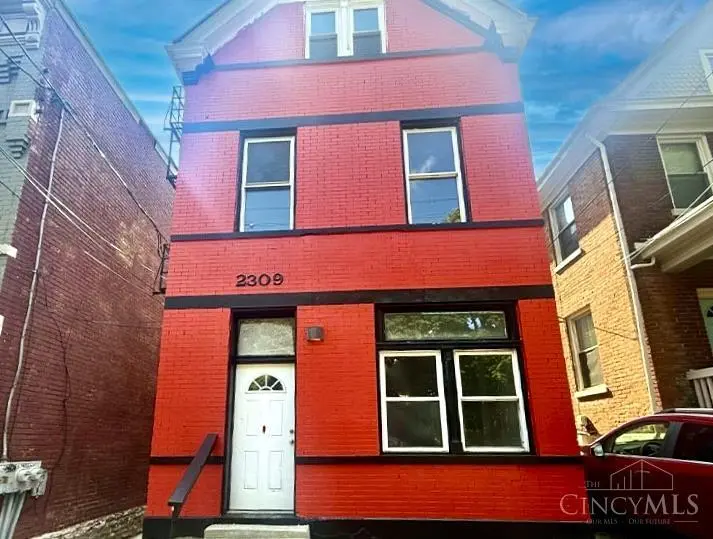
2309 W Clifton Ave · Cincinnati, OH
Flood risk 6/10 · Moderate
- FEMA flood zone
- X (unshaded)
- Chance of flooding over 30 yrs
- 0.7%
- Est. flood insurance / yr
- $473 – $860
Fire risk 1/10 · Minimal
- Est. fire insurance / yr
- $713 – $1,323
Heat risk 4/10 · Minor
- Hot days now (above 103°F)
- 7 days/yr
- Hot days in 30 yrs
- 19 days/yr
Wind risk 2/10 · Minimal
- Chance of severe wind over 30 yrs
- 1.0%
Air-quality risk 3/10 · Minor
- Unhealthy air days now
- 2 days/yr
- Unhealthy air days in 30 yrs
- 3 days/yr
Risk factors via First Street. Map © Google.
Why this score? — see what drove the D+ grade
The composite is a weighted blend of 9 inputs, each scored 0–100. Each bar is that input's sub-score; the figure is the points it added to the 100-point composite (weight × sub-score).
- Cash flow +21.4/30.0
- DSCR +6.8/10.0
- 1% rule +5.0/10.0
- Livability +4.0/5.0
- Rent growth +3.0/5.0
- Schools +2.5/10.0
- Condition / age +2.5/5.0
- ARV discount +0.0/15.0
- Appreciation +0.0/10.0
$549,000
🖨 Deal sheet 📄 Offer letter ✓ Due diligence
Multi-family units
County records classify this as Multi-Family (2-4 Unit). Listing-text estimate: 5 units. estimate disagrees with records
Listing remarks
Location, condition, and cash flow this Clifton 5-family is situated blocks from UC on major bus and shuttle routes, this historic 19th-century brick multi-family. The exterior shines with a brand-new roof, newer windows, and fresh, thematic Bearcat black-and-red paint. Three units have been beautifully refreshed for immediate occupancy with historic character and modern appeal. With separate utility meters paid entirely by the tenants, your overhead remains low. A premier, turnkey property in Cincinnati's strongest student and professional rental corridor.
Key facts
- Turnkey property
- Modern appeal
- Brand-new roof
Tags
Property features AI
Finance
- Financial info: Currently rented studio units; 1-bedroom units vacant; Three 1-bedroom units quoted at $1,000 rent each; Two efficiency units quoted at $500 rent each
Exterior
- Parking: On-street parking
- Utilities: Public water; Public sewer; Natural gas
- Home design: Brick construction; Three or more stories
- Construction: Membrane roof
- Exterior features: Vinyl, double-hung, insulated windows; Stone foundation; No fireplace
Interior
- Bedrooms: Five-unit building with three 1-bedroom units and two efficiency (studio) units
- Heating & cooling: Electric and natural gas heating; Window air-conditioning units
- Interior features: Partial basement
Neighborhood map
What this means for you Summary
Snapshot
- This is a 5 × 1-bed/?-bath units multifamily listed at $549k.
Deal economics
- At list price, monthly cash flow is $818 ($10k/yr) — positive. Per door: $164/mo.
- The deal already cash-flows at list — no discount required.
- To meet the 1% rule (rent ≥ 1% of price), the offer needs to be $548k (0.1% below list).
- Recommended offer: $541k (1.5% below list) — sets the bar for market timing.
- Cap rate 8.1% vs local median 3.9% in Cincinnati — top-decile yield for the area; either an underpriced asset or a hidden risk that comps aren't pricing in. Stress-test before assuming the spread holds.
Location & tenants
- Location reads 80/100 on livability (#130 in OH, #1,856 nationally) — a professional / high-income tenant draw. Strengths: amenities A+, commute A+, cost of living A+; Watch: employment D, crime F.
- Cincinnati Public Schools (urban): math 25% / reading 36% proficiency, ranked #581 of 656 in OH (top 89%) — families likely to look elsewhere, expect single-tenant / working-renter base with shorter leases; 70% free/reduced lunch — lower-income household profile, screen leases tightly.
- Market conditions: Rents rising (+2.1%/yr); 71 active listings in the ZIP; 31 comparable units currently listed for rent nearby; rentals at typical pace (median 17d on market — plan ~3-4 weeks tenant-placement turnaround); lower-income renter base — watch delinquency; 801 units permitted in Hamilton County in 2024 (190 in 5+ unit buildings).
- At $5,482/mo this rent would consume 184% of the median local household income ($36k/yr) (locally 2461% of renters already pay >50% of income on rent) — very limited rent-growth headroom before tenants either downsize or default.
Forward outlook
- Local home prices are declining (-3.0%/yr); year-one equity from $4k of loan paydown is wiped out by about $16k of value loss. Plan a longer hold.
Negotiation context
- It's been on market 17 days — a 2% lower offer ($541k) is reasonable based on typical stale-listing flexibility.
Risks & watch-outs
- Watch-outs: built in 1891 — expect roof / HVAC / electrical / plumbing capex.
- Climate carrying-cost: major flood risk — expect insurance premiums to compound above CPI over the hold.
Questions for the listing agent
- Can we see the unit-by-unit rent roll, current vacancy, and any below-market leases? What's the average tenancy length?
- What capital expenditures (roof, boiler, parking lot, exteriors) have been made in the last 5 years, and what's planned in the next 2?
- Built in 1891 — when were the roof, HVAC, electrical panel, plumbing, and water heater last replaced?
- Is there a deadline driving the sale (1031 exchange, divorce, estate, relocation)? That informs how much negotiation room exists.
- Schools are B-rated — typically a magnet for longer-tenancy family renters. What's the average tenant stay here, and is there a school-zone premium baked into asking?
- Crime grade is F in this area — have there been break-ins, vandalism, or insurance claims at this property in the last 3 years? What carrier currently insures it and at what premium?
- The area grade is low — what's the realistic commute time and amenity access for the typical tenant pool here? Any planned neighborhood developments (good or bad) we should know about?
- What's the average days-on-market for RENTAL listings here right now (not sales)? A rising rental-DOM trend means longer vacancies and softer asking-rent achievability than the comps imply.
- What's the recent tenant-quality profile in this submarket — average credit score on applications, eviction rate, late-payment / NSF rate, and stable-employment percentage? A property-management company in the area should have these aggregated.
- How much new apartment / multifamily construction is in the pipeline within 1–3 miles? Heavy new supply (>2% of stock underway) typically softens rents 12–24 months out; light construction supports rent growth.
Investment metrics
- 1% rule
- 1.00% ✗
- Cap rate
- 8.08%
- Cash-on-cash
- 6.39%
- DSCR
- 1.28
- GRM
- 8.3
CMA / ARV
- ARV (on-the-fly)
- $387,752
- Comps found
- 12
Show comp detail 12 sales within ~0.75 mi
| Address | Dist | Beds/Ba | Sqft | Sold | Price | $/sf | Match |
|---|---|---|---|---|---|---|---|
| 133 Parker St | 0.08mi | 4/2.5 (+1) | 2,433 (-5%) | 10mo | $370,000 | $152 | 75 |
| 2334 W Clifton Ave | 0.07mi | 3/— | 2,680 (+5%) | 19mo | $450,000 | $168 | 72 |
| 258 Warner St | 0.16mi | 3/3.0 | 2,626 (+3%) | 20mo | $289,500 | $110 | 71 |
| 535 Klotter Ave | 0.54mi | 3/3.0 | 2,410 (-6%) | 2mo | $430,000 | $178 | 64 |
| 1606 Elm St | 0.73mi | 3/3.0 | 2,592 (+2%) | 1mo | $135,000 | $52 | 63 |
| 2226 Ravine St | 0.30mi | 4/2.0 (+1) | 2,270 (-11%) | 0mo | $297,500 | $131 | 62 |
| 318 Mohawk St | 0.33mi | 3/2.0 | 2,226 (-13%) | 2mo | $380,000 | $171 | 62 |
| 458 W Mcmicken Ave | 0.45mi | 3/2.0 | 2,832 (+11%) | 11mo | $215,000 | $76 | 52 |
| 458 Lloyd Pl | 0.46mi | 3/3.5 | 2,217 (-13%) | 9mo | $344,900 | $156 | 50 |
| 618 Klotter Ave | 0.61mi | 3/3.0 | 2,750 (+8%) | 15mo | $531,000 | $193 | 46 |
| 151 Goethe St | 0.66mi | 3/2.5 | 2,907 (+14%) | 14mo | $400,000 | $138 | 34 |
| 813 Livingston St | 0.72mi | 2/— (-1) | 2,386 (-6%) | 20mo | $38,000 | $16 | 34 |
Match score weights: distance 35% · size 25% · config 20% · recency 20%. Top-matched comps best support the ARV.
Projected returns pro-forma
-3.0% appreciation · 2.07% rent growth · sell at horizon
- IRR
- -7.5%
- Equity multiple
- 0.73×
- Total profit
- $-42,015
- Equity at exit
- $81,858
- IRR
- 0.9%
- Equity multiple
- 1.06×
- Total profit
- $9,690
- Equity at exit
- $47,467
Cash invested: $153,720 (down + closing). Projections, not guarantees.
Landlord ↔ Tenant lean methodology
- Overall (STATE)
- 73 Landlord-Friendly
- State Ohio
- 73 Landlord-Friendly · R+6
- County
- — inherits STATE
- City
- — inherits STATE
ZIP-level market 45219
- Home prices YoY
- -28.3%
- Rents YoY
- 2.1%
- Active inventory
- 71
- Price-to-rent
- 41.7×
Monthly cashflow live
- Estimated rent
- $5,482 high interval (Pro) →
- Mortgage (P&I)
- −$2,879
- Tax from tax record
- −$405 /mo · $4,856/yr
- Insurance
- −$229
- HOA
- −$0
- Vacancy / Maint / Mgmt
- −$1,151
- Net cashflow
- $818
Break-even live
5-unit breakdown (identical units grouped — click to expand)
| Units | Beds | Baths | Est. rent |
|---|---|---|---|
| 5× units | 1 | — | $5,480 |
| #1 | 1 | — | $1,096 |
| #2 | 1 | — | $1,096 |
| #3 | 1 | — | $1,096 |
| #4 | 1 | — | $1,096 |
| #5 | 1 | — | $1,096 |
| Total (5 units) | $5,482 | ||
UW: 25.0% down · 7.5% · 30yr · 1.5% tax · 5.0% vac · 8.0% maint · 8.0% mgmt
Financing live
Cash to close
- Down payment
- $137,250
- Closing costs
- $16,470
- Reserves months
- —
- Total cash needed
- —
Loan-product check · same deal, 3 products live
Conventional
25% down · 7.5% · 30yr
- Down + closing
- —
- Monthly P&I
- —
- Monthly cashflow
- —
- DSCR
- —
- Eligible?
- —
Personal DTI + credit; lowest rate.
DSCR
20% down · 8.5% · 30yr
- Down + closing
- —
- Monthly P&I
- —
- Monthly cashflow
- —
- DSCR
- —
- Eligible?
- —
No personal income docs; deal must DSCR.
Hard money
10% down · 12.0% · 12mo
- Down + closing
- —
- Monthly P&I
- —
- Monthly cashflow
- —
- DSCR
- —
- Eligible?
- —
Short-term bridge; refi at stabilization.
Rent comps 31 comps
| Address | Beds | Baths | Sqft | Rent | $/sqft | DOM | Units | Dist |
|---|---|---|---|---|---|---|---|---|
| 2332 Chickasaw St Unit 1 Cincinnati, OH | 3.0 | 1.0 | 2000 | $1,800 | $0.90 | 23d | 1 | 0.18mi |
| 2235 Victor St Cincinnati, OH | 4.0 | 2.0 | 2043 | $2,250 | $1.10 | 23d | 1 | 0.22mi |
| 2271 Vine St Cincinnati, OH | 4.0 | 2.0 | 2268 | $1,525 | $0.67 | 4d | 1 | 0.28mi |
| 107 E Clifton Ave Unit 1234537P Cincinnati, OH | 2.0–3.0 | 1.0–2.0 | 2260 | $6,619 | $2.93 | 14d | 2 | 0.34mi |
| 55 Mulberry St Cincinnati, OH | 3.0 | 3.0 | 2500 | $3,500 | $1.40 | 23d | 1 | 0.47mi |
| 472 Dayton St Cincinnati, OH | 2.0 | 1.5 | 2519 | $1,500 | $0.60 | 4d | 1 | 0.52mi |
| 111 W Elder St Unit 1056044P Cincinnati, OH | 1.0–4.0 | 1.0–4.0 | 1835 | $5,561 | $3.03 | 10d | 2 | 0.62mi |
| 216 Gilman Ave Unit 1363975P Cincinnati, OH | 3.0 | 1.0 | 1776 | $3,474 | $1.96 | 3d | 1 | 0.68mi |
| 2704 W McMicken Ave Unit 2 Cincinnati, OH | 3.0 | 1.0 | 1760 | $1,500 | $0.85 | 23d | 1 | 0.71mi |
| 1610 Pleasant St Unit 1056041P Cincinnati, OH | 3.0–4.0 | 2.0–3.0 | 2960 | $4,370 | $1.48 | 10d | 2 | 0.73mi |
| 2800 Jefferson Ave Cincinnati, OH | 4.0 | 2.0 | 2500 | $625 | $0.25 | 19d | 1 | 0.73mi |
| 328 Mulberry St Cincinnati, OH | 3.0 | 3.5 | 2640 | $5,500 | $2.08 | 23d | 1 | 0.78mi |
| 328 Mulberry St Cincinnati, OH | 3.0 | 3.5 | 2640 | $5,500 | $2.08 | 14d | 1 | 0.78mi |
| 1537 Republic St Unit 1058850P Cincinnati, OH | 4.0 | 3.0 | 2421 | $10,677 | $4.41 | 21d | 1 | 0.80mi |
| 21 E 15th St Unit 1512946P Cincinnati, OH | 3.0 | 2.0 | 2852 | $12,830 | $4.50 | 23d | 1 | 0.87mi |
| 623 Riddle Rd Cincinnati, OH | 3.0 | 2.0 | 2028 | $1,800 | $0.89 | 23d | 1 | 0.90mi |
| 1424 Pleasant St Unit 1056038P Cincinnati, OH | 4.0 | 3.0 | 2960 | $7,167 | $2.42 | 14d | 1 | 0.90mi |
| 2813 Gerard St Unit 1540075P Cincinnati, OH | 4.0 | 3.0 | 2152 | $6,281 | $2.92 | 20d | 1 | 0.95mi |
| 2105 Burnet Ave Unit 1056017P Cincinnati, OH | 4.0 | 2.0 | 2960 | $7,384 | $2.49 | 1d | 1 | 0.97mi |
| 1354 Broadway Unit 1056136P Cincinnati, OH | 4.0 | 3.0 | 2529 | $7,307 | $2.89 | 3d | 1 | 1.01mi |
| 120 E 13th St Unit 1056091P Cincinnati, OH | 4.0 | 2.0 | 3229 | $10,667 | $3.30 | 21d | 1 | 1.04mi |
| 1304 Broadway Unit 1056130P Cincinnati, OH | 1.0–5.0 | 1.0–4.0 | 2072 | $5,808 | $2.80 | 10d | 2 | 1.11mi |
| 242 Stetson St Unit NA Cincinnati, OH | 3.0 | 2.5 | 2300 | $3,500 | $1.52 | 21d | 1 | 1.14mi |
| 595 Martin Luther King Dr W Cincinnati, OH | 3.0 | 2.0 | 2048 | $1,650 | $0.81 | 10d | 1 | 1.16mi |
| 516 E 12th St Unit 1314562P Cincinnati, OH | 4.0 | 2.0 | 2023 | $10,170 | $5.03 | 23d | 1 | 1.21mi |
| 2517 May St Cincinnati, OH | 3.0 | 3.5 | 2014 | $3,420 | $1.70 | 21d | 1 | 1.33mi |
| 2601 May St Cincinnati, OH | 2.0–3.0 | 2.5–3.5 | 1737 | $3,325 | $1.91 | 1d | 12 | 1.35mi |
| 19 Garfield Pl Cincinnati, OH | 1.0–2.0 | 1.0–2.0 | 1680 | $2,260 | $1.34 | 1d | 11 | 1.40mi |
| 1287 Ida St Cincinnati, OH | 3.0 | 2.5 | 2494 | $4,700 | $1.88 | 17d | 1 | 1.41mi |
| 3404 Whitfield Ave Cincinnati, OH | 2.0 | 1.0 | 1291 | $1,595 | $1.23 | 4d | 55 | 1.42mi |
| 1241 Bates Ave Cincinnati, OH | 3.0 | 2.5 | 2100 | $1,875 | $0.89 | 23d | 1 | 1.49mi |
Listing history 12 events
-
2026-06-18days on market $549,000 Active 17 DOM
-
2026-06-17days on market $549,000 Active 16 DOM
-
2026-06-16days on market $549,000 Active 15 DOM
-
2026-06-15days on market $549,000 Active 14 DOM
-
2026-06-13days on market $549,000 Active 12 DOM
-
2026-06-13days on market $549,000 Active 11 DOM
-
2026-06-09days on market $549,000 Active 8 DOM
-
2026-06-08days on market $549,000 Active 7 DOM
-
2026-06-07days on market $549,000 Active 6 DOM
-
2026-06-03days on market $549,000 Active 2 DOM
-
2026-06-02remarks 563-char remark
-
2026-06-02$549,000 Active 1 DOM
ⓘ Source: listings_history table (triggers on properties + properties_extension) + one-shot
backfill from property_details.listing_events for pre-trigger history.
Tax reassessment forecast OH · Partial reset (capped growth)
- Current annual tax
- $4,856 · $405/mo
- Projected year-2 tax
- $6,710 · $559/mo
- Expected delta
- +$1,854/yr (+$155/mo · 38.2%)
ⓘ Screening estimate from a state-policy table — verify with the county assessor before closing.
Climate risk First Street
- Flood 6/10 Major FEMA zone X (unshaded) · 70% chance over 30 yrs
- Wildfire 1/10 Low
- Heat 4/10 Moderate 7 d/yr ≥103°F today · 19 d/yr by 30 yrs out
- Wind 2/10 Low 100% chance of damaging wind over 30 yrs
- Air quality 3/10 Moderate 2 unhealthy d/yr today · 3 by 30 yrs out
Nearby sold comps map
Loading sold comps map…
Walkable amenities ~0.75 mi
Loading nearby amenities…
Taxation est. · year 1
- Rental income
- $65,784
- − Mortgage interest
- −$30,753
- − Property taxes
- −$4,856
- − Insurance
- −$2,745
- − Repairs & maintenance
- −$5,263
- − Management
- −$5,263
- − Depreciation
- −$15,971
- Taxable income
- $934
- Est. tax owed @ 24.0%
- −$224
- After-tax cash flow
- $9,596/yr
For passive investors: Depreciation is non-cash, so a rental often shows a tax loss while cash-flowing — sheltering income. Rental losses are passive: they offset passive income freely, and up to $25,000/yr can offset ordinary (W-2) income if you actively participate and your MAGI is under $100k (phasing out to $0 by $150k); unused losses carry forward. On sale, claimed depreciation is recaptured at up to 25%, and gains may owe capital-gains tax (a 1031 exchange can defer both). Figures are a year-1 estimate at your 24.0% rate — not tax advice; consult a CPA.
Schools (NCES district)
- District
- Cincinnati Public Schools
- NCES district ID
- 3904375
- Math proficiency
- 25% ▼ -19.00%
- Reading proficiency
- 36% ▼ -14.00%
- Median HH income
- $35,743
- Composite
- 25.21/100
- National rank
- #7508
- State rank
- #581 of 656 in OH
Livability — Cincinnati
- Score
- 80/100
- State rank
- #130
- US rank
- #1856
Category grades
Schools grade is shown separately in the Schools card above.
Census & demographics
- Census place
- Cincinnati, OH
- County
- Hamilton County · 701,295 people
- City population
- 505,555
- Metro
- Cincinnati, OH-KY-IN
- Population (ZIP)
- 20,012
- Household income
- $35,657
- Rent vs Own
- Severe rent burden
- 2461.0
Population outlook (Hamilton County) Hauer SSP2
- Today (2025)
- 826,054 people
- By 2030
- 830,947 · +0.6%
- By 2040
- 832,319 · +0.8%
- By 2050
- 822,428 · -0.4%
- By 2075
- 788,688 · -4.5%
- By 2100
- 710,674 · -14.0%
Race, ethnicity, and origin ACS 2023
- Neighborhood character
- Predominantly White (67%)
- Race & ethnicity
- White 67% Black 16% Asian 7% Two or more races 6% Hispanic / Latino 4%
- Common ancestry
- Romanian 3% Italian 2% Slovak 1%
- Foreign-born
- 10% · China, Canada
- Languages at home
- 88% English-only · Chinese 3% Spanish 2% Other Indo-European 2%
Political lean MEDSL · Hamilton
- 2024 margin
- D (+14.9) · D 57.0% · R 42.1%
- 2008→2024 swing
- +7.9pp toward D · 2008: 7.0pp · 2024: 14.9pp
- All cycles
- 2024: D+14.9 2020: D+15.9 2016: D+9.5 2012: D+4.9 2008: D+7.0
Not yet ingested
- Civics
- —
Market trends
- HPI YoY
- ▼ -134.46%
- Current HPI
- 340.1262
- Rent YoY
- ▲ 2.07%
- Metro
- Cincinnati, OH-KY-IN
- State GDP YoY
- ▲ 1.98%
- F500 in state
- 48
Industry mix (Fortune 500 HQ in OH)
| Industry | F500 HQs | Revenue |
|---|---|---|
| Insurance | 3 | $145B |
|
||
| Industrial Machinery | 3 | $49B |
|
||
| Financial Services | 3 | $24B |
|
||
| Consumer Goods | 2 | $93B |
|
||
| Aerospace / Defense | 2 | $47B |
|
||
| Utilities | 2 | $33B |
|
||
Price history
1 event — show timeline
- 2026-06-01 Listed $549,000 Cincy MLS
Property tax history
+6.9%/yrLatest (2025): $4,856 · +0.1% YoY. Source: county tax records.
Cash-flow waterfall
monthlySold comps — $/sqft
last 12 mo · ≤1 miLoading sold comps…