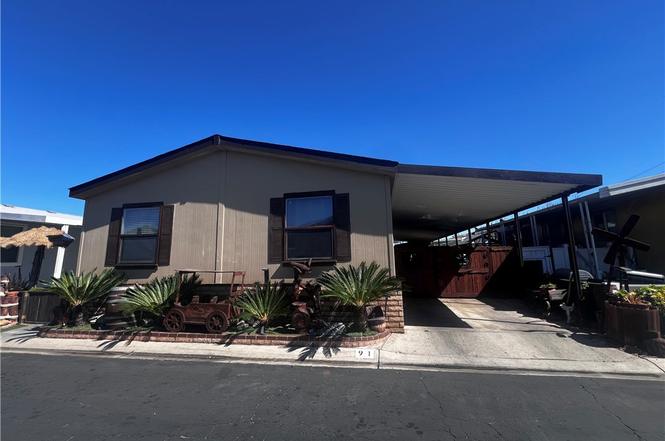
1616 S Euclid #91 · Anaheim, CA
Flood risk 1/10 · Minimal
- FEMA flood zone
- X (shaded)
- Chance of flooding over 30 yrs
- 0.0%
- Est. flood insurance / yr
- $507 – $1,088
Fire risk 1/10 · Minimal
- Est. fire insurance / yr
- $659 – $1,223
Heat risk 6/10 · Moderate
- Hot days now (above 90°F)
- 7 days/yr
- Hot days in 30 yrs
- 23 days/yr
Wind risk 1/10 · Minimal
- Chance of severe wind over 30 yrs
- —
Air-quality risk 6/10 · Moderate
- Unhealthy air days now
- 12 days/yr
- Unhealthy air days in 30 yrs
- 13 days/yr
Risk factors via First Street. Map © Google.
Why this score? — see what drove the B- grade
The composite is a weighted blend of 9 inputs, each scored 0–100. Each bar is that input's sub-score; the figure is the points it added to the 100-point composite (weight × sub-score).
- Cash flow +30.0/30.0
- 1% rule +10.0/10.0
- DSCR +10.0/10.0
- ARV discount +7.8/15.0
- Livability +3.5/5.0
- Rent growth +3.4/5.0
- Condition / age +2.5/5.0
- Schools +2.3/10.0
- Appreciation +0.0/10.0
$270,000
🖨 Deal sheet 📄 Offer letter ✓ Due diligence
Key facts
- 18.69 acre lot
- Built 2007
- Listed 121 days
Property features AI
Finance
- Other: Total of 1 unit on the parcel; Lot characterized as 0–1 unit per acre (Assessor's data)
- Financial info: Land lease: $2,400
- HOA & community: Part of an association; Association provides other amenities; Community has street lighting
Exterior
- Utilities: Public sewer; District/public water
- Home design: Manufactured house; Single-story; Entry on level 1; No common walls
- Construction: Year built reported by builder; Foundation certification: No
- Exterior features: No pool
Interior
- Kitchen: Kitchen with laundry area
- Bedrooms: One main-level bedroom
- Bathrooms: Two full bathrooms; One main-level bathroom
- Heating & cooling: Central cooling
- Interior features: All bedrooms located on the ground floor; Front entry; Single-level living (one story)
- Laundry & utility: Laundry located in the kitchen; Has laundry
Neighborhood map
What this means for you Summary
Snapshot
- This is a 5-bed/2.0-bath manufactured listed at $270k.
Deal economics
- At list price, monthly cash flow is $2k ($30k/yr) — positive.
- The deal already cash-flows at list — no discount required.
- Meets the 1% rule at list price ($6k rent vs $270k).
- Recommended offer: $238k (12.0% below list) — sets the bar for market timing.
- Cap rate 17.3% vs local median 2.2% in Anaheim — top-decile yield for the area; either an underpriced asset or a hidden risk that comps aren't pricing in. Stress-test before assuming the spread holds.
Location & tenants
- Location reads 70/100 on livability (#240 in CA) — a middle-class / working-renter tenant base. Strengths: amenities A+, commute A+, employment A+; Watch: health & safety C-, crime F, cost of living F.
- Anaheim Elementary (urban): math 25% / reading 25% proficiency, ranked #386 of 517 in CA (top 75%) — low school quality limits family demand, transient renter base, plan for 1-2y turnover; 73% free/reduced lunch — lower-income household profile, screen leases tightly.
- Market conditions: Rents rising (+3.8%/yr); 26 active listings in the ZIP; 2 comparable units currently listed for rent nearby; solid renter incomes; 6,974 units permitted in Orange County in 2024 (3,839 in 5+ unit buildings).
- At $5,501/mo this rent would consume 78% of the median local household income ($84k/yr) (locally 2492% of renters already pay >50% of income on rent) — very limited rent-growth headroom before tenants either downsize or default.
Forward outlook
- Local home prices are declining (-3.0%/yr); year-one equity from $2k of loan paydown is wiped out by about $8k of value loss. Plan a longer hold.
- Orange County population projected at +14% by 2050 — modest demand growth; plan on rents tracking national, not racing it.
- At projected returns (-3.0% appreciation + 3.8% rent growth), your $76k cash investment doubles in ~3 years — after that, you're playing with house money.
Negotiation context
- It's been on market 122 days — a 12% lower offer ($238k) is reasonable based on typical stale-listing flexibility.
Risks & watch-outs
- Climate carrying-cost: extreme-heat days projected 7→23/yr by 2055 (HVAC capex compounding) — expect insurance premiums to compound above CPI over the hold.
Questions for the listing agent
- It's been on market 122 days. Have you received any prior offers? Is the seller open to a 12% concession, seller financing, or rate buy-down credit?
- Why hasn't it sold? Are there any deal-killer items the seller is aware of (foundation, flood, title, zoning, code violations)?
- Is there a deadline driving the sale (1031 exchange, divorce, estate, relocation)? That informs how much negotiation room exists.
- Crime grade is F in this area — have there been break-ins, vandalism, or insurance claims at this property in the last 3 years? What carrier currently insures it and at what premium?
- What's the average days-on-market for RENTAL listings here right now (not sales)? A rising rental-DOM trend means longer vacancies and softer asking-rent achievability than the comps imply.
- What's the recent tenant-quality profile in this submarket — average credit score on applications, eviction rate, late-payment / NSF rate, and stable-employment percentage? A property-management company in the area should have these aggregated.
- How much new for-sale + rental construction is in the pipeline within 1–3 miles? Heavy new supply typically softens prices + rents 12–24 months out; constrained supply supports both.
Investment metrics
- 1% rule
- 2.04% ✓
- Cap rate
- 17.31%
- Cash-on-cash
- 39.36%
- DSCR
- 2.75
- GRM
- 4.1
CMA / ARV
- ARV (on-the-fly)
- $271,600
- Comps found
- 3
Show comp detail 3 sales within ~0.75 mi
| Address | Dist | Beds/Ba | Sqft | Sold | Price | $/sf | Match |
|---|---|---|---|---|---|---|---|
| 1616 S Euclid St #23 | 0.00mi | 5/3.0 | 1,368 (-2%) | 4mo | $265,000 | $194 | 89 |
| 11301 Euclid St #115 | 0.68mi | 4/2.0 (-1) | 1,500 (+7%) | 1mo | $295,000 | $197 | 51 |
| 11301 Euclid St #72 | 0.68mi | 4/2.0 (-1) | 1,512 (+8%) | 21mo | $279,000 | $185 | 32 |
Match score weights: distance 35% · size 25% · config 20% · recency 20%. Top-matched comps best support the ARV.
Projected returns pro-forma
-3.0% appreciation · 3.75% rent growth · sell at horizon
- IRR
- 36.5%
- Equity multiple
- 2.57×
- Total profit
- $118,445
- Equity at exit
- $40,258
- IRR
- 43.5%
- Equity multiple
- 5.29×
- Total profit
- $324,263
- Equity at exit
- $23,345
Cash invested: $75,600 (down + closing). Projections, not guarantees.
Landlord ↔ Tenant lean methodology
- Overall (STATE)
- 18 Strongly Tenant-Friendly
- State California
- 18 Strongly Tenant-Friendly · D+13
- County
- — inherits STATE
- City
- — inherits STATE
ZIP-level market 92802
- Rents YoY
- 3.8%
- Active inventory
- 26
- Price-to-rent
- 4.1×
Monthly cashflow live
- Estimated rent
- $5,501 medium interval (Pro) →
- Mortgage (P&I)
- −$1,416
- Tax est. 1.5%
- −$338 /mo · $4,050/yr
- Insurance
- −$112
- HOA
- −$0
- Vacancy / Maint / Mgmt
- −$1,155
- Net cashflow
- $2,480
Break-even live
UW: 25.0% down · 7.5% · 30yr · 1.5% tax · 5.0% vac · 8.0% maint · 8.0% mgmt
Financing live
Cash to close
- Down payment
- $67,500
- Closing costs
- $8,100
- Reserves months
- —
- Total cash needed
- —
Loan-product check · same deal, 3 products live
Conventional
25% down · 7.5% · 30yr
- Down + closing
- —
- Monthly P&I
- —
- Monthly cashflow
- —
- DSCR
- —
- Eligible?
- —
Personal DTI + credit; lowest rate.
DSCR
20% down · 8.5% · 30yr
- Down + closing
- —
- Monthly P&I
- —
- Monthly cashflow
- —
- DSCR
- —
- Eligible?
- —
No personal income docs; deal must DSCR.
Hard money
10% down · 12.0% · 12mo
- Down + closing
- —
- Monthly P&I
- —
- Monthly cashflow
- —
- DSCR
- —
- Eligible?
- —
Short-term bridge; refi at stabilization.
Rent comps 2 comps
| Address | Beds | Baths | Sqft | Rent | $/sqft | DOM | Units | Dist |
|---|---|---|---|---|---|---|---|---|
| 1301 Laster Ave Unit ADU Anaheim, CA | 4.0 | 2.5 | 1200 | $3,600 | $3.00 | 3d | 1 | 0.50mi |
| 1516 W Brande Ave Anaheim, CA | 5.0 | 2.0 | 1824 | $13,000 | $7.13 | 1d | 1 | 1.09mi |
Listing history 17 events
-
2026-06-18days on market $270,000 Active 122 DOM
-
2026-06-17days on market $270,000 Active 121 DOM
-
2026-06-16days on market $270,000 Active 120 DOM
-
2026-06-15days on market $270,000 Active 119 DOM
-
2026-06-13days on market $270,000 Active 117 DOM
-
2026-06-13days on market $270,000 Active 116 DOM
-
2026-06-09days on market $270,000 Active 113 DOM
-
2026-06-08days on market $270,000 Active 112 DOM
-
2026-06-07days on market $270,000 Active 111 DOM
-
2026-06-04days on market $270,000 Active 108 DOM
-
2026-06-03days on market $270,000 Active 107 DOM
-
2026-06-02days on market $270,000 Active 106 DOM
-
2026-06-01days on market $270,000 Active 105 DOM
-
2026-05-31days on market $270,000 Active 104 DOM
-
2026-05-09price $270,000
-
2026-03-02price $299,900
-
2026-02-16$350,000 Active
ⓘ Source: listings_history table (triggers on properties + properties_extension) + one-shot
backfill from property_details.listing_events for pre-trigger history.
Climate risk First Street
- Flood 1/10 Low FEMA zone X (shaded) · 0% chance over 30 yrs
- Wildfire 1/10 Low
- Heat 6/10 Major 7 d/yr ≥90°F today · 23 d/yr by 30 yrs out
- Wind 1/10 Low
- Air quality 6/10 Major 12 unhealthy d/yr today · 13 by 30 yrs out
Nearby sold comps map
Loading sold comps map…
Walkable amenities ~0.75 mi
Loading nearby amenities…
Taxation est. · year 1
- Rental income
- $66,009
- − Mortgage interest
- −$15,124
- − Property taxes
- −$4,050
- − Insurance
- −$1,350
- − Repairs & maintenance
- −$5,281
- − Management
- −$5,281
- − Depreciation
- −$7,855
- Taxable income
- $27,069
- Est. tax owed @ 24.0%
- −$6,496
- After-tax cash flow
- $23,260/yr
For passive investors: Depreciation is non-cash, so a rental often shows a tax loss while cash-flowing — sheltering income. Rental losses are passive: they offset passive income freely, and up to $25,000/yr can offset ordinary (W-2) income if you actively participate and your MAGI is under $100k (phasing out to $0 by $150k); unused losses carry forward. On sale, claimed depreciation is recaptured at up to 25%, and gains may owe capital-gains tax (a 1031 exchange can defer both). Figures are a year-1 estimate at your 24.0% rate — not tax advice; consult a CPA.
Schools (NCES district)
- District
- Anaheim Elementary
- NCES district ID
- 0602610
- Math proficiency
- 25% ▼ -3.00%
- Reading proficiency
- 25% ▼ -9.00%
- Median HH income
- $55,235
- Composite
- 22.56/100
- National rank
- #8078
- State rank
- #386 of 517 in CA
Livability — Anaheim
- Score
- 70/100
- State rank
- #240
- US rank
- #7861
Category grades
Schools grade is shown separately in the Schools card above.
Census & demographics
- Census place
- Anaheim, CA
- County
- Orange County · 3,096,323 people
- City population
- 361,715
- Metro
- Los Angeles-Long Beach-Anaheim, CA
- Population (ZIP)
- 43,132
- Household income
- $84,419
- Rent vs Own
- Severe rent burden
- 2492.0
Population outlook (Orange County) Hauer SSP2
- Today (2025)
- 3,477,456 people
- By 2030
- 3,613,117 · +3.9%
- By 2040
- 3,835,945 · +10.3%
- By 2050
- 3,968,736 · +14.1%
- By 2075
- 4,097,053 · +17.8%
- By 2100
- 3,903,633 · +12.3%
Race, ethnicity, and origin ACS 2023
- Neighborhood character
- Predominantly Hispanic (69%)
- Race & ethnicity
- Hispanic / Latino 69% Two or more races 25% Asian 15% White 13% Black 2%
- Hispanic origin (detail)
- Mexican 64%
- Common ancestry
- Romanian 1%
- Foreign-born
- 37% · Canada, Vietnam, South Korea
- Languages at home
- 31% English-only · Spanish 54% Vietnamese 8% Other Indo-European 2%
Political lean MEDSL · Orange
- 2024 margin
- Toss-up / Even · D 49.7% · R 47.1% · Other 3.2%
- 2008→2024 swing
- +5.2pp toward D · 2008: -2.6pp · 2024: 2.6pp
- All cycles
- 2024: D+2.6 2020: D+9.0 2016: D+7.7 2012: R+8.3 2008: R+2.6
Not yet ingested
- Civics
- —
Market trends
- HPI YoY
- ▼ -497.90%
- Current HPI
- 456.7685
- Rent YoY
- ▲ 3.75%
- Metro
- Los Angeles-Long Beach-Anaheim, CA
- State GDP YoY
- ▲ 3.21%
- F500 in state
- 116
Industry mix (Fortune 500 HQ in CA)
| Industry | F500 HQs | Revenue |
|---|---|---|
| Technology | 27 | $1,492B |
|
||
| Financial Services | 3 | $174B |
|
||
| Retail | 3 | $44B |
|
||
| Insurance | 3 | $26B |
|
||
| Media / Entertainment | 2 | $115B |
|
||
| Pharmaceuticals / Biotech | 2 | $62B |
|
||
Price history
-22.9% since first listed3 events — show timeline
- 2026-05-09 Price Changed $270,000 CRMLS
- 2026-03-02 Price Changed $299,900 CRMLS
- 2026-02-16 Listed $350,000 CRMLS
Property tax history
-4.8%/yrLatest (2025): $496 · +3.4% YoY. Source: county tax records.
Cash-flow waterfall
monthlySold comps — $/sqft
last 12 mo · ≤1 miLoading sold comps…