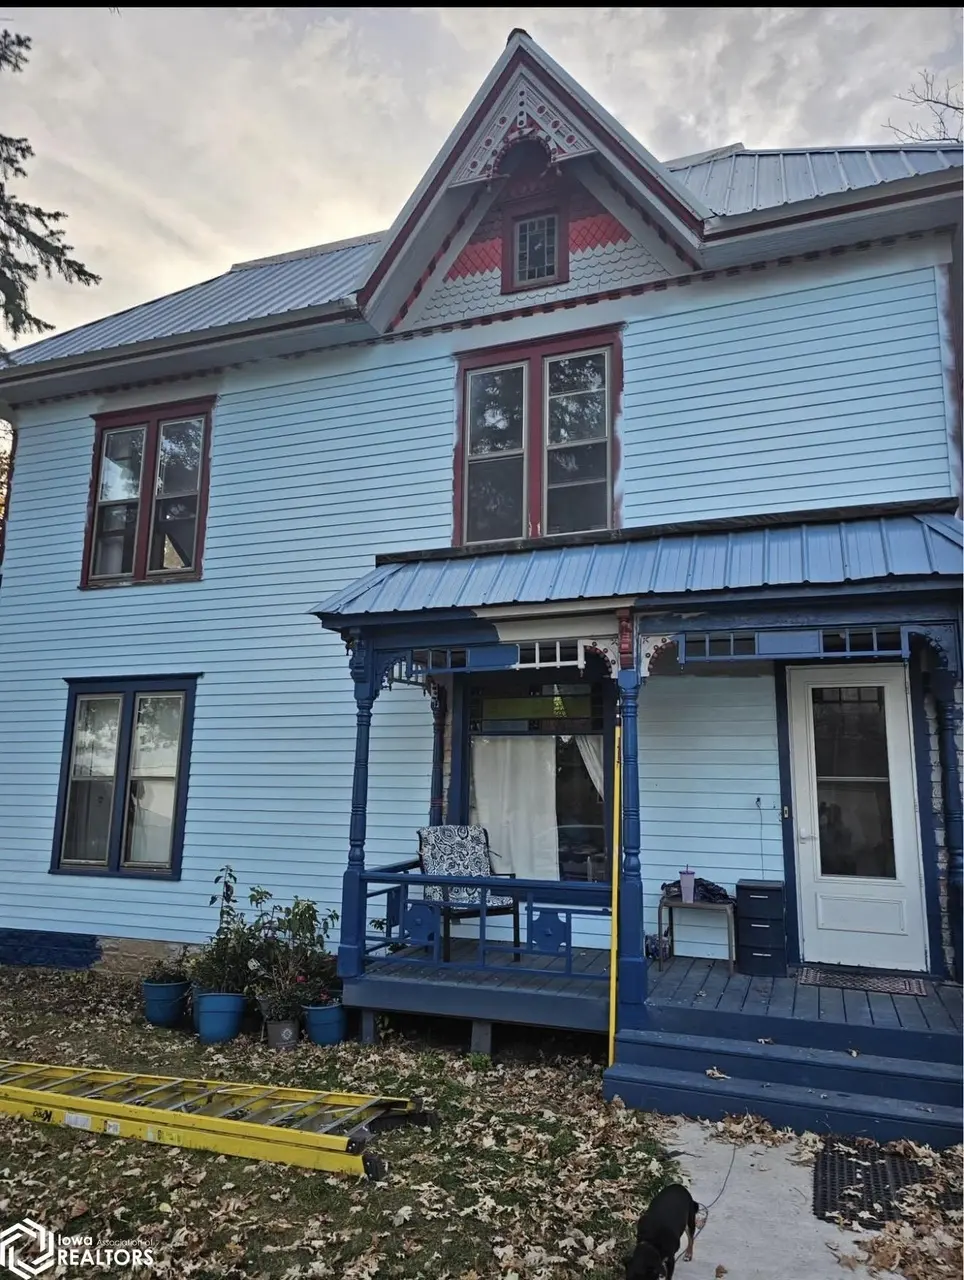
100 N 5th St St · Northwood, IA
Flood risk 1/10 · Minimal
- FEMA flood zone
- X (unshaded)
- Chance of flooding over 30 yrs
- 0.0%
- Est. flood insurance / yr
- $473 – $860
Fire risk 2/10 · Minimal
- Est. fire insurance / yr
- $902 – $1,676
Heat risk 2/10 · Minimal
- Hot days now (above 99°F)
- 7 days/yr
- Hot days in 30 yrs
- 15 days/yr
Wind risk 2/10 · Minimal
- Chance of severe wind over 30 yrs
- —
Air-quality risk 1/10 · Minimal
- Unhealthy air days now
- 0 days/yr
- Unhealthy air days in 30 yrs
- 0 days/yr
Risk factors via First Street. Map © Google.
Why this score? — see what drove the B+ grade
The composite is a weighted blend of 9 inputs, each scored 0–100. Each bar is that input's sub-score; the figure is the points it added to the 100-point composite (weight × sub-score).
- Cash flow +29.6/30.0
- ARV discount +15.0/15.0
- DSCR +10.0/10.0
- 1% rule +7.8/10.0
- Schools +5.8/10.0
- Livability +4.0/5.0
- Rent growth +2.5/5.0
- Condition / age +2.5/5.0
- Appreciation +0.7/10.0
$99,000
🖨 Deal sheet (PDF) 📄 Offer letter ✓ Due diligence
Listing remarks MLS
This large home, sits on corner lot close to main street. Updates include newer furnace and roof. This home has the possibly of being converted into multi family home.
Key facts
- 0.25 acre lot
- Built 1890
- Listed 7 days
Property features AI
Exterior
- Parking: Carport
- Utilities: Public water; Public sewer
- Home design: Two levels; Single-family residence
- Construction: Wood siding
- Exterior features: Lot approximately 0.25 acre (83 x 125)
Interior
- Bathrooms: One full bathroom; One three-quarter bathroom
- Heating & cooling: Central air conditioning; Forced air heating
- Interior features: Basement present
Neighborhood map
What this means for you Summary
Snapshot
- This is a 3-bed/2.0-bath single-family listed at $99k.
Deal economics
- At list price, monthly cash flow is $358 ($4k/yr) — positive.
- The deal already cash-flows at list — no discount required.
- Meets the 1% rule at list price ($1k rent vs $99k).
Location & tenants
- Location reads 79/100 on livability (#99 in IA, #2,022 nationally) — a middle-class / working-renter tenant base. Strengths: crime A+, cost of living A+, housing A+; Watch: amenities F, commute F.
- Northwood-Kensett Community School District (rural): math 63% / reading 74% proficiency, ranked #167 of 289 in IA (top 58%) — acceptable for families but not a draw, mixed tenant base, ~2y average lease.
- Market conditions: 19 active listings in the ZIP.
Forward outlook
- Local home prices are declining (-3.0%/yr); year-one equity from $684 of loan paydown is wiped out by about $3k of value loss. Plan a longer hold.
- At projected returns (-3.0% appreciation + 3.0% rent growth), your $28k cash investment doubles in ~8 years — after that, you're playing with house money.
Negotiation context
- Only 7 days on market — expect competitive offers; lowballing is unlikely to land.
- 2 sale attempts since 3y ago with the ask held roughly flat each time — persistent listings suggest the price (not the market) is what's stuck; bring a comps-based counter.
Risks & watch-outs
- Watch-outs: built in 1890 — expect roof / HVAC / electrical / plumbing capex.
Questions for the listing agent
- Built in 1890 — when were the roof, HVAC, electrical panel, plumbing, and water heater last replaced?
- Is there a deadline driving the sale (1031 exchange, divorce, estate, relocation)? That informs how much negotiation room exists.
- Schools are B-rated — typically a magnet for longer-tenancy family renters. What's the average tenant stay here, and is there a school-zone premium baked into asking?
- What's the average days-on-market for RENTAL listings here right now (not sales)? A rising rental-DOM trend means longer vacancies and softer asking-rent achievability than the comps imply.
- What's the recent tenant-quality profile in this submarket — average credit score on applications, eviction rate, late-payment / NSF rate, and stable-employment percentage? A property-management company in the area should have these aggregated.
- How much new for-sale + rental construction is in the pipeline within 1–3 miles? Heavy new supply typically softens prices + rents 12–24 months out; constrained supply supports both.
Investment metrics
- 1% rule
- 1.28% ✓
- Cap rate
- 10.64%
- Cash-on-cash
- 15.51%
- DSCR
- 1.69
- GRM
- 6.5
CMA / ARV
- ARV (median comp)
- $157,180
- List price
- $99,000
- Delta
- -37.02%
- Verdict
- UNDERPRICED
- Comps
- 20 within 1.0 mi
Show comp detail 12 sales within ~0.75 mi
| Address | Dist | Beds/Ba | Sqft | Sold | Price | $/sf | Match |
|---|---|---|---|---|---|---|---|
| 100 N 5th St St | 0.00mi | 4/2.0 (+1) | 1,960 (0%) | 1mo | $88,000 | $45 | 94 |
| 204 N 11th St St | 0.39mi | 3/1.8 | 1,896 (-3%) | 6mo | $150,000 | $79 | 71 |
| 810 6th Ave Ave N | 0.45mi | 3/2.0 | 2,114 (+8%) | 2mo | $152,000 | $72 | 64 |
| 204 N 9th ST St | 0.27mi | 3/1.0 | 1,772 (-10%) | 8mo | $124,000 | $70 | 61 |
| 1310 2nd Ave Ave S | 0.61mi | 3/1.5 | 1,985 (+1%) | 10mo | $200,000 | $101 | 59 |
| 605 S 10th ST St | 0.55mi | 2/1.5 (-1) | 1,868 (-5%) | 3mo | $246,000 | $132 | 57 |
| 204 10th St St N | 0.33mi | 3/2.2 | 2,096 (+7%) | 19mo | $139,500 | $67 | 56 |
| 801 10th St St S | 0.62mi | 3/2.5 | 2,160 (+10%) | 3mo | $180,000 | $83 | 49 |
| 403 N 11th ST St | 0.47mi | 3/2.0 | 1,696 (-14%) | 8mo | $92,000 | $54 | 49 |
| 103 3rd St St N | 0.10mi | 4/1.8 (+1) | 2,230 (+14%) | 22mo | $260,000 | $117 | 49 |
| 402 N 11th St St | 0.45mi | 4/3.0 (+1) | 1,836 (-6%) | 15mo | $148,000 | $81 | 47 |
| 801 N 11th St St | 0.67mi | 3/1.5 | 2,100 (+7%) | 11mo | $163,000 | $78 | 46 |
Match score weights: distance 35% · size 25% · config 20% · recency 20%. Top-matched comps best support the ARV.
Projected returns pro-forma
-3.0% appreciation · 3.0% rent growth · sell at horizon
- IRR
- 6.3%
- Equity multiple
- 1.24×
- Total profit
- $6,778
- Equity at exit
- $14,761
- IRR
- 15.6%
- Equity multiple
- 2.27×
- Total profit
- $35,273
- Equity at exit
- $8,560
Cash invested: $27,720 (down + closing). Projections, not guarantees.
Landlord ↔ Tenant lean methodology
- Overall (STATE)
- 83 Strongly Landlord-Friendly
- State Iowa
- 83 Strongly Landlord-Friendly · R+6
- County
- — inherits STATE
- City
- — inherits STATE
ZIP-level market 50459
- Home prices YoY
- -3.8%
- Active inventory
- 19
- Price-to-rent
- 6.5×
Monthly cashflow live
- Estimated rent
- $1,270 medium interval (Pro) →
- Mortgage (P&I)
- −$519
- Tax from tax record
- −$85 /mo · $1,016/yr
- Insurance
- −$41
- HOA
- −$0
- Vacancy / Maint / Mgmt
- −$267
- Net cashflow
- $358
Break-even live
Sensitivity live
| Price | -10% $414 | -5% $386 | +0% $358 | +5% $330 | +10% $302 |
|---|---|---|---|---|---|
| Rent | -10% $258 | -5% $308 | +0% $358 | +5% $409 | +10% $459 |
| Rate | -1.0pp $408 | -0.5pp $384 | base $358 | +0.5pp $333 | +1.0pp $307 |
UW: 25.0% down · 7.5% · 30yr · 1.5% tax · 5.0% vac · 8.0% maint · 8.0% mgmt
Financing live
Cash to close
- Down payment
- $24,750
- Closing costs
- $2,970
- Reserves months
- —
- Total cash needed
- —
Loan-product check · same deal, 3 products live
Conventional
25% down · 7.5% · 30yr
- Down + closing
- —
- Monthly P&I
- —
- Monthly cashflow
- —
- DSCR
- —
- Eligible?
- —
Personal DTI + credit; lowest rate.
DSCR
20% down · 8.5% · 30yr
- Down + closing
- —
- Monthly P&I
- —
- Monthly cashflow
- —
- DSCR
- —
- Eligible?
- —
No personal income docs; deal must DSCR.
Hard money
10% down · 12.0% · 12mo
- Down + closing
- —
- Monthly P&I
- —
- Monthly cashflow
- —
- DSCR
- —
- Eligible?
- —
Short-term bridge; refi at stabilization.
Listing history 5 events
-
2026-05-06status Pending 1320-char remark
-
2026-04-29$99,000 Active 1320-char remark
-
2023-03-06soldstatus $63,000 Closed 167-char remark
Show marketing remark (167 chars)
This large home, sits on corner lot close to main street. Updates include newer furnace and roof. This home has the possibly of being converted into multi family home.
-
2023-02-07status Pending 167-char remark
Show marketing remark (167 chars)
This large home, sits on corner lot close to main street. Updates include newer furnace and roof. This home has the possibly of being converted into multi family home.
-
2023-02-06$63,000 Active 167-char remark
Show marketing remark (167 chars)
This large home, sits on corner lot close to main street. Updates include newer furnace and roof. This home has the possibly of being converted into multi family home.
ⓘ Source: listings_history table (triggers on properties + properties_extension) + one-shot
backfill from property_details.listing_events for pre-trigger history.
Tax reassessment forecast IA · Partial reset (capped growth)
- Current annual tax
- $1,016 · $85/mo
- Projected year-2 tax
- $1,285 · $107/mo
- Expected delta
- +$269/yr (+$22/mo · 26.5%)
ⓘ Screening estimate from a state-policy table — verify with the county assessor before closing.
Climate risk First Street
- Flood 1/10 Low FEMA zone X (unshaded) · 0% chance over 30 yrs
- Wildfire 2/10 Low
- Heat 2/10 Low 7 d/yr ≥99°F today · 15 d/yr by 30 yrs out
- Wind 2/10 Low
- Air quality 1/10 Low 0 unhealthy d/yr today · 0 by 30 yrs out
Nearby sold comps map
Loading sold comps map…
Walkable amenities ~0.75 mi
Loading nearby amenities…
Taxation est. · year 1
- Rental income
- $15,242
- − Mortgage interest
- −$5,546
- − Property taxes
- −$1,016
- − Insurance
- −$495
- − Repairs & maintenance
- −$1,219
- − Management
- −$1,219
- − Depreciation
- −$2,880
- Taxable income
- $2,867
- Est. tax owed @ 24.0%
- −$688
- After-tax cash flow
- $3,612/yr
For passive investors: Depreciation is non-cash, so a rental often shows a tax loss while cash-flowing — sheltering income. Rental losses are passive: they offset passive income freely, and up to $25,000/yr can offset ordinary (W-2) income if you actively participate and your MAGI is under $100k (phasing out to $0 by $150k); unused losses carry forward. On sale, claimed depreciation is recaptured at up to 25%, and gains may owe capital-gains tax (a 1031 exchange can defer both). Figures are a year-1 estimate at your 24.0% rate — not tax advice; consult a CPA.
Schools (NCES district)
- District
- Northwood-Kensett Community School District
- NCES district ID
- 1921210
- Math proficiency
- 63% ▼ -1.00%
- Reading proficiency
- 74% ▲ 3.00%
- Median HH income
- $46,859
- Composite
- 57.78/100
- National rank
- #1051
- State rank
- #167 of 289 in IA
Livability — Northwood
- Score
- 79/100
- State rank
- #99
- US rank
- #2022
Category grades
Schools grade is shown separately in the Schools card above.
Census & demographics
- Census place
- Northwood, IA
- Population (ZIP)
- 3,027
Population outlook (Worth County) Hauer SSP2
- Today (2025)
- 7,751 people
- By 2030
- 7,775 · +0.3%
- By 2040
- 7,722 · -0.4%
- By 2050
- 7,645 · -1.4%
- By 2075
- 7,785 · +0.4%
- By 2100
- 7,554 · -2.5%
Race, ethnicity, and origin ACS 2023
- Neighborhood character
- Predominantly White (94%)
- Race & ethnicity
- White 94% Hispanic / Latino 3% Two or more races 2% Asian 1%
- Common ancestry
- Portuguese 32% Iranian 2% Slovak 1%
- Foreign-born
- 1%
- Languages at home
- 96% English-only · German/W. Germanic 3% Other Asian/Pacific 1%
Political lean MEDSL · Worth
- 2024 margin
- Strong R (+28.2) · D 35.2% · R 63.5% · Other 1.3%
- 2008→2024 swing
- -50.6pp toward R · 2008: 22.4pp · 2024: -28.2pp
- All cycles
- 2024: R+28.2 2020: R+25.9 2016: R+21.8 2012: D+14.5 2008: D+22.4
Not yet ingested
- Civics
- —
Market trends
- HPI YoY
- ▼ -8.62%
- Current HPI
- 216.7341
- Rent YoY
- —
- Metro
- —
- State GDP YoY
- ▲ 2.48%
- F500 in state
- 4
Industry mix (Fortune 500 HQ in IA)
| Industry | F500 HQs | Revenue |
|---|---|---|
| Financial Services | 1 | $16B |
|
||
| Retail / Convenience | 1 | $15B |
|
||
Price history
+39.7% since first listed7 events — show timeline
- 2026-06-03 Sold (Public Records) $88,000 Public Records
- 2026-05-22 Sold (MLS) $88,000 IAR
- 2026-05-06 Pending — IAR
- 2026-04-29 Listed $99,000 IAR
- 2023-03-06 Sold (MLS) $63,000 IAR
- 2023-02-07 Pending — IAR
- 2023-02-06 Listed $63,000 IAR
Property tax history
+1.5%/yrLatest (2025): $1,016 · +2.8% YoY. Source: county tax records.
Cash-flow waterfall
monthlySold comps — $/sqft
last 12 mo · ≤1 miLoading sold comps…