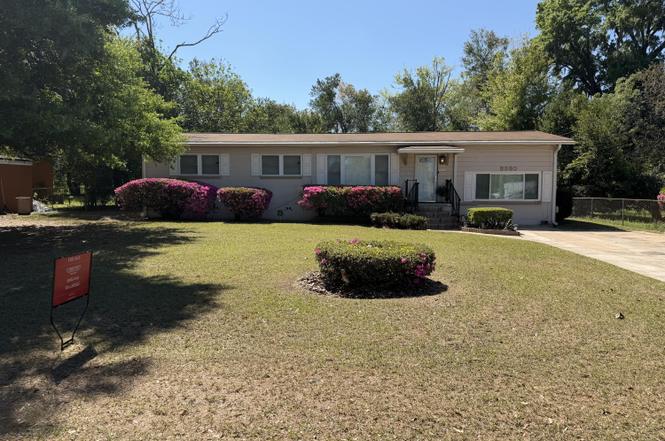
3330 Lansdell Dr · Jacksonville, FL
Flood risk 1/10 · Minimal
- FEMA flood zone
- X (unshaded)
- Chance of flooding over 30 yrs
- 0.0%
- Est. flood insurance / yr
- $507 – $1,088
Fire risk 4/10 · Minor
- Est. fire insurance / yr
- $947 – $1,759
Heat risk 9/10 · Severe
- Hot days now (above 107°F)
- 7 days/yr
- Hot days in 30 yrs
- 21 days/yr
Wind risk 9/10 · Severe
- Chance of severe wind over 30 yrs
- 99.0%
Air-quality risk 4/10 · Minor
- Unhealthy air days now
- 6 days/yr
- Unhealthy air days in 30 yrs
- 6 days/yr
Risk factors via First Street. Map © Google.
Why this score? — see what drove the C grade
The composite is a weighted blend of 9 inputs, each scored 0–100. Each bar is that input's sub-score; the figure is the points it added to the 100-point composite (weight × sub-score).
- Cash flow +19.4/30.0
- ARV discount +15.0/15.0
- DSCR +6.1/10.0
- Livability +4.2/5.0
- 1% rule +4.1/10.0
- Schools +3.9/10.0
- Condition / age +2.5/5.0
- Rent growth +2.2/5.0
- Appreciation +0.0/10.0
$170,000
🖨 Deal sheet 📄 Offer letter ✓ Due diligence
Listing remarks
UPDATED and MOVE-IN READY WITH STRONG INVESTMENT POTENTIAL! Features include refinished wood floors, fresh interior paint, renovated bath, and an updated kitchen with quartz countertops and stainless steel appliances. Major systems updated: roof (2019), HVAC (2017), windows/doors (2022), water heater (2025), electrical (2004). Spacious screened patio and fenced yard--great for tenants or owner-occupants. Convenient location near Downtown Jacksonville and Jacksonville International Airport. Ideal for first-time buyers or investors seeking low-maintenance property. * * BUYER'S FINANCING FELL THROUGH
Key facts
- Eat-in area
- Quartz countertops
- Formal dining room
Tags
Property features AI
Exterior
- Parking: Off-street parking
- Utilities: Septic tank; Cable available; Electricity available
- Home design: Single-family residence; One story
- Construction: Concrete construction; Shingle roof
- Exterior features: Patio; Screened porch; Back yard fencing; Shed(s)
Interior
- Kitchen: Electric range; Microwave; Refrigerator
- Bedrooms: 3 bedrooms (all on the first level)
- Flooring: Wood flooring
- Bathrooms: 1 full bathroom
- Heating & cooling: Central heating; Central air conditioning
- Interior features: Breakfast bar; Ceiling fan(s); Eat-in kitchen; Entrance foyer; Primary bathroom with shower (no tub)
- Laundry & utility: Washer hookup; Electric dryer hookup
Neighborhood map
What this means for you Summary
Snapshot
- This is a 3-bed/1.0-bath single-family listed at $170k.
Deal economics
- At list price, monthly cash flow is $190 ($2k/yr) — positive.
- The deal already cash-flows at list — no discount required.
- To meet the 1% rule (rent ≥ 1% of price), the offer needs to be $155k (8.6% below list).
- Recommended offer: $150k (12.0% below list) — sets the bar for market timing.
- Cap rate 7.6% vs local median 4.0% in Jacksonville — top-decile yield for the area; either an underpriced asset or a hidden risk that comps aren't pricing in. Stress-test before assuming the spread holds.
Location & tenants
- Location reads 83/100 on livability (#50 in FL, #911 nationally) — a professional / high-income tenant draw. Strengths: amenities A+, commute A+, housing A+.
- Duval (urban): math 46% / reading 45% proficiency, ranked #48 of 73 in FL (top 66%) — families likely to look elsewhere, expect single-tenant / working-renter base with shorter leases.
- Market conditions: Rents soft (-1.4%/yr); 291 active listings in the ZIP; 40 comparable units currently listed for rent nearby; rentals at typical pace (median 24d on market — plan ~3-4 weeks tenant-placement turnaround); lower-income renter base — watch delinquency; 6,503 units permitted in Duval County in 2024 (1,131 in 5+ unit buildings).
- At $1,553/mo this rent would consume 45% of the median local household income ($41k/yr) (locally 1765% of renters already pay >50% of income on rent) — very limited rent-growth headroom before tenants either downsize or default.
Forward outlook
- Local home prices are declining (-3.0%/yr); year-one equity from $1k of loan paydown is wiped out by about $5k of value loss. Plan a longer hold.
- Duval County population projected at +19% by 2050 — long-run rental-demand tailwind backs the buy-and-hold thesis.
Negotiation context
- It's been on market 137 days — a 12% lower offer ($150k) is reasonable based on typical stale-listing flexibility.
- Current owner paid $21k; list at $170k implies a 692% gain — meaningful room to come down on a strong offer.
Risks & watch-outs
- Watch-outs: built in 1958 — expect roof / HVAC / electrical / plumbing capex.
- Climate carrying-cost: severe wind risk, 99% chance of damaging wind over 30y; extreme-heat days projected 7→21/yr by 2055 (HVAC capex compounding) — expect insurance premiums to compound above CPI over the hold.
Questions for the listing agent
- It's been on market 137 days. Have you received any prior offers? Is the seller open to a 12% concession, seller financing, or rate buy-down credit?
- Built in 1958 — when were the roof, HVAC, electrical panel, plumbing, and water heater last replaced?
- Why hasn't it sold? Are there any deal-killer items the seller is aware of (foundation, flood, title, zoning, code violations)?
- Is there a deadline driving the sale (1031 exchange, divorce, estate, relocation)? That informs how much negotiation room exists.
- Schools are B-rated — typically a magnet for longer-tenancy family renters. What's the average tenant stay here, and is there a school-zone premium baked into asking?
- What's the average days-on-market for RENTAL listings here right now (not sales)? A rising rental-DOM trend means longer vacancies and softer asking-rent achievability than the comps imply.
- What's the recent tenant-quality profile in this submarket — average credit score on applications, eviction rate, late-payment / NSF rate, and stable-employment percentage? A property-management company in the area should have these aggregated.
- How much new for-sale + rental construction is in the pipeline within 1–3 miles? Heavy new supply typically softens prices + rents 12–24 months out; constrained supply supports both.
Investment metrics
- 1% rule
- 0.91% ✗
- Cap rate
- 7.63%
- Cash-on-cash
- 4.78%
- DSCR
- 1.21
- GRM
- 9.1
CMA / ARV
- ARV (on-the-fly)
- $206,016
- Comps found
- 12
Show comp detail 12 sales within ~0.75 mi
| Address | Dist | Beds/Ba | Sqft | Sold | Price | $/sf | Match |
|---|---|---|---|---|---|---|---|
| 3430 Hickorynut St | 0.25mi | 4/2.0 (+1) | 1,368 (-2%) | 1mo | $224,900 | $164 | 75 |
| 3157 Altamont Ave E | 0.18mi | 3/2.0 | 1,460 (+5%) | 7mo | $140,000 | $96 | 74 |
| 3506 Hickorynut St | 0.27mi | 3/2.0 | 1,488 (+7%) | 8mo | $169,000 | $114 | 66 |
| 3906 Beverly Ave | 0.47mi | 4/2.0 (+1) | 1,444 (+4%) | 2mo | $92,000 | $64 | 61 |
| 9040 10th Ave | 0.62mi | 4/2.0 (+1) | 1,400 (+1%) | 7mo | $170,649 | $122 | 56 |
| 3965 Beverly Ave | 0.52mi | 3/2.0 | 1,512 (+9%) | 3mo | $177,500 | $117 | 55 |
| 9487 Thorn Glen Rd | 0.39mi | 4/2.0 (+1) | 1,543 (+11%) | 3mo | $260,000 | $169 | 52 |
| 9236 7th Ave | 0.58mi | 3/2.0 | 1,495 (+7%) | 7mo | $208,000 | $139 | 51 |
| 3046 Trout River Blvd | 0.62mi | 3/2.0 | 1,270 (-9%) | 9mo | $230,000 | $181 | 45 |
| 3040 Trout River Blvd | 0.63mi | 3/2.0 | 1,270 (-9%) | 9mo | $230,000 | $181 | 44 |
| 9124 5th Ave | 0.73mi | 3/1.0 | 1,220 (-12%) | 2mo | $180,000 | $148 | 44 |
| 2362 Jayson Ave | 0.56mi | 3/2.0 | 1,205 (-13%) | 8mo | $229,900 | $191 | 41 |
Match score weights: distance 35% · size 25% · config 20% · recency 20%. Top-matched comps best support the ARV.
Projected returns pro-forma
-3.0% appreciation · 0.0% rent growth · sell at horizon
- IRR
- -12.0%
- Equity multiple
- 0.58×
- Total profit
- $-20,076
- Equity at exit
- $25,348
- IRR
- -7.5%
- Equity multiple
- 0.58×
- Total profit
- $-19,760
- Equity at exit
- $14,698
Cash invested: $47,600 (down + closing). Projections, not guarantees.
Landlord ↔ Tenant lean methodology
- Overall (STATE)
- 87 Strongly Landlord-Friendly
- State Florida
- 87 Strongly Landlord-Friendly · R+3
- County
- — inherits STATE
- City
- — inherits STATE
ZIP-level market 32208
- Home prices YoY
- -33.6%
- Rents YoY
- -1.4%
- Active inventory
- 291
- Price-to-rent
- 9.1×
Monthly cashflow live
- Estimated rent
- $1,553 high interval (Pro) →
- Mortgage (P&I)
- −$891
- Tax from tax record
- −$75 /mo · $898/yr
- Insurance
- −$71
- HOA
- −$0
- Vacancy / Maint / Mgmt
- −$326
- Net cashflow
- $190
Break-even live
UW: 25.0% down · 7.5% · 30yr · 1.5% tax · 5.0% vac · 8.0% maint · 8.0% mgmt
Financing live
Cash to close
- Down payment
- $42,500
- Closing costs
- $5,100
- Reserves months
- —
- Total cash needed
- —
Loan-product check · same deal, 3 products live
Conventional
25% down · 7.5% · 30yr
- Down + closing
- —
- Monthly P&I
- —
- Monthly cashflow
- —
- DSCR
- —
- Eligible?
- —
Personal DTI + credit; lowest rate.
DSCR
20% down · 8.5% · 30yr
- Down + closing
- —
- Monthly P&I
- —
- Monthly cashflow
- —
- DSCR
- —
- Eligible?
- —
No personal income docs; deal must DSCR.
Hard money
10% down · 12.0% · 12mo
- Down + closing
- —
- Monthly P&I
- —
- Monthly cashflow
- —
- DSCR
- —
- Eligible?
- —
Short-term bridge; refi at stabilization.
Rent comps 40 comps
| Address | Beds | Baths | Sqft | Rent | $/sqft | DOM | Units | Dist |
|---|---|---|---|---|---|---|---|---|
| 3344 Soutel Dr Jacksonville, FL | 3.0 | 1.0 | 1142 | $1,325 | $1.16 | 24d | 1 | 0.18mi |
| 3250 Soutel Dr Jacksonville, FL | 3.0 | 2.0 | 1352 | $1,525 | $1.13 | 24d | 1 | 0.23mi |
| 3015 Lansdell Dr Jacksonville, FL | 3.0 | 1.0 | 1150 | $1,350 | $1.17 | 24d | 1 | 0.32mi |
| 9517 Fraser Fir Ct Jacksonville, FL | 4.0 | 2.0 | 1526 | $1,745 | $1.14 | 8d | 1 | 0.39mi |
| 9346 10th Ave Jacksonville, FL | 3.0 | 1.0 | 985 | $1,825 | $1.85 | 24d | 1 | 0.42mi |
| 2389 Hilly Rd Jacksonville, FL | 3.0 | 1.0 | 908 | $1,650 | $1.82 | 24d | 1 | 0.44mi |
| 9148 13th Ave Jacksonville, FL | 3.0 | 1.0 | 1126 | $1,136 | $1.01 | 4d | 1 | 0.46mi |
| 3848 Soutel Dr Jacksonville, FL | 3.0 | 2.0 | 1230 | $1,541 | $1.25 | 8d | 1 | 0.49mi |
| 3636 Turton Ave Jacksonville, FL | 4.0 | 2.0 | 1728 | $2,100 | $1.22 | 24d | 1 | 0.51mi |
| 9141 12th Ave Jacksonville, FL | 3.0 | 2.0 | 1209 | $1,598 | $1.32 | 20d | 1 | 0.51mi |
| 9279 6th Ave Jacksonville, FL | 3.0 | 2.0 | 1150 | $1,245 | $1.08 | 4d | 1 | 0.65mi |
| 9032 8th Ave Jacksonville, FL | 3.0 | 2.0 | 1300 | $1,500 | $1.15 | 24d | 1 | 0.72mi |
| 9050 7th Ave Jacksonville, FL | 3.0 | 1.0 | 896 | $1,485 | $1.66 | 24d | 1 | 0.73mi |
| 9658 Gibson Ave Jacksonville, FL | 3.0 | 1.5 | 977 | $1,225 | $1.25 | 24d | 1 | 0.74mi |
| 9037 6th Ave Jacksonville, FL | 3.0 | 2.0 | 1156 | $1,400 | $1.21 | 24d | 1 | 0.79mi |
| 9131 4th Ave Jacksonville, FL | 3.0 | 2.0 | 1209 | $1,496 | $1.24 | 21d | 1 | 0.81mi |
| 9017 6th Ave Jacksonville, FL | 2.0 | 1.0 | 1038 | $1,098 | $1.06 | 24d | 1 | 0.82mi |
| 8516 Bermuda Rd Jacksonville, FL | 3.0 | 2.0 | 1492 | $1,625 | $1.09 | 20d | 1 | 0.91mi |
| 8973 4th Ave Jacksonville, FL | 3.0 | 2.0 | 1230 | $1,438 | $1.17 | 15d | 1 | 0.92mi |
| 4643 Williamsburg Ave Jacksonville, FL | 3.0 | 2.0 | 1209 | $1,496 | $1.24 | 3d | 1 | 1.00mi |
| 9124 Adams Ave Jacksonville, FL | 3.0 | 3.0 | 1207 | $1,800 | $1.49 | 24d | 1 | 1.04mi |
| 8918 1st Ave Jacksonville, FL | 3.0 | 2.0 | 1435 | $1,321 | $0.92 | 16d | 1 | 1.06mi |
| 4662 Roanoke Blvd Jacksonville, FL | 3.0 | 2.0 | 1104 | $1,195 | $1.08 | 14d | 1 | 1.09mi |
| 8509 Addison Rd Jacksonville, FL | 4.0 | 2.0 | 1494 | $1,675 | $1.12 | 24d | 1 | 1.09mi |
| 8721 4th Ave Jacksonville, FL | 3.0 | 1.5 | 1344 | $1,399 | $1.04 | 24d | 1 | 1.10mi |
| 9131 Jefferson Ave Jacksonville, FL | 3.0 | 1.0 | 910 | $1,350 | $1.48 | 4d | 1 | 1.10mi |
| 8534 Addison Rd Jacksonville, FL | 4.0 | 2.0 | 1410 | $1,995 | $1.41 | 24d | 1 | 1.10mi |
| 9348 Culpeper Ave Jacksonville, FL | 3.0 | 1.0 | 882 | $1,195 | $1.35 | 24d | 1 | 1.11mi |
| 1975 Rugby Rd Jacksonville, FL | 2.0 | 1.0 | 992 | $1,100 | $1.11 | 8d | 1 | 1.12mi |
| 8910 Adams Ave Jacksonville, FL | 4.0 | 2.0 | 1250 | $1,225 | $0.98 | 3d | 1 | 1.18mi |
| 4737 Portsmouth Ave Jacksonville, FL | 4.0 | 2.0 | 1396 | $1,148 | $0.82 | 24d | 1 | 1.19mi |
| 8642 2nd Ave Jacksonville, FL | 3.0 | 2.0 | 1074 | $1,245 | $1.16 | 2d | 1 | 1.21mi |
| 8617 3rd Ave Jacksonville, FL | 3.0 | 1.0 | 1048 | $1,200 | $1.15 | 11d | 1 | 1.22mi |
| 3029 Bessent Rd Jacksonville, FL | 3.0 | 2.0 | 1330 | $1,750 | $1.32 | 3d | 1 | 1.26mi |
| 2950 Bessent Rd Jacksonville, FL | 3.0 | 2.0 | 1446 | $1,779 | $1.23 | 21d | 1 | 1.26mi |
| 9561 Norfolk Blvd Jacksonville, FL | 3.0 | 1.5 | 934 | $1,350 | $1.45 | 2d | 1 | 1.27mi |
| 9565 Carbondale Dr W Unit B Jacksonville, FL | 3.0 | 2.0 | 1400 | $2,000 | $1.43 | 24d | 1 | 1.28mi |
| 2978 Centerwood Dr Jacksonville, FL | 3.0 | 2.0 | 1437 | $1,805 | $1.26 | 24d | 1 | 1.29mi |
| 2818 Palmdale St Jacksonville, FL | 4.0 | 2.5 | 1484 | $1,900 | $1.28 | 24d | 1 | 1.30mi |
| 4895 Churchill Dr Jacksonville, FL | 3.0 | 2.0 | 1303 | $1,900 | $1.46 | 24d | 1 | 1.34mi |
Listing history 15 events
-
2026-06-16statusdays on market $170,000 Pending 137 DOM
-
2026-06-15days on market $170,000 Active 136 DOM
-
2026-06-10days on market $170,000 Active 130 DOM
-
2026-06-08days on market $170,000 Active 129 DOM
-
2026-06-07days on market $170,000 Active 128 DOM
-
2026-06-03days on market $170,000 Active 124 DOM
-
2026-06-02days on market $170,000 Active 123 DOM
-
2026-06-01days on market $170,000 Active 122 DOM
-
2026-05-31days on market $170,000 Active 121 DOM
-
2026-05-10historical Active Under Contract
-
2026-05-03price $170,000
-
2026-03-19price $195,000
-
2026-02-10price $207,000
-
2026-01-24$218,000 Active
-
1974-09-20soldstatus $21,466
ⓘ Source: listings_history table (triggers on properties + properties_extension) + one-shot
backfill from property_details.listing_events for pre-trigger history.
Tax reassessment forecast FL · Resets to sale price
- Current annual tax
- $898 · $75/mo
- Projected year-2 tax
- $1,411 · $118/mo
- Expected delta
- +$513/yr (+$43/mo · 57.1%)
ⓘ Screening estimate from a state-policy table — verify with the county assessor before closing.
Climate risk First Street
- Flood 1/10 Low FEMA zone X (unshaded) · 0% chance over 30 yrs
- Wildfire 4/10 Moderate
- Heat 9/10 Extreme 7 d/yr ≥107°F today · 21 d/yr by 30 yrs out
- Wind 9/10 Extreme 99% chance of damaging wind over 30 yrs
- Air quality 4/10 Moderate 6 unhealthy d/yr today · 6 by 30 yrs out
Nearby sold comps map
Loading sold comps map…
Walkable amenities ~0.75 mi
Loading nearby amenities…
Taxation est. · year 1
- Rental income
- $18,636
- − Mortgage interest
- −$9,523
- − Property taxes
- −$898
- − Insurance
- −$850
- − Repairs & maintenance
- −$1,491
- − Management
- −$1,491
- − Depreciation
- −$4,945
- Taxable loss
- −$562
- Est. tax savings @ 24.0%
- +$135
- After-tax cash flow
- $2,411/yr
For passive investors: Depreciation is non-cash, so a rental often shows a tax loss while cash-flowing — sheltering income. Rental losses are passive: they offset passive income freely, and up to $25,000/yr can offset ordinary (W-2) income if you actively participate and your MAGI is under $100k (phasing out to $0 by $150k); unused losses carry forward. On sale, claimed depreciation is recaptured at up to 25%, and gains may owe capital-gains tax (a 1031 exchange can defer both). Figures are a year-1 estimate at your 24.0% rate — not tax advice; consult a CPA.
Schools (NCES district)
- District
- Duval
- NCES district ID
- 1200480
- Math proficiency
- 46% ▼ -11.00%
- Reading proficiency
- 45% ▼ -4.00%
- Median HH income
- $48,987
- Composite
- 38.97/100
- National rank
- #4076
- State rank
- #48 of 73 in FL
Livability — Jacksonville
- Score
- 83/100
- State rank
- #50
- US rank
- #911
Category grades
Schools grade is shown separately in the Schools card above.
Census & demographics
- Census place
- Jacksonville, FL
- County
- Duval County · 1,015,274 people
- City population
- 979,034
- Metro
- Jacksonville, FL
- Population (ZIP)
- 32,699
- Household income
- $41,324
- Rent vs Own
- Severe rent burden
- 1765.0
Population outlook (Duval County) Hauer SSP2
- Today (2025)
- 1,013,010 people
- By 2030
- 1,059,228 · +4.6%
- By 2040
- 1,141,439 · +12.7%
- By 2050
- 1,205,258 · +19.0%
- By 2075
- 1,324,282 · +30.7%
- By 2100
- 1,319,620 · +30.3%
Race, ethnicity, and origin ACS 2023
- Neighborhood character
- Predominantly Black (77%)
- Race & ethnicity
- Black 77% White 16% Two or more races 4% Hispanic / Latino 3%
- Common ancestry
- Italian 1%
- Foreign-born
- 2% · Canada
- Languages at home
- 97% English-only · Spanish 2%
Political lean MEDSL · Duval
- 2024 margin
- Toss-up / Even · D 48.7% · R 50.1% · Other 1.2%
- 2008→2024 swing
- +0.4pp no change · 2008: -1.9pp · 2024: -1.5pp
- All cycles
- 2024: R+1.5 2020: D+3.8 2016: R+1.5 2012: R+3.6 2008: R+1.9
Not yet ingested
- Civics
- —
Market trends
- HPI YoY
- ▼ -110.56%
- Current HPI
- 217.9706
- Rent YoY
- ▼ -1.36%
- Metro
- Jacksonville, FL
- State GDP YoY
- ▲ 3.28%
- F500 in state
- 36
Industry mix (Fortune 500 HQ in FL)
| Industry | F500 HQs | Revenue |
|---|---|---|
| Industrial Technology | 2 | $29B |
|
||
| Insurance | 2 | $17B |
|
||
| Retail | 1 | $60B |
|
||
| Technology Distribution | 1 | $58B |
|
||
| Homebuilding | 1 | $35B |
|
||
| Technology Manufacturing | 1 | $35B |
|
||
Price history
+692.0% since first listed6 events — show timeline
- 2026-05-10 Contingent — realMLS
- 2026-05-03 Price Changed $170,000 realMLS
- 2026-03-19 Price Changed $195,000 realMLS
- 2026-02-10 Price Changed $207,000 realMLS
- 2026-01-24 Listed $218,000 realMLS
- 1974-09-20 Sold (Public Records) $21,466 Public Records
Property tax history
+2.8%/yrLatest (2025): $898 · +25.1% YoY. Source: county tax records.
Cash-flow waterfall
monthlySold comps — $/sqft
last 12 mo · ≤1 miLoading sold comps…