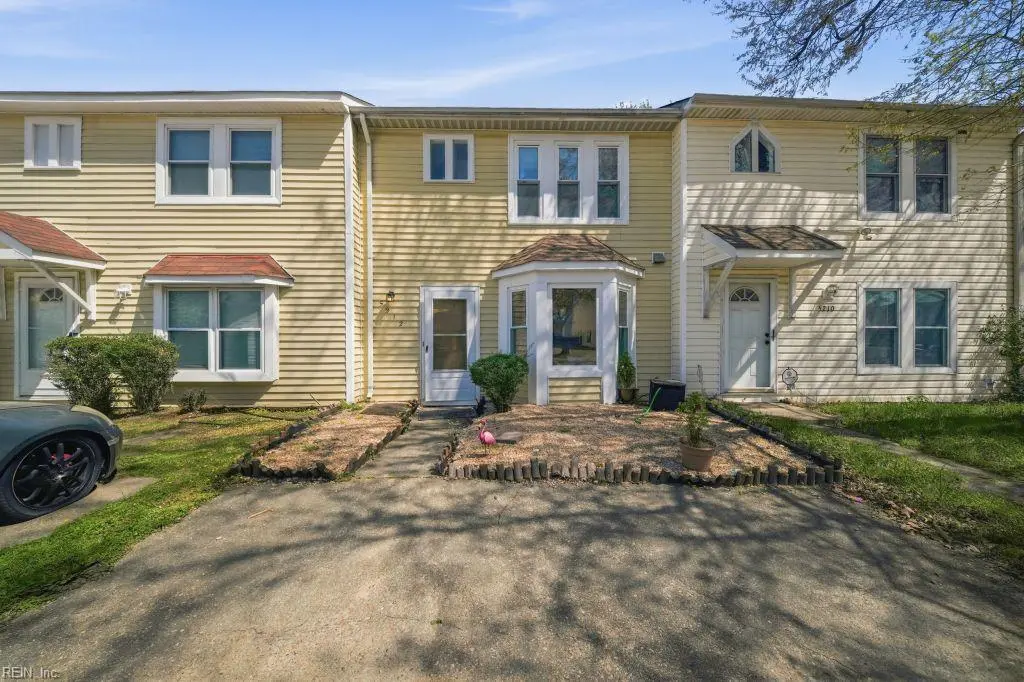
5212 Richard Rd · Virginia Beach, VA
Flood risk 1/10 · Minimal
- FEMA flood zone
- X (unshaded)
- Chance of flooding over 30 yrs
- 0.0%
- Est. flood insurance / yr
- $507 – $1,088
Fire risk 1/10 · Minimal
- Est. fire insurance / yr
- $666 – $1,236
Heat risk 9/10 · Severe
- Hot days now (above 105°F)
- 7 days/yr
- Hot days in 30 yrs
- 16 days/yr
Wind risk 8/10 · Major
- Chance of severe wind over 30 yrs
- 94.0%
Air-quality risk 5/10 · Moderate
- Unhealthy air days now
- 7 days/yr
- Unhealthy air days in 30 yrs
- 7 days/yr
Risk factors via First Street. Map © Google.
Why this score? — see what drove the C grade
The composite is a weighted blend of 9 inputs, each scored 0–100. Each bar is that input's sub-score; the figure is the points it added to the 100-point composite (weight × sub-score).
- Cash flow +18.0/30.0
- ARV discount +14.8/15.0
- Schools +6.4/10.0
- DSCR +5.6/10.0
- 1% rule +4.2/10.0
- Livability +4.2/5.0
- Rent growth +3.9/5.0
- Condition / age +2.5/5.0
- Appreciation +0.0/10.0
$225,000
🖨 Deal sheet 📄 Offer letter ✓ Due diligence
Listing remarks
This Virginia Beach townhome offers 3 bedrooms and 2.5 bathrooms with the opportunity to personalize the space with your own style! The spacious living room flows into the dining room and kitchen where your design vision can come to life. On the main floor, you'll also find a laundry room and half bathroom. Upstairs, the bright and airy primary bedroom includes an ensuite bathroom and a walk-in closet along with your 2 additional bedrooms and additional full bathroom. Don’t miss the opportunity to turn this townhome into your perfect home. Schedule a showing today! Please note, some photos use virtual staging to illustrate the home's potential.
Key facts
- Built 1981
- Listed 5 days
Neighborhood map
What this means for you Summary
Snapshot
- This is a 3-bed/2.5-bath townhouse listed at $225k.
Deal economics
- At list price, monthly cash flow is $193 ($2k/yr) — positive.
- The deal already cash-flows at list — no discount required.
- To meet the 1% rule (rent ≥ 1% of price), the offer needs to be $206k (8.2% below list).
- Recommended offer: $206k (8.2% below list) — sets the bar for 1% rule.
- Cap rate 7.3% vs local median 3.5% in Virginia Beach — top-decile yield for the area; either an underpriced asset or a hidden risk that comps aren't pricing in. Stress-test before assuming the spread holds.
Location & tenants
- Location reads 83/100 on livability (#38 in VA, #880 nationally) — a professional / high-income tenant draw. Strengths: amenities A+, employment A+, housing A+; Watch: cost of living C-, commute F.
- Va Beach City Public School District (urban): math 69% / reading 78% proficiency, ranked #10 of 131 in VA (top 8%) — strong family-tenant draw, lease renewals of 3-5y typical.
- Zoned schools: Newtown Elementary (math 47% / reading 52%, grade D, #742 of 1,108 statewide, top 70%, 443 students, 98% FRL); Bayside High (math 63% / reading 75%, grade B, #170 of 319 statewide, top 55%, 1,983 students, 65% FRL) — zoned schools average 81% FRL vs 28% district-wide (53 pts higher); higher-poverty schools than district average — tighter screening recommended.
- Zoned-school proficiency averages 59% at this address vs 74% district-wide (-14 pts) — the specific schools serving this property underperform the Va Beach City Public School District average; the district grade overstates school quality for this exact location.
- Market conditions: Rents rising fast (+5.6%/yr); 220 active listings in the ZIP; 40 comparable units currently listed for rent nearby; rentals at typical pace (median 17d on market — plan ~3-4 weeks tenant-placement turnaround); 666 units permitted in Virginia Beach city in 2024 (347 in 5+ unit buildings).
- This rent runs 36% of the median local income ($69k/yr) — at the standard rent-burdened threshold; future hikes will face affordability resistance.
Forward outlook
- Local home prices are declining (-3.0%/yr); year-one equity from $2k of loan paydown is wiped out by about $7k of value loss. Plan a longer hold.
- Virginia Beach County population projected at +6% by 2050 — modest demand growth; plan on rents tracking national, not racing it.
Negotiation context
- Only 5 days on market — expect competitive offers; lowballing is unlikely to land.
- Current owner paid $157k; 44% above their basis — modest negotiation headroom, anchor on the comps not their cost.
Risks & watch-outs
- Climate carrying-cost: severe wind risk, 94% chance of damaging wind over 30y; extreme-heat days projected 7→16/yr by 2055 (HVAC capex compounding) — expect insurance premiums to compound above CPI over the hold.
Questions for the listing agent
- Is there a deadline driving the sale (1031 exchange, divorce, estate, relocation)? That informs how much negotiation room exists.
- Schools are A-rated — typically a magnet for longer-tenancy family renters. What's the average tenant stay here, and is there a school-zone premium baked into asking?
- What's the average days-on-market for RENTAL listings here right now (not sales)? A rising rental-DOM trend means longer vacancies and softer asking-rent achievability than the comps imply.
- What's the recent tenant-quality profile in this submarket — average credit score on applications, eviction rate, late-payment / NSF rate, and stable-employment percentage? A property-management company in the area should have these aggregated.
- How much new for-sale + rental construction is in the pipeline within 1–3 miles? Heavy new supply typically softens prices + rents 12–24 months out; constrained supply supports both.
Investment metrics
- 1% rule
- 0.92% ✗
- Cap rate
- 7.32%
- Cash-on-cash
- 3.68%
- DSCR
- 1.16
- GRM
- 9.1
CMA / ARV
- ARV (on-the-fly)
- $268,912
- Comps found
- 12
Show comp detail 12 sales within ~0.75 mi
| Address | Dist | Beds/Ba | Sqft | Sold | Price | $/sf | Match |
|---|---|---|---|---|---|---|---|
| 5212 Richard Rd | 0.00mi | 3/2.5 | 1,372 (0%) | 1mo | $227,000 | $165 | 99 |
| 5207 Richard Rd | 0.03mi | 3/2.5 | 1,470 (+7%) | 8mo | $260,000 | $177 | 80 |
| 434 Peregrine St | 0.16mi | 3/2.5 | 1,470 (+7%) | 8mo | $245,000 | $167 | 74 |
| 5460 Trumpet Vine Ct | 0.57mi | 3/2.5 | 1,466 (+7%) | 3mo | $287,700 | $196 | 59 |
| 497 Adkins Arch | 0.26mi | 2/2.0 (-1) | 1,202 (-12%) | 1mo | $240,000 | $200 | 59 |
| 5400 Trumpet Vine Ct | 0.59mi | 3/2.5 | 1,466 (+7%) | 4mo | $320,000 | $218 | 57 |
| 419 Adkins Arch | 0.24mi | 2/2.0 (-1) | 1,542 (+12%) | 7mo | $253,175 | $164 | 55 |
| 553 Lavender Ln | 0.56mi | 4/3.0 (+1) | 1,456 (+6%) | 2mo | $390,000 | $268 | 54 |
| 5348 Garnett Pointe Ct | 0.36mi | 3/2.5 | 1,563 (+14%) | 8mo | $347,900 | $223 | 54 |
| 652 Pawleys Arch | 0.64mi | 3/2.5 | 1,550 (+13%) | 0mo | $395,000 | $255 | 48 |
| 5487 Davis Way | 0.70mi | 3/1.5 | 1,266 (-8%) | 3mo | $230,000 | $182 | 48 |
| 661 Aubrey Dr | 0.74mi | 3/1.5 | 1,266 (-8%) | 6mo | $226,000 | $179 | 44 |
Match score weights: distance 35% · size 25% · config 20% · recency 20%. Top-matched comps best support the ARV.
Projected returns pro-forma
-3.0% appreciation · 5.61% rent growth · sell at horizon
- IRR
- -7.8%
- Equity multiple
- 0.70×
- Total profit
- $-18,634
- Equity at exit
- $33,548
- IRR
- 4.6%
- Equity multiple
- 1.37×
- Total profit
- $23,539
- Equity at exit
- $19,454
Cash invested: $63,000 (down + closing). Projections, not guarantees.
Landlord ↔ Tenant lean methodology
- Overall (STATE)
- 55 Moderately Landlord-Leaning
- State Virginia
- 55 Moderately Landlord-Leaning · D+2
- County
- — inherits STATE
- City
- — inherits STATE
ZIP-level market 23462
- Rents YoY
- 5.6%
- Active inventory
- 220
- Price-to-rent
- 9.1×
Monthly cashflow live
- Estimated rent
- $2,065 high interval (Pro) →
- Mortgage (P&I)
- −$1,180
- Tax from tax record
- −$164 /mo · $1,974/yr
- Insurance
- −$94
- HOA
- −$0
- Vacancy / Maint / Mgmt
- −$434
- Net cashflow
- $193
Break-even live
UW: 25.0% down · 7.5% · 30yr · 1.5% tax · 5.0% vac · 8.0% maint · 8.0% mgmt
Financing live
Cash to close
- Down payment
- $56,250
- Closing costs
- $6,750
- Reserves months
- —
- Total cash needed
- —
Loan-product check · same deal, 3 products live
Conventional
25% down · 7.5% · 30yr
- Down + closing
- —
- Monthly P&I
- —
- Monthly cashflow
- —
- DSCR
- —
- Eligible?
- —
Personal DTI + credit; lowest rate.
DSCR
20% down · 8.5% · 30yr
- Down + closing
- —
- Monthly P&I
- —
- Monthly cashflow
- —
- DSCR
- —
- Eligible?
- —
No personal income docs; deal must DSCR.
Hard money
10% down · 12.0% · 12mo
- Down + closing
- —
- Monthly P&I
- —
- Monthly cashflow
- —
- DSCR
- —
- Eligible?
- —
Short-term bridge; refi at stabilization.
Rent comps 40 comps
| Address | Beds | Baths | Sqft | Rent | $/sqft | DOM | Units | Dist |
|---|---|---|---|---|---|---|---|---|
| 5206 Richard Rd Virginia Beach, VA | 3.0 | 1.5 | 1240 | $1,795 | $1.45 | 21d | 1 | 0.02mi |
| 5212 Richard Rd Virginia Beach, VA | 3.0 | 2.5 | 1372 | $2,100 | $1.53 | 21d | 1 | 0.02mi |
| 5161 Weaver Dr Virginia Beach, VA | 2.0–3.0 | 1.0 | 971 | $1,675 | $1.73 | 4d | 4 | 0.10mi |
| 326 Harrier St Virginia Beach, VA | 3.0 | 1.5 | 1178 | $1,995 | $1.69 | 16d | 1 | 0.12mi |
| 449 Peregrine St Virginia Beach, VA | 3.0 | 2.0 | 1400 | $1,995 | $1.43 | 16d | 1 | 0.18mi |
| 453 Peregrine St Virginia Beach, VA | 2.0 | 1.0 | 994 | $1,500 | $1.51 | 23d | 1 | 0.19mi |
| 512 Featherstone Ct Unit 573F Virginia Beach, VA | 3.0 | 1.0 | 1047 | $1,675 | $1.60 | 23d | 1 | 0.19mi |
| 512 Featherstone Ct Unit 501-201D Virginia Beach, VA | 2.0 | 1.0 | 897 | $1,549 | $1.73 | 23d | 1 | 0.19mi |
| 451 Adkins Arch Virginia Beach, VA | 2.0 | 2.0 | 1236 | $1,975 | $1.60 | 3d | 1 | 0.25mi |
| 337 Dorset Ave Virginia Beach, VA | 3.0 | 1.0 | 1180 | $1,700 | $1.44 | 7d | 1 | 0.42mi |
| 5509 Bulls Bay Dr Unit 1 Virginia Beach, VA | 3.0 | 2.0 | 1694 | $2,599 | $1.53 | 4d | 1 | 0.50mi |
| 5509 Bulls Bay Dr Virginia Beach, VA | 3.0 | 2.5 | 1694 | $2,599 | $1.53 | 11d | 1 | 0.50mi |
| 5421 Sweetwater Ct Virginia Beach, VA | 3.0 | 2.5 | 1704 | $2,500 | $1.47 | 2d | 1 | 0.64mi |
| 5416 Sweetwater Ct Virginia Beach, VA | 4.0 | 2.5 | 1704 | $2,495 | $1.46 | 23d | 1 | 0.65mi |
| 616 Aubrey Dr Virginia Beach, VA | 3.0 | 1.5 | 1266 | $1,995 | $1.58 | 23d | 1 | 0.70mi |
| 5416 Safe Harbour Way Virginia Beach, VA | 3.0 | 2.5 | 1686 | $2,500 | $1.48 | 1d | 1 | 0.71mi |
| 113 S Parliament Dr Virginia Beach, VA | 3.0 | 2.0 | 1770 | $2,600 | $1.47 | 23d | 1 | 0.80mi |
| 5441 Greenwich Rd Virginia Beach, VA | 1.0–2.0 | 1.0–2.0 | 1075 | $3,149 | $2.93 | 1d | 13 | 0.80mi |
| 5516 Seawall Ct Virginia Beach, VA | 2.0–3.0 | 1.0–3.0 | 1125 | $2,421 | $2.15 | 1d | 18 | 0.83mi |
| 4733 Adler Ave Virginia Beach, VA | 3.0 | 1.0 | 1150 | $1,995 | $1.73 | 21d | 1 | 0.94mi |
| 5619 Summit Arch Virginia Beach, VA | 2.0 | 2.0 | 957 | $1,650 | $1.72 | 3d | 1 | 0.98mi |
| 150 Loflin Way Virginia Beach, VA | 2.0 | 2.0 | 1197 | $1,775 | $1.48 | 23d | 1 | 1.04mi |
| 5517 Lynbrook Lndg Virginia Beach, VA | 3.0 | 2.5 | 1360 | $2,335 | $1.72 | 23d | 1 | 1.07mi |
| 700 Wolftrap Ln Virginia Beach, VA | 2.0 | 3.0 | 1360 | $1,795 | $1.32 | 12d | 1 | 1.09mi |
| 700 Wolftrap Ln Virginia Beach, VA | 2.0 | 2.5 | 1360 | $1,795 | $1.32 | 23d | 1 | 1.09mi |
| 700 Wolftrap Ln Virginia Beach, VA | 2.0 | 2.5 | 1360 | $1,795 | $1.32 | 16d | 1 | 1.09mi |
| 5382 Leicester Ct Virginia Beach, VA | 3.0 | 1.5 | 1320 | $1,900 | $1.44 | 23d | 1 | 1.10mi |
| 724 Hezekiah Little Dr Virginia Beach, VA | 3.0 | 2.5 | 1748 | $2,900 | $1.66 | 1d | 1 | 1.11mi |
| 5363 Leicester Ct Unit 1 Virginia Beach, VA | 3.0 | 1.5 | 1330 | $2,000 | $1.50 | 23d | 1 | 1.12mi |
| 6647 Ethan Allen Ln Norfolk, VA | 2.0 | 1.5 | 1176 | $1,750 | $1.49 | 10d | 1 | 1.21mi |
| 912 Southmoor Dr #204 Virginia Beach, VA | 2.0 | 2.0 | 1367 | $1,810 | $1.32 | 11d | 1 | 1.22mi |
| 6650 Stoney Point South Norfolk, VA | 3.0 | 2.5 | 1562 | $2,100 | $1.34 | 43d | 1 | 1.24mi |
| 6602 Stoney Point North Norfolk, VA | 3.0 | 2.0 | 1562 | $1,795 | $1.15 | 43d | 1 | 1.24mi |
| 920 Southmoor Dr #305 Virginia Beach, VA | 2.0 | 2.0 | 1367 | $1,900 | $1.39 | 17d | 1 | 1.25mi |
| 5414 Catina Arch Virginia Beach, VA | 1.0–4.0 | 1.0–1.5 | 866 | $1,997 | $2.31 | 2d | 10 | 1.26mi |
| 924 Southmoor Dr #204 Virginia Beach, VA | 2.0 | 2.0 | 1367 | $1,950 | $1.43 | 21d | 1 | 1.27mi |
| 4606 Merrimac Ln Virginia Beach, VA | 2.0 | 2.5 | 1240 | $2,150 | $1.73 | 23d | 1 | 1.27mi |
| 4968 Limestone Ave Unit 1 Virginia Beach, VA | 4.0 | 3.5 | 1815 | $3,000 | $1.65 | 23d | 1 | 1.31mi |
| 849 Gas Light Ln Virginia Beach, VA | 2.0 | 2.0 | 1250 | $1,900 | $1.52 | 17d | 1 | 1.31mi |
| 226 Larimar Ave Unit 47C Virginia Beach, VA | 2.0 | 2.5 | 1480 | $2,395 | $1.62 | 7d | 1 | 1.35mi |
Listing history 3 events
-
2026-04-14status Under Contract
-
2026-04-09$225,000 Active
-
2026-03-11soldstatus $156,531
ⓘ Source: listings_history table (triggers on properties + properties_extension) + one-shot
backfill from property_details.listing_events for pre-trigger history.
Tax reassessment forecast VA · Resets to sale price
- Current annual tax
- $1,974 · $164/mo
- Projected year-2 tax
- $1,974 · $164/mo
- Expected delta
- $0/yr ($0/mo · 0.0%)
ⓘ Screening estimate from a state-policy table — verify with the county assessor before closing.
Climate risk First Street
- Flood 1/10 Low FEMA zone X (unshaded) · 0% chance over 30 yrs
- Wildfire 1/10 Low
- Heat 9/10 Extreme 7 d/yr ≥105°F today · 16 d/yr by 30 yrs out
- Wind 8/10 Severe 94% chance of damaging wind over 30 yrs
- Air quality 5/10 Major 7 unhealthy d/yr today · 7 by 30 yrs out
Nearby sold comps map
Loading sold comps map…
Walkable amenities ~0.75 mi
Loading nearby amenities…
Taxation est. · year 1
- Rental income
- $24,780
- − Mortgage interest
- −$12,603
- − Property taxes
- −$1,974
- − Insurance
- −$1,125
- − Repairs & maintenance
- −$1,982
- − Management
- −$1,982
- − Depreciation
- −$6,545
- Taxable loss
- −$1,433
- Est. tax savings @ 24.0%
- +$344
- After-tax cash flow
- $2,662/yr
For passive investors: Depreciation is non-cash, so a rental often shows a tax loss while cash-flowing — sheltering income. Rental losses are passive: they offset passive income freely, and up to $25,000/yr can offset ordinary (W-2) income if you actively participate and your MAGI is under $100k (phasing out to $0 by $150k); unused losses carry forward. On sale, claimed depreciation is recaptured at up to 25%, and gains may owe capital-gains tax (a 1031 exchange can defer both). Figures are a year-1 estimate at your 24.0% rate — not tax advice; consult a CPA.
Schools (NCES district)
- District
- Va Beach City Public School District
- NCES district ID
- 5103840
- Math proficiency
- 69% ▼ -19.00%
- Reading proficiency
- 78% ▼ -7.00%
- Median HH income
- $66,452
- Composite
- 63.81/100
- National rank
- #594
- State rank
- #10 of 131 in VA
Livability — Virginia Beach
- Score
- 83/100
- State rank
- #38
- US rank
- #880
Category grades
Schools grade is shown separately in the Schools card above.
Census & demographics
- Census place
- Virginia Beach, VA
- County
- Virginia Beach City · 448,227 people
- City population
- 448,227
- Metro
- Virginia Beach-Norfolk-Newport News, VA-NC
- Population (ZIP)
- 66,151
- Household income
- $69,040
- Rent vs Own
- Severe rent burden
- 3906.0
Population outlook (Virginia Beach County) Hauer SSP2
- Today (2025)
- 480,401 people
- By 2030
- 491,221 · +2.3%
- By 2040
- 504,882 · +5.1%
- By 2050
- 508,847 · +5.9%
- By 2075
- 504,831 · +5.1%
- By 2100
- 465,867 · -3.0%
Race, ethnicity, and origin ACS 2023
- Neighborhood character
- Diverse neighborhood (Simpson 0.68)
- Race & ethnicity
- White 45% Black 32% Hispanic / Latino 12% Two or more races 10% Asian 5%
- Hispanic origin (detail)
- Mexican 4% Puerto Rican 3%
- Common ancestry
- Romanian 2% Italian 1% Slovak 1%
- Foreign-born
- 9% · Canada, China, Vietnam
- Languages at home
- 87% English-only · Spanish 6% Tagalog/Filipino 2% Other Asian/Pacific 1%
Political lean MEDSL · Virginia Beach
- 2024 margin
- Toss-up / Even · D 50.7% · R 48.0% · Other 1.3%
- 2008→2024 swing
- +3.4pp toward D · 2008: -0.7pp · 2024: 2.6pp
- All cycles
- 2024: D+2.6 2020: D+5.4 2016: R+4.5 2012: R+2.5 2008: R+0.7
Not yet ingested
- Civics
- —
Market trends
- HPI YoY
- ▼ -269.19%
- Current HPI
- 333.1908
- Rent YoY
- ▲ 5.61%
- Metro
- Virginia Beach-Norfolk-Newport News, VA-NC
- State GDP YoY
- ▲ 2.40%
- F500 in state
- 50
Industry mix (Fortune 500 HQ in VA)
| Industry | F500 HQs | Revenue |
|---|---|---|
| Aerospace / Defense | 4 | $236B |
|
||
| Technology / Defense | 3 | $32B |
|
||
| Financial Services | 2 | $176B |
|
||
| Utilities | 2 | $27B |
|
||
| Insurance | 2 | $25B |
|
||
| Technology | 2 | $15B |
|
||
Price history
+43.7% since first listed3 events — show timeline
- 2026-04-14 Pending — REINMLS
- 2026-04-09 Listed $225,000 REINMLS
- 2026-03-11 Sold (Public Records) $156,531 Public Records
Property tax history
+4.5%/yrLatest (2025): $1,974 · +16.5% YoY. Source: county tax records.
Cash-flow waterfall
monthlySold comps — $/sqft
last 12 mo · ≤1 miLoading sold comps…