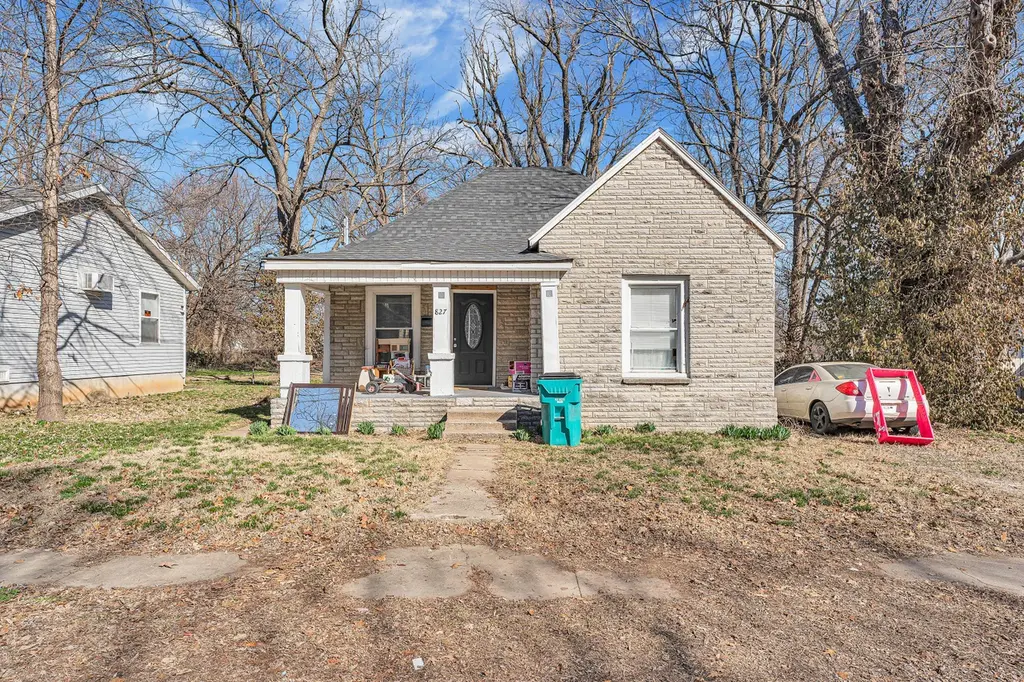
827 E Garfield St · Springfield, MO
Flood risk 1/10 · Minimal
- FEMA flood zone
- X (unshaded)
- Chance of flooding over 30 yrs
- 0.0%
- Est. flood insurance / yr
- $507 – $1,088
Fire risk 1/10 · Minimal
- Est. fire insurance / yr
- $1,054 – $1,958
Heat risk 5/10 · Moderate
- Hot days now (above 105°F)
- 7 days/yr
- Hot days in 30 yrs
- 19 days/yr
Wind risk 2/10 · Minimal
- Chance of severe wind over 30 yrs
- —
Air-quality risk 2/10 · Minimal
- Unhealthy air days now
- 1 days/yr
- Unhealthy air days in 30 yrs
- 2 days/yr
Risk factors via First Street. Map © Google.
Why this score? — see what drove the C- grade
The composite is a weighted blend of 9 inputs, each scored 0–100. Each bar is that input's sub-score; the figure is the points it added to the 100-point composite (weight × sub-score).
- Cash flow +19.5/30.0
- ARV discount +10.8/15.0
- DSCR +6.2/10.0
- 1% rule +4.4/10.0
- Livability +3.8/5.0
- Rent growth +3.6/5.0
- Schools +3.2/10.0
- Condition / age +2.5/5.0
- Appreciation +0.0/10.0
$110,000
🖨 Deal sheet (PDF) 📄 Offer letter ✓ Due diligence
Listing remarks MLS
Secure a high-performance asset or a move-in ready residence with this updated 2-bedroom, 2-bathroom cottage. Built in 1892 but brought into the modern era with a recent remodel, this 1,049 sq. ft. home balances historic character with the contemporary finishes today's occupants demand. Currently tenant-occupied and professionally managed, it offers a stabilized entry into the Springfield market. The interior stands out with hardwood flooring throughout, soaring tall ceilings, and an open-concept living area. The updated kitchen is a major highlight, featuring granite countertops, an electric stove, and a dishwasher--amenities that elevate it above standard 'low-end' rentals. With central heat and air for year-round comfort and a dedicated laundry area, the home is designed for functional ease. The large 0.21-acre lot offers plenty of room for hobbies or extra storage. Whether you're looking for a turn-key rental with premium appeal or an affordable home you can be proud to own, this property is a solid choice.
Key facts
- Hardwood flooring
- Recent remodel
- Tall ceilings
Tags
Neighborhood map
What this means for you Summary
Snapshot
- This is a 2-bed/1.0-bath single-family listed at $110k.
Deal economics
- At list price, monthly cash flow is $125 ($1k/yr) — positive.
- The deal already cash-flows at list — no discount required.
- To meet the 1% rule (rent ≥ 1% of price), the offer needs to be $103k (6.1% below list).
- Recommended offer: $100k (9.0% below list) — sets the bar for market timing.
- Cap rate 7.7% vs local median 4.6% in Springfield — top-decile yield for the area; either an underpriced asset or a hidden risk that comps aren't pricing in. Stress-test before assuming the spread holds.
Location & tenants
- Location reads 75/100 on livability (#57 in MO, #4,121 nationally) — a middle-class / working-renter tenant base. Strengths: commute A+, cost of living A+, housing A+; Watch: crime F, employment F.
- Springfield R-XII (urban): math 32% / reading 46% proficiency, ranked #174 of 324 in MO (top 54%) — families likely to look elsewhere, expect single-tenant / working-renter base with shorter leases.
- Zoned schools: Robberson Elem. (math 27% / reading 32%, grade F, #813 of 1,115 statewide, top 75%, 166 students, 89% FRL); Reed Middle (math 33% / reading 44%, grade F, #202 of 391 statewide, top 54%, 512 students, 70% FRL); Hillcrest High (math 9% / reading 35%, grade F, #462 of 521 statewide, top 90%, 1,017 students, 64% FRL) — zoned schools average 74% FRL vs 46% district-wide (28 pts higher); higher-poverty schools than district average — tighter screening recommended.
- Market conditions: Rents rising fast (+4.2%/yr); 401 active listings in the ZIP; 35 comparable units currently listed for rent nearby; rentals at typical pace (median 25d on market — plan ~3-4 weeks tenant-placement turnaround); 1,302 units permitted in Greene County in 2024 (250 in 5+ unit buildings).
Forward outlook
- Local home prices are declining (-3.0%/yr); year-one equity from $761 of loan paydown is wiped out by about $3k of value loss. Plan a longer hold.
- Greene County population projected at +25% by 2050 — long-run rental-demand tailwind backs the buy-and-hold thesis.
Negotiation context
- It's been on market 100 days — a 9% lower offer ($100k) is reasonable based on typical stale-listing flexibility.
- 6 sale attempts since 6y ago with the ask held roughly flat each time — persistent listings suggest the price (not the market) is what's stuck; bring a comps-based counter.
- Current owner paid $25k; list at $110k implies a 340% gain — meaningful room to come down on a strong offer.
Risks & watch-outs
- Watch-outs: built in 1892 — expect roof / HVAC / electrical / plumbing capex.
- Climate carrying-cost: extreme-heat days projected 7→19/yr by 2055 (HVAC capex compounding) — expect insurance premiums to compound above CPI over the hold.
Questions for the listing agent
- It's been on market 100 days. Have you received any prior offers? Is the seller open to a 9% concession, seller financing, or rate buy-down credit?
- Built in 1892 — when were the roof, HVAC, electrical panel, plumbing, and water heater last replaced?
- Why hasn't it sold? Are there any deal-killer items the seller is aware of (foundation, flood, title, zoning, code violations)?
- Is there a deadline driving the sale (1031 exchange, divorce, estate, relocation)? That informs how much negotiation room exists.
- Crime grade is F in this area — have there been break-ins, vandalism, or insurance claims at this property in the last 3 years? What carrier currently insures it and at what premium?
- What's the average days-on-market for RENTAL listings here right now (not sales)? A rising rental-DOM trend means longer vacancies and softer asking-rent achievability than the comps imply.
- What's the recent tenant-quality profile in this submarket — average credit score on applications, eviction rate, late-payment / NSF rate, and stable-employment percentage? A property-management company in the area should have these aggregated.
- How much new for-sale + rental construction is in the pipeline within 1–3 miles? Heavy new supply typically softens prices + rents 12–24 months out; constrained supply supports both.
Investment metrics
- 1% rule
- 0.94% ✗
- Cap rate
- 7.65%
- Cash-on-cash
- 4.86%
- DSCR
- 1.22
- GRM
- 8.9
CMA / ARV
- ARV (median comp)
- $118,792
- List price
- $110,000
- Delta
- -7.40%
- Verdict
- FAIR
- Comps
- 20 within 1.0 mi
Show comp detail 12 sales within ~0.75 mi
| Address | Dist | Beds/Ba | Sqft | Sold | Price | $/sf | Match |
|---|---|---|---|---|---|---|---|
| 2023 N Taylor Ave | 0.29mi | 2/1.0 | 1,035 (-1%) | 2mo | $80,000 | $77 | 83 |
| 2033 N Taylor Ave | 0.29mi | 3/1.0 (+1) | 1,036 (-1%) | 2mo | $120,000 | $116 | 78 |
| 1112 E Dale St | 0.27mi | 2/1.0 | 988 (-6%) | 1mo | $114,900 | $116 | 77 |
| 2160 N Kellett Ave | 0.20mi | 2/1.0 | 964 (-8%) | 2mo | $104,900 | $109 | 75 |
| 2310 N Pierce Ave | 0.37mi | 2/1.0 | 976 (-7%) | 1mo | $14,900 | $15 | 70 |
| 2036 N Prospect Ave | 0.51mi | 2/1.0 | 976 (-7%) | 1mo | $125,000 | $128 | 64 |
| 2110 N Pickwick Ave | 0.71mi | 2/1.0 | 1,022 (-3%) | 1mo | $132,500 | $130 | 62 |
| 2111 N Rogers Ave | 0.56mi | 2/1.0 | 962 (-8%) | 1mo | $165,000 | $172 | 59 |
| 1433 E Commercial St | 0.73mi | 2/1.0 | 1,008 (-4%) | 1mo | $124,900 | $124 | 58 |
| 2047 N Campbell Ave | 0.66mi | 2/1.0 | 948 (-10%) | 1mo | $129,900 | $137 | 52 |
| 1012 E Talmage St | 0.72mi | 2/1.0 | 960 (-8%) | 2mo | $139,000 | $145 | 50 |
| 1145 E Jean St | 0.69mi | 2/1.0 | 1,174 (+12%) | 3mo | $109,000 | $93 | 46 |
Match score weights: distance 35% · size 25% · config 20% · recency 20%. Top-matched comps best support the ARV.
Projected returns pro-forma
-3.0% appreciation · 4.24% rent growth · sell at horizon
- IRR
- -7.5%
- Equity multiple
- 0.72×
- Total profit
- $-8,609
- Equity at exit
- $16,401
- IRR
- 3.5%
- Equity multiple
- 1.26×
- Total profit
- $8,107
- Equity at exit
- $9,511
Cash invested: $30,800 (down + closing). Projections, not guarantees.
Landlord ↔ Tenant lean methodology
- Overall (STATE)
- 81 Strongly Landlord-Friendly
- State Missouri
- 81 Strongly Landlord-Friendly · R+10
- County
- — inherits STATE
- City
- — inherits STATE
ZIP-level market 65803
- Home prices YoY
- -29.8%
- Rents YoY
- 4.2%
- Active inventory
- 401
- Price-to-rent
- 8.9×
Monthly cashflow live
- Estimated rent
- $1,033 high interval (Pro) →
- Mortgage (P&I)
- −$577
- Tax from tax record
- −$69 /mo · $828/yr
- Insurance
- −$46
- HOA
- −$0
- Vacancy / Maint / Mgmt
- −$217
- Net cashflow
- $125
Break-even live
Sensitivity live
| Price | -10% $187 | -5% $156 | +0% $125 | +5% $93 | +10% $62 |
|---|---|---|---|---|---|
| Rent | -10% $43 | -5% $84 | +0% $125 | +5% $165 | +10% $206 |
| Rate | -1.0pp $180 | -0.5pp $153 | base $125 | +0.5pp $96 | +1.0pp $67 |
UW: 25.0% down · 7.5% · 30yr · 1.5% tax · 5.0% vac · 8.0% maint · 8.0% mgmt
Financing live
Cash to close
- Down payment
- $27,500
- Closing costs
- $3,300
- Reserves months
- —
- Total cash needed
- —
Loan-product check · same deal, 3 products live
Conventional
25% down · 7.5% · 30yr
- Down + closing
- —
- Monthly P&I
- —
- Monthly cashflow
- —
- DSCR
- —
- Eligible?
- —
Personal DTI + credit; lowest rate.
DSCR
20% down · 8.5% · 30yr
- Down + closing
- —
- Monthly P&I
- —
- Monthly cashflow
- —
- DSCR
- —
- Eligible?
- —
No personal income docs; deal must DSCR.
Hard money
10% down · 12.0% · 12mo
- Down + closing
- —
- Monthly P&I
- —
- Monthly cashflow
- —
- DSCR
- —
- Eligible?
- —
Short-term bridge; refi at stabilization.
Rent comps 35 comps
| Address | Beds | Baths | Sqft | Rent | $/sqft | DOM | Units | Dist |
|---|---|---|---|---|---|---|---|---|
| 805 E Garfield St Springfield, MO | 2.0 | 1.0 | 950 | $950 | $1.00 | 15d | 1 | 0.03mi |
| 2034 N Washington Ave Springfield, MO | 2.0 | 1.0 | 800 | $875 | $1.09 | 45d | 1 | 0.17mi |
| 2234 N Travis Ave Springfield, MO | 1.0 | 1.0 | 890 | $750 | $0.84 | 45d | 1 | 0.35mi |
| 407 E Dale St Apt B Springfield, MO | 2.0 | 1.0 | 720 | $795 | $1.10 | 15d | 1 | 0.38mi |
| 2153 N National Ave Springfield, MO | 3.0 | 1.0 | 1163 | $1,195 | $1.03 | 15d | 1 | 0.42mi |
| 317 E Chase St Springfield, MO | 2.0 | 2.0 | 915 | $1,100 | $1.20 | 45d | 1 | 0.46mi |
| 716 E Locust St Unit A Springfield, MO | 2.0 | 1.0 | 915 | $850 | $0.93 | 25d | 1 | 0.48mi |
| 1636 N National Ave Springfield, MO | 3.0 | 1.5 | 1000 | $995 | $0.99 | 45d | 1 | 0.55mi |
| 1112 E Locust St Springfield, MO | 2.0 | 1.0 | 840 | $945 | $1.12 | 25d | 1 | 0.57mi |
| 1623 N Jefferson Ave Unit B Springfield, MO | 1.0 | 1.0 | 750 | $950 | $1.27 | 45d | 1 | 0.58mi |
| 2054 N Rogers Ave Springfield, MO | 2.0 | 1.0 | 888 | $925 | $1.04 | 15d | 1 | 0.60mi |
| 2337 N Ramsey Ave Springfield, MO | 2.0 | 1.0 | 882 | $875 | $0.99 | 15d | 1 | 0.61mi |
| 203 W Commercial St Unit 2F Springfield, MO | 2.0 | 1.0 | 1000 | $1,150 | $1.15 | 22d | 1 | 0.64mi |
| 2230 N Campbell Ave Springfield, MO | 2.0 | 1.0 | 1084 | $1,095 | $1.01 | 45d | 1 | 0.66mi |
| 1530 N Robberson Ave Springfield, MO | 3.0 | 2.0 | 1122 | $1,425 | $1.27 | 45d | 1 | 0.66mi |
| 2345 N Prospect Ave Springfield, MO | 2.0 | 1.0 | 792 | $850 | $1.07 | 15d | 1 | 0.66mi |
| 2313 N Rogers Ave Unit 1 Springfield, MO | 2.0 | 2.0 | 882 | $950 | $1.08 | 15d | 1 | 0.68mi |
| 1409 N Washington Ave Springfield, MO | 2.0 | 1.0 | 839 | $1,405 | $1.67 | 15d | 2 | 0.71mi |
| 1339 E Division St Springfield, MO | 3.0 | 2.0 | 1186 | $1,350 | $1.14 | 25d | 1 | 0.78mi |
| 1447 E Oakwood Ln Springfield, MO | 2.0 | 2.0 | 982 | $1,395 | $1.42 | 45d | 1 | 0.81mi |
| 1306 N Frisco Ave Apt A Springfield, MO | 2.0 | 1.5–2.0 | 970 | $995 | $1.03 | 15d | 19 | 0.82mi |
| 2221 N Weller Ave Springfield, MO | 3.0 | 2.0 | 1215 | $1,395 | $1.15 | 15d | 1 | 0.82mi |
| 1501 E Blaine St Springfield, MO | 2.0 | 1.0 | 958 | $695 | $0.73 | 25d | 1 | 0.84mi |
| 1529 N Weller Ave Springfield, MO | 2.0 | 1.0 | 870 | $995 | $1.14 | 25d | 1 | 0.90mi |
| 2337 N Delaware Ave Springfield, MO | 2.0 | 1.0 | 876 | $1,195 | $1.36 | 45d | 1 | 0.93mi |
| 603 W Division St Springfield, MO | 2.0 | 1.0 | 816 | $995 | $1.22 | 15d | 1 | 0.97mi |
| 1710 E Commercial St Unit B Springfield, MO | 2.0 | 1.0 | 950 | $775 | $0.82 | 45d | 1 | 1.10mi |
| 2940 N East Ave Springfield, MO | 2.0 | 2.0 | 915 | $700 | $0.77 | 15d | 1 | 1.18mi |
| 2850 N Campbell Ave Apt S Springfield, MO | 1.0 | 1.0 | 727 | $750 | $1.03 | 45d | 1 | 1.20mi |
| 616 W Webster St Springfield, MO | 2.0 | 1.5 | 1178 | $1,050 | $0.89 | 15d | 1 | 1.22mi |
| 2120 N Johnston Ave Springfield, MO | 2.0 | 1.0 | 880 | $925 | $1.05 | 45d | 1 | 1.27mi |
| 1034 E McCanse St Springfield, MO | 3.0 | 1.0 | 910 | $1,150 | $1.26 | 25d | 1 | 1.35mi |
| STE Springfield, MO | 3.0 | 2.0 | 1477 | $1,600 | $1.08 | 15d | 2 | 1.37mi |
| 647 W Central St Springfield, MO | 3.0 | 1.0 | 882 | $1,050 | $1.19 | 25d | 1 | 1.43mi |
| 1127 W Talmage St Springfield, MO | 3.0 | 2.0 | 1160 | $1,650 | $1.42 | 45d | 1 | 1.44mi |
Listing history 30 events
-
2026-06-22days on market $110,000 Active 100 DOM
-
2026-06-18days on market $110,000 Active 97 DOM
-
2026-06-17days on market $110,000 Active 96 DOM
-
2026-06-16days on market $110,000 Active 95 DOM
-
2026-06-15days on market $110,000 Active 94 DOM
-
2026-06-14days on market $110,000 Active 92 DOM
-
2026-06-10days on market $110,000 Active 89 DOM
-
2026-06-09days on market $110,000 Active 88 DOM
-
2026-06-08days on market $110,000 Active 87 DOM
-
2026-06-07days on market $110,000 Active 86 DOM
-
2026-06-03days on market $110,000 Active 82 DOM
-
2026-06-02days on market $110,000 Active 81 DOM
-
2026-06-01days on market $110,000 Active 80 DOM
-
2026-05-31days on market $110,000 Active 79 DOM
-
2026-05-30days on market $110,000 Active 78 DOM
-
2026-03-11$110,000 Active 1026-char remark
Show marketing remark (1026 chars)
Secure a high-performance asset or a move-in ready residence with this updated 2-bedroom, 2-bathroom cottage. Built in 1892 but brought into the modern era with a recent remodel, this 1,049 sq. ft. home balances historic character with the contemporary finishes today's occupants demand. Currently tenant-occupied and professionally managed, it offers a stabilized entry into the Springfield market. The interior stands out with hardwood flooring throughout, soaring tall ceilings, and an open-concept living area. The updated kitchen is a major highlight, featuring granite countertops, an electric stove, and a dishwasher--amenities that elevate it above standard 'low-end' rentals. With central heat and air for year-round comfort and a dedicated laundry area, the home is designed for functional ease. The large 0.21-acre lot offers plenty of room for hobbies or extra storage. Whether you're looking for a turn-key rental with premium appeal or an affordable home you can be proud to own, this property is a solid choice.
-
2025-04-28historical $950
-
2025-04-27$110,000 Active
-
2025-04-08$950
-
2024-03-24historical $895
-
2024-03-13$895
-
2022-02-28price $895
-
2021-07-09soldstatus
-
2021-07-08soldstatus
-
2021-06-18$45,000
-
2020-11-25soldstatus
-
2020-11-20soldstatus
-
2020-10-20$39,900
-
2019-07-15soldstatus
-
2009-10-23soldstatus $25,000
ⓘ Source: listings_history table (triggers on properties + properties_extension) + one-shot
backfill from property_details.listing_events for pre-trigger history.
Tax reassessment forecast MO · Resets to sale price
- Current annual tax
- $828 · $69/mo
- Projected year-2 tax
- $1,067 · $89/mo
- Expected delta
- +$239/yr (+$20/mo · 28.9%)
ⓘ Screening estimate from a state-policy table — verify with the county assessor before closing.
Climate risk First Street
- Flood 1/10 Low FEMA zone X (unshaded) · 0% chance over 30 yrs
- Wildfire 1/10 Low
- Heat 5/10 Major 7 d/yr ≥105°F today · 19 d/yr by 30 yrs out
- Wind 2/10 Low
- Air quality 2/10 Low 1 unhealthy d/yr today · 2 by 30 yrs out
Nearby sold comps map
Loading sold comps map…
Walkable amenities ~0.75 mi
Loading nearby amenities…
Taxation est. · year 1
- Rental income
- $12,399
- − Mortgage interest
- −$6,162
- − Property taxes
- −$828
- − Insurance
- −$550
- − Repairs & maintenance
- −$992
- − Management
- −$992
- − Depreciation
- −$3,200
- Taxable loss
- −$324
- Est. tax savings @ 24.0%
- +$78
- After-tax cash flow
- $1,573/yr
For passive investors: Depreciation is non-cash, so a rental often shows a tax loss while cash-flowing — sheltering income. Rental losses are passive: they offset passive income freely, and up to $25,000/yr can offset ordinary (W-2) income if you actively participate and your MAGI is under $100k (phasing out to $0 by $150k); unused losses carry forward. On sale, claimed depreciation is recaptured at up to 25%, and gains may owe capital-gains tax (a 1031 exchange can defer both). Figures are a year-1 estimate at your 24.0% rate — not tax advice; consult a CPA.
Schools (NCES district)
- District
- Springfield R-XII
- NCES district ID
- 2928860
- Math proficiency
- 32% ▼ -2.00%
- Reading proficiency
- 46% ▼ -3.00%
- Median HH income
- $37,886
- Composite
- 32.45/100
- National rank
- #5717
- State rank
- #174 of 324 in MO
Livability — Springfield
- Score
- 75/100
- State rank
- #57
- US rank
- #4121
Category grades
Schools grade is shown separately in the Schools card above.
Census & demographics
- Census place
- Springfield, MO
- County
- Greene County · 244,327 people
- City population
- 223,044
- Metro
- Springfield, MO
- Population (ZIP)
- 42,882
- Household income
- $50,572
- Rent vs Own
- Severe rent burden
- 1305.0
Population outlook (Greene County) Hauer SSP2
- Today (2025)
- 319,054 people
- By 2030
- 335,135 · +5.0%
- By 2040
- 366,186 · +14.8%
- By 2050
- 397,431 · +24.6%
- By 2075
- 477,035 · +49.5%
- By 2100
- 520,828 · +63.2%
Race, ethnicity, and origin ACS 2023
- Neighborhood character
- Predominantly White (82%)
- Race & ethnicity
- White 82% Two or more races 9% Hispanic / Latino 6% Black 4%
- Hispanic origin (detail)
- Mexican 2% Puerto Rican 2%
- Common ancestry
- Lithuanian 2% Italian 2% Iranian 2%
- Foreign-born
- 3% · Canada
- Languages at home
- 95% English-only · Spanish 3%
Political lean MEDSL · Greene
- 2024 margin
- Strong R (+20.8) · D 38.9% · R 59.7% · Other 1.4%
- 2008→2024 swing
- -5.0pp toward R · 2008: -15.8pp · 2024: -20.8pp
- All cycles
- 2024: R+20.8 2020: R+20.1 2016: R+27.4 2012: R+24.4 2008: R+15.8
Not yet ingested
- Civics
- —
Market trends
- HPI YoY
- ▼ -87.08%
- Current HPI
- 205.0439
- Rent YoY
- ▲ 4.24%
- Metro
- Springfield, MO
- State GDP YoY
- ▲ 1.84%
- F500 in state
- 20
Industry mix (Fortune 500 HQ in MO)
| Industry | F500 HQs | Revenue |
|---|---|---|
| Healthcare | 1 | $163B |
|
||
| Insurance | 1 | $21B |
|
||
| Industrial Technology | 1 | $17B |
|
||
| Retail | 1 | $16B |
|
||
| Industrial Distribution | 1 | $10B |
|
||
| Utilities | 1 | $9B |
|
||
Price history
+340.0% since first listed15 events — show timeline
- 2026-03-11 Listed $110,000 SOMO
- 2025-04-28 Rental Removed $950 APPFOLIO
- 2025-04-27 Listed $110,000 SOMO
- 2025-04-08 Listed for Rent $950 APPFOLIO
- 2024-03-24 Rental Removed $895 APPFOLIO
- 2024-03-13 Listed for Rent $895 APPFOLIO
- 2022-02-28 Price Changed $895 APPFOLIO
- 2021-07-09 Sold (Public Records) — Public Records
- 2021-07-08 Sold (MLS) — SOMO
- 2021-06-18 Listed $45,000 SOMO
- 2020-11-25 Sold (Public Records) — Public Records
- 2020-11-20 Sold (MLS) — SOMO
- 2020-10-20 Listed $39,900 SOMO
- 2019-07-15 Sold (Public Records) — Public Records
- 2009-10-23 Sold (Public Records) $25,000 Public Records
Property tax history
+8.1%/yrLatest (2025): $828 · +16.8% YoY. Source: county tax records.
Cash-flow waterfall
monthlySold comps — $/sqft
last 12 mo · ≤1 miLoading sold comps…