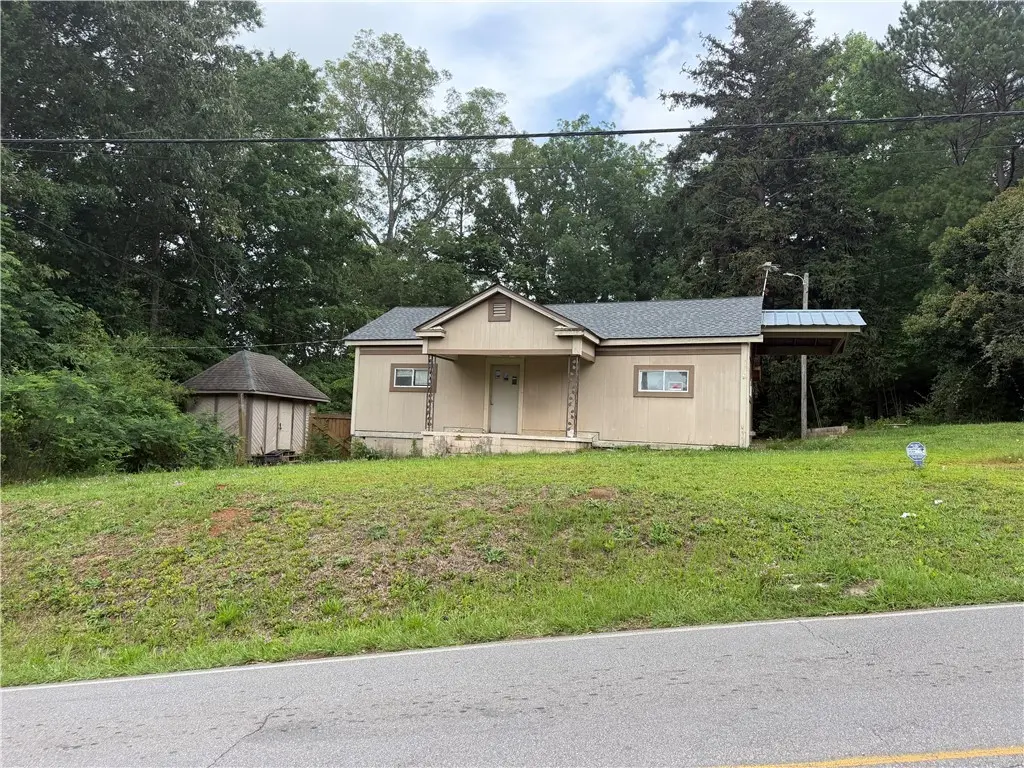
2092 Sanders Rd · Alexander City, AL
Flood risk 1/10 · Minimal
- FEMA flood zone
- X (unshaded)
- Chance of flooding over 30 yrs
- 0.0%
- Est. flood insurance / yr
- $507 – $1,088
Fire risk 3/10 · Minor
- Est. fire insurance / yr
- $916 – $1,700
Heat risk 6/10 · Moderate
- Hot days now (above 107°F)
- 7 days/yr
- Hot days in 30 yrs
- 19 days/yr
Wind risk 6/10 · Moderate
- Chance of severe wind over 30 yrs
- 60.0%
Air-quality risk 1/10 · Minimal
- Unhealthy air days now
- 0 days/yr
- Unhealthy air days in 30 yrs
- 0 days/yr
Risk factors via First Street. Map © Google.
Why this score? — see what drove the B- grade
The composite is a weighted blend of 9 inputs, each scored 0–100. Each bar is that input's sub-score; the figure is the points it added to the 100-point composite (weight × sub-score).
- Cash flow +30.0/30.0
- DSCR +10.0/10.0
- ARV discount +7.5/15.0
- 1% rule +7.4/10.0
- Livability +2.8/5.0
- Rent growth +2.5/5.0
- Condition / age +2.5/5.0
- Schools +2.3/10.0
- Appreciation +0.0/10.0
$60,000
🖨 Deal sheet 📄 Offer letter ✓ Due diligence
Listing remarks MLS
Looking for that fixer upper? This is it. Home needs a lot of TLC but if you are looking for a rental this could be it. Home is being sold AS IS.
Key facts
- New roof
- Corner lot
- 0.42 acre lot
Tags
Property features AI
Finance
- Other: Located in Metes & Bounds subdivision
- HOA & community: No association amenities
Exterior
- Utilities: Electricity available; Water available; Sewer connected
- Home design: One-story residential home; Clapboard siding
- Construction: Clapboard construction; Crawl space foundation
- Exterior features: Front porch; Patio; Corner lot
Interior
- Kitchen: Cooktop; Electric range
- Bedrooms: 1 main-level bedroom
- Flooring: Wood flooring
- Bathrooms: 1 full bathroom (main level)
- Heating & cooling: No heating; No cooling
- Interior features: Eat-in kitchen; Storage
Neighborhood map
What this means for you Summary
Snapshot
- This is a 2-bed/1.0-bath single-family listed at $60k.
Deal economics
- At list price, monthly cash flow is $227 ($3k/yr) — positive.
- The deal already cash-flows at list — no discount required.
- Meets the 1% rule at list price ($745 rent vs $60k).
- Recommended offer: $59k (1.5% below list) — sets the bar for market timing.
- Cap rate 10.8% vs local median 0.6% in Alexander City — top-decile yield for the area; either an underpriced asset or a hidden risk that comps aren't pricing in. Stress-test before assuming the spread holds.
Location & tenants
- Location reads 55/100 on livability (#426 in AL) — a working-class tenant base; expect higher turnover. Strengths: cost of living A+, housing A; Watch: crime F, amenities F, commute F.
- Alexander City (town): math 18% / reading 39% proficiency, ranked #77 of 129 in AL (top 60%) — low school quality limits family demand, transient renter base, plan for 1-2y turnover.
- Zoned schools: Jim Pearson Elementary School (772 students, 46% FRL).
- Market conditions: 205 active listings in the ZIP; 1 comparable units currently listed for rent nearby; 218 units permitted in Tallapoosa County in 2024 (0 in 5+ unit buildings).
Forward outlook
- Local home prices are declining (-3.0%/yr); year-one equity from $415 of loan paydown is wiped out by about $2k of value loss. Plan a longer hold.
- Tallapoosa County population projected at -22% by 2050 — secular population decline; favor cash flow + early exit over multi-decade hold.
- At projected returns (-3.0% appreciation + 3.0% rent growth), your $17k cash investment doubles in ~8 years — after that, you're playing with house money.
Negotiation context
- It's been on market 16 days — a 2% lower offer ($59k) is reasonable based on typical stale-listing flexibility.
- 3 sale attempts with the ask held roughly flat each time — persistent listings suggest the price (not the market) is what's stuck; bring a comps-based counter.
- Current owner paid $15k; list at $60k implies a 300% gain — meaningful room to come down on a strong offer.
Risks & watch-outs
- Watch-outs: built in 1957 — expect roof / HVAC / electrical / plumbing capex.
- Climate carrying-cost: major wind risk, 60% chance of damaging wind over 30y; extreme-heat days projected 7→19/yr by 2055 (HVAC capex compounding) — expect insurance premiums to compound above CPI over the hold.
Questions for the listing agent
- Built in 1957 — when were the roof, HVAC, electrical panel, plumbing, and water heater last replaced?
- Is there a deadline driving the sale (1031 exchange, divorce, estate, relocation)? That informs how much negotiation room exists.
- Schools are F-rated, which usually means shorter tenancies and higher turnover. Who's the typical renter profile here, and what's been the actual vacancy rate?
- Crime grade is F in this area — have there been break-ins, vandalism, or insurance claims at this property in the last 3 years? What carrier currently insures it and at what premium?
- What's the average days-on-market for RENTAL listings here right now (not sales)? A rising rental-DOM trend means longer vacancies and softer asking-rent achievability than the comps imply.
- What's the recent tenant-quality profile in this submarket — average credit score on applications, eviction rate, late-payment / NSF rate, and stable-employment percentage? A property-management company in the area should have these aggregated.
- How much new for-sale + rental construction is in the pipeline within 1–3 miles? Heavy new supply typically softens prices + rents 12–24 months out; constrained supply supports both.
Investment metrics
- 1% rule
- 1.24% ✓
- Cap rate
- 10.84%
- Cash-on-cash
- 16.22%
- DSCR
- 1.72
- GRM
- 6.7
CMA / ARV
- ARV (on-the-fly)
- $15,198
- Comps found
- 1
Show comp detail 1 sale within ~0.75 mi
| Address | Dist | Beds/Ba | Sqft | Sold | Price | $/sf | Match |
|---|---|---|---|---|---|---|---|
| 2092 Sanders Rd | 0.00mi | 2/1.0 | 894 (0%) | 10mo | $15,000 | $17 | 92 |
Match score weights: distance 35% · size 25% · config 20% · recency 20%. Top-matched comps best support the ARV.
Projected returns pro-forma
-3.0% appreciation · 3.0% rent growth · sell at horizon
- IRR
- 7.2%
- Equity multiple
- 1.28×
- Total profit
- $4,721
- Equity at exit
- $8,946
- IRR
- 16.5%
- Equity multiple
- 2.35×
- Total profit
- $22,649
- Equity at exit
- $5,188
Cash invested: $16,800 (down + closing). Projections, not guarantees.
Landlord ↔ Tenant lean methodology
- Overall (STATE)
- 90 Strongly Landlord-Friendly
- State Alabama
- 90 Strongly Landlord-Friendly · R+15
- County
- — inherits STATE
- City
- — inherits STATE
ZIP-level market 35010
- Home prices YoY
- -22.3%
- Active inventory
- 205
- Price-to-rent
- 6.7×
Monthly cashflow live
- Estimated rent
- $745 medium interval (Pro) →
- Mortgage (P&I)
- −$315
- Tax from tax record
- −$22 /mo · $262/yr
- Insurance
- −$25
- HOA
- −$0
- Vacancy / Maint / Mgmt
- −$156
- Net cashflow
- $227
Break-even live
UW: 25.0% down · 7.5% · 30yr · 1.5% tax · 5.0% vac · 8.0% maint · 8.0% mgmt
Financing live
Cash to close
- Down payment
- $15,000
- Closing costs
- $1,800
- Reserves months
- —
- Total cash needed
- —
Loan-product check · same deal, 3 products live
Conventional
25% down · 7.5% · 30yr
- Down + closing
- —
- Monthly P&I
- —
- Monthly cashflow
- —
- DSCR
- —
- Eligible?
- —
Personal DTI + credit; lowest rate.
DSCR
20% down · 8.5% · 30yr
- Down + closing
- —
- Monthly P&I
- —
- Monthly cashflow
- —
- DSCR
- —
- Eligible?
- —
No personal income docs; deal must DSCR.
Hard money
10% down · 12.0% · 12mo
- Down + closing
- —
- Monthly P&I
- —
- Monthly cashflow
- —
- DSCR
- —
- Eligible?
- —
Short-term bridge; refi at stabilization.
Rent comps 1 comps
| Address | Beds | Baths | Sqft | Rent | $/sqft | DOM | Units | Dist |
|---|---|---|---|---|---|---|---|---|
| 2148 Parkway Cir Alexander City, AL | 1.0–2.0 | 1.0 | 613 | $745 | $1.21 | 43d | 1 | 0.10mi |
Listing history 13 events
-
2026-06-19days on market $60,000 Active 16 DOM
-
2026-06-18days on market $60,000 Active 15 DOM
-
2026-06-17days on market $60,000 Active 14 DOM
-
2026-06-16days on market $60,000 Active 13 DOM
-
2026-06-15days on market $60,000 Active 12 DOM
-
2026-06-14days on market $60,000 Active 10 DOM
-
2026-06-12days on market $60,000 Active 9 DOM
-
2026-06-09days on market $60,000 Active 6 DOM
-
2026-06-08days on market $60,000 Active 5 DOM
-
2026-06-07days on market $60,000 Active 4 DOM
-
2026-06-07days on market $60,000 Active 3 DOM
-
2026-06-04remarks 430-char remark
-
2026-06-04$60,000 Active 1 DOM
ⓘ Source: listings_history table (triggers on properties + properties_extension) + one-shot
backfill from property_details.listing_events for pre-trigger history.
Tax reassessment forecast AL · Resets to sale price
- Current annual tax
- $262 · $22/mo
- Projected year-2 tax
- $262 · $22/mo
- Expected delta
- $0/yr ($0/mo · 0.0%)
ⓘ Screening estimate from a state-policy table — verify with the county assessor before closing.
Climate risk First Street
- Flood 1/10 Low FEMA zone X (unshaded) · 0% chance over 30 yrs
- Wildfire 3/10 Moderate
- Heat 6/10 Major 7 d/yr ≥107°F today · 19 d/yr by 30 yrs out
- Wind 6/10 Major 60% chance of damaging wind over 30 yrs
- Air quality 1/10 Low 0 unhealthy d/yr today · 0 by 30 yrs out
Nearby sold comps map
Loading sold comps map…
Walkable amenities ~0.75 mi
Loading nearby amenities…
Taxation est. · year 1
- Rental income
- $8,940
- − Mortgage interest
- −$3,361
- − Property taxes
- −$262
- − Insurance
- −$300
- − Repairs & maintenance
- −$715
- − Management
- −$715
- − Depreciation
- −$1,745
- Taxable income
- $1,842
- Est. tax owed @ 24.0%
- −$442
- After-tax cash flow
- $2,283/yr
For passive investors: Depreciation is non-cash, so a rental often shows a tax loss while cash-flowing — sheltering income. Rental losses are passive: they offset passive income freely, and up to $25,000/yr can offset ordinary (W-2) income if you actively participate and your MAGI is under $100k (phasing out to $0 by $150k); unused losses carry forward. On sale, claimed depreciation is recaptured at up to 25%, and gains may owe capital-gains tax (a 1031 exchange can defer both). Figures are a year-1 estimate at your 24.0% rate — not tax advice; consult a CPA.
Schools (NCES district)
- District
- Alexander City
- NCES district ID
- 0100030
- Math proficiency
- 18% ▼ -25.00%
- Reading proficiency
- 39% ▲ 1.00%
- Median HH income
- $35,482
- Composite
- 23.49/100
- National rank
- #7871
- State rank
- #77 of 129 in AL
Livability — Alexander City
- Score
- 55/100
- State rank
- #426
- US rank
- #23127
Category grades
Schools grade is shown separately in the Schools card above.
Census & demographics
- Census place
- Alexander City, AL
- City population
- 19,619
- Population (ZIP)
- 19,619
Population outlook (Tallapoosa County) Hauer SSP2
- Today (2025)
- 38,909 people
- By 2030
- 37,413 · -3.8%
- By 2040
- 33,935 · -12.8%
- By 2050
- 30,467 · -21.7%
- By 2075
- 22,716 · -41.6%
- By 2100
- 15,167 · -61.0%
Race, ethnicity, and origin ACS 2023
- Neighborhood character
- Diverse neighborhood (Simpson 0.56)
- Race & ethnicity
- White 59% Black 29% Two or more races 7% Hispanic / Latino 5%
- Common ancestry
- Italian 1% Serbian 1% Slovak 1%
- Foreign-born
- 3% · Canada, South Korea
- Languages at home
- 95% English-only · Spanish 3% Korean 1% German/W. Germanic 1%
Political lean MEDSL · Tallapoosa
- 2024 margin
- Solid R (+49.6) · D 24.9% · R 74.5%
- 2008→2024 swing
- -13.1pp toward R · 2008: -36.5pp · 2024: -49.6pp
- All cycles
- 2024: R+49.6 2020: R+43.4 2016: R+41.6 2012: R+32.4 2008: R+36.5
Not yet ingested
- Civics
- —
Market trends
- HPI YoY
- ▼ -48.88%
- Current HPI
- 170.2791
- Rent YoY
- —
- Metro
- —
- State GDP YoY
- ▲ 2.94%
- F500 in state
- 4
Industry mix (Fortune 500 HQ in AL)
| Industry | F500 HQs | Revenue |
|---|---|---|
| Financial Services | 1 | $8B |
|
||
| Healthcare | 1 | $5B |
|
||
Price history
+96.7% since first listed6 events — show timeline
- 2026-06-03 Listed $60,000 LCMLS
- 2025-09-05 Listed $60,000 MAAR
- 2025-08-28 Sold (MLS) $15,000 LMMLS
- 2025-08-25 Delisted — LMMLS
- 2025-08-23 Listed $25,000 LMMLS
- 2011-04-19 Sold (Public Records) $30,500 Public Records
Property tax history
+11.6%/yrLatest (2025): $262 · +117.9% YoY. Source: county tax records.
Cash-flow waterfall
monthlySold comps — $/sqft
last 12 mo · ≤1 miLoading sold comps…