 Multi-family
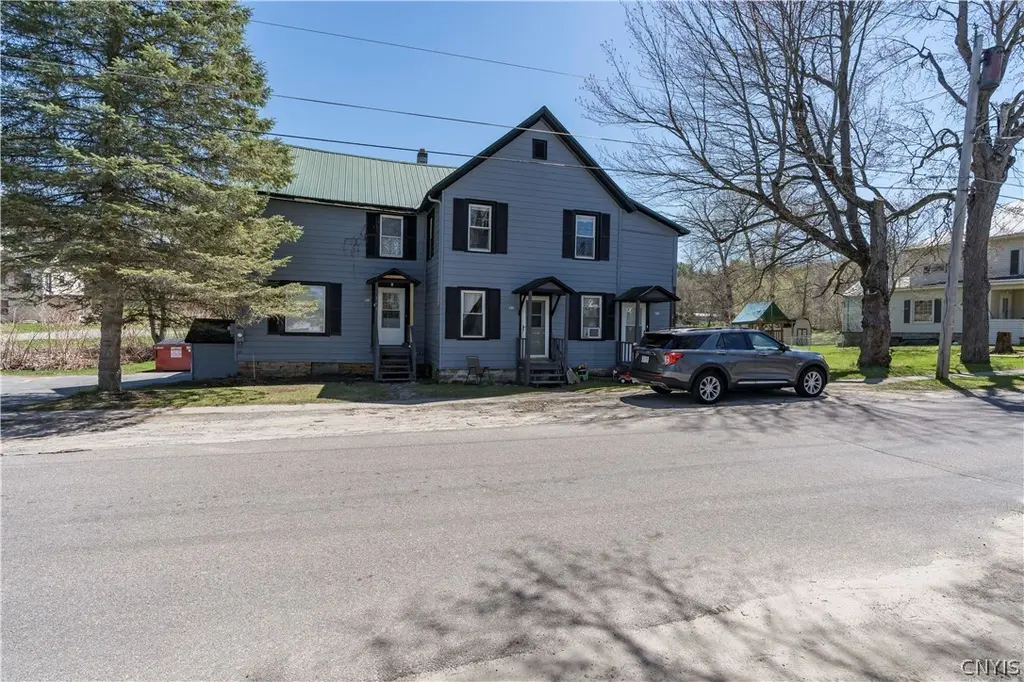
103-107 High St · Theresa, NY
Flood risk 8/10 · Major
- FEMA flood zone
- X
- Chance of flooding over 30 yrs
- 0.98%
- Est. flood insurance / yr
- $473 – $860
Fire risk 3/10 · Minor
- Est. fire insurance / yr
- $691 – $1,283
Heat risk 2/10 · Minimal
- Hot days now (above 93°F)
- 7 days/yr
- Hot days in 30 yrs
- 15 days/yr
Wind risk 1/10 · Minimal
- Chance of severe wind over 30 yrs
- 0.0%
Air-quality risk 2/10 · Minimal
- Unhealthy air days now
- 1 days/yr
- Unhealthy air days in 30 yrs
- 1 days/yr
Risk factors via First Street. Map © Google.
Why this score? — see what drove the B grade
The composite is a weighted blend of 9 inputs, each scored 0–100. Each bar is that input's sub-score; the figure is the points it added to the 100-point composite (weight × sub-score).
- Cash flow +26.8/30.0
- DSCR +9.2/10.0
- Appreciation +7.8/10.0
- ARV discount +7.5/15.0
- 1% rule +7.1/10.0
- Schools +3.5/10.0
- Livability +3.2/5.0
- Rent growth +2.5/5.0
- Condition / age +2.5/5.0
$254,000
🖨 Deal sheet 📄 Offer letter ✓ Due diligence
Multi-family units
County records classify this as Multi-Family (2-4 Unit). Listing-text estimate: 1 unit. estimate disagrees with records
Listing remarks
Triplex located in the heat of Theresa currently generating $2,750/month in rent. Opportunity exist to increase rents to market! Current owner made many investments in the property post purchase including new paint job, exterior stairs being rebuilt, two total unit makeovers with paint, flooring and some appliances. Additionally secured reliable tenant base. This one checks all the boxes! Cash flow, 1% rule, low maintenance and convenient location to Ft. Drum, Rt. 37 and I-81. For Potential Buyers: Must submit pre-approval or verification of funds prior to scheduling a showing. In an effort to minimize impact on current tenants, we may try to line up multiple showings on certain days. Don't
Key facts
- New paint job
- Unit makeovers
- 0.26 acre lot
Tags
Property features AI
Exterior
- Parking: No garage; Driveway parking
- Utilities: Public water connected; Sewer connected; Electric service
- Home design: Two-story residence; Existing structure
- Construction: Frame construction; Metal roof; Block foundation; Built as resale (existing)
- Exterior features: Blacktop driveway; City street frontage; Irregular residential lot
Interior
- Kitchen: Electric cooktop and electric oven/range; Refrigerator
- Bedrooms: Three main-level bedrooms
- Flooring: Carpet; Laminate; Luxury vinyl; Vinyl; Varies
- Bathrooms: Three full bathrooms; Two of the bathrooms are on the main level
- Heating & cooling: Electric baseboard heating; Heating details listed as 'see remarks'
- Interior features: Varied interior finishes and features (see remarks)
- Laundry & utility: Dryer; Electric water heater
Neighborhood map
What this means for you Summary
Snapshot
- This is a 6-bed/3.0-bath multifamily listed at $254k.
Deal economics
- At list price, monthly cash flow is $638 ($8k/yr) — positive.
- The deal already cash-flows at list — no discount required.
- Meets the 1% rule at list price ($3k rent vs $254k).
- Recommended offer: $246k (3.0% below list) — sets the bar for market timing.
Location & tenants
- Location reads 65/100 on livability (#693 in NY) — a middle-class / working-renter tenant base. Strengths: housing A+, crime A, cost of living A-; Watch: employment D, health & safety D, amenities F.
- Indian River Central School District (rural): math 33% / reading 50% proficiency, ranked #502 of 590 in NY (top 85%) — families likely to look elsewhere, expect single-tenant / working-renter base with shorter leases.
- Market conditions: 30 active listings in the ZIP; 196 units permitted in Jefferson County in 2024 (0 in 5+ unit buildings).
Forward outlook
- In year one you build about $16k of equity ($2k loan paydown + $14k appreciation (5.6% local appreciation)).
- Jefferson County population projected at -12% by 2050 — secular population decline; favor cash flow + early exit over multi-decade hold.
- At projected returns (5.6% appreciation + 3.0% rent growth), your $71k cash investment doubles in ~3 years — after that, you're playing with house money.
- By year 3, paydown + projected appreciation supports a ~$40k cash-out refi (75% LTV) — recoverable capital for the next deal without selling this one.
Negotiation context
- It's been on market 51 days — a 3% lower offer ($246k) is reasonable based on typical stale-listing flexibility.
- Current owner paid $32k; list at $254k implies a 694% gain — meaningful room to come down on a strong offer.
Risks & watch-outs
- Watch-outs: flood insurance adds $56/mo; built in 1925 — expect roof / HVAC / electrical / plumbing capex.
- Climate carrying-cost: severe flood risk — expect insurance premiums to compound above CPI over the hold.
Questions for the listing agent
- It's been on market 51 days. Have you received any prior offers? Is the seller open to a 3% concession, seller financing, or rate buy-down credit?
- Built in 1925 — when were the roof, HVAC, electrical panel, plumbing, and water heater last replaced?
- What's the actual annual flood-insurance premium (NFIP or private), and is the property in a SFHA with mandatory coverage?
- Is there a deadline driving the sale (1031 exchange, divorce, estate, relocation)? That informs how much negotiation room exists.
- What's the average days-on-market for RENTAL listings here right now (not sales)? A rising rental-DOM trend means longer vacancies and softer asking-rent achievability than the comps imply.
- What's the recent tenant-quality profile in this submarket — average credit score on applications, eviction rate, late-payment / NSF rate, and stable-employment percentage? A property-management company in the area should have these aggregated.
- How much new apartment / multifamily construction is in the pipeline within 1–3 miles? Heavy new supply (>2% of stock underway) typically softens rents 12–24 months out; light construction supports rent growth.
Investment metrics
- 1% rule
- 1.21% ✓
- Cap rate
- 9.57%
- Cash-on-cash
- 11.71%
- DSCR
- 1.52
- GRM
- 6.9
CMA / ARV
No comps found within radius.
Projected returns pro-forma
5.63% appreciation · 3.0% rent growth · sell at horizon
- IRR
- 23.5%
- Equity multiple
- 2.52×
- Total profit
- $108,425
- Equity at exit
- $153,695
- IRR
- 22.5%
- Equity multiple
- 5.06×
- Total profit
- $288,835
- Equity at exit
- $273,697
Cash invested: $71,120 (down + closing). Projections, not guarantees.
Landlord ↔ Tenant lean methodology
- Overall (STATE)
- 15 Strongly Tenant-Friendly
- State New York
- 15 Strongly Tenant-Friendly · D+10
- County
- — inherits STATE
- City
- — inherits STATE
ZIP-level market 13691
- Home prices YoY
- 1.2%
- Active inventory
- 30
- Price-to-rent
- 20.7×
Monthly cashflow live
- Estimated rent
- $3,062 medium interval (Pro) →
- Mortgage (P&I)
- −$1,332
- Tax from tax record
- −$287 /mo · $3,448/yr
- Insurance
- −$106
- Flood insurance flood zone
- −$56 /mo · $666/yr
- HOA
- −$0
- Vacancy / Maint / Mgmt
- −$643
- Net cashflow
- $638
Break-even live
3-unit breakdown (identical units grouped — click to expand)
| Units | Beds | Baths | Est. rent |
|---|---|---|---|
| 3× units | 2 | 1 | $3,063 |
| #1 | 2 | 1 | $1,021 |
| #2 | 2 | 1 | $1,021 |
| #3 | 2 | 1 | $1,021 |
| Total (3 units) | $3,062 | ||
UW: 25.0% down · 7.5% · 30yr · 1.5% tax · 5.0% vac · 8.0% maint · 8.0% mgmt
Financing live
Cash to close
- Down payment
- $63,500
- Closing costs
- $7,620
- Reserves months
- —
- Total cash needed
- —
Loan-product check · same deal, 3 products live
Conventional
25% down · 7.5% · 30yr
- Down + closing
- —
- Monthly P&I
- —
- Monthly cashflow
- —
- DSCR
- —
- Eligible?
- —
Personal DTI + credit; lowest rate.
DSCR
20% down · 8.5% · 30yr
- Down + closing
- —
- Monthly P&I
- —
- Monthly cashflow
- —
- DSCR
- —
- Eligible?
- —
No personal income docs; deal must DSCR.
Hard money
10% down · 12.0% · 12mo
- Down + closing
- —
- Monthly P&I
- —
- Monthly cashflow
- —
- DSCR
- —
- Eligible?
- —
Short-term bridge; refi at stabilization.
Listing history 18 events
-
2026-06-19days on market $254,000 Active 51 DOM
-
2026-06-18days on market $254,000 Active 50 DOM
-
2026-06-17days on market $254,000 Active 49 DOM
-
2026-06-16days on market $254,000 Active 48 DOM
-
2026-06-15days on market $254,000 Active 47 DOM
-
2026-06-14days on market $254,000 Active 45 DOM
-
2026-06-12pricedays on market $254,000 Active 44 DOM
-
2026-06-09days on market $259,000 Active 41 DOM
-
2026-06-08days on market $259,000 Active 40 DOM
-
2026-06-07days on market $259,000 Active 39 DOM
-
2026-06-05days on market $259,000 Active 36 DOM
-
2026-06-03days on market $259,000 Active 35 DOM
-
2026-06-02days on market $259,000 Active 34 DOM
-
2026-06-01days on market $259,000 Active 33 DOM
-
2026-05-31days on market $259,000 Active 32 DOM
-
2026-05-30days on market $259,000 Active 31 DOM
-
2026-04-29$259,000 Active
-
2004-09-17soldstatus $32,000
ⓘ Source: listings_history table (triggers on properties + properties_extension) + one-shot
backfill from property_details.listing_events for pre-trigger history.
Tax reassessment forecast NY · Partial reset (capped growth)
- Current annual tax
- $3,448 · $287/mo
- Projected year-2 tax
- $3,871 · $323/mo
- Expected delta
- +$422/yr (+$35/mo · 12.2%)
ⓘ Screening estimate from a state-policy table — verify with the county assessor before closing.
Climate risk First Street
- Flood 8/10 Severe FEMA zone X · 98% chance over 30 yrs
- Wildfire 3/10 Moderate
- Heat 2/10 Low 7 d/yr ≥93°F today · 15 d/yr by 30 yrs out
- Wind 1/10 Low 0% chance of damaging wind over 30 yrs
- Air quality 2/10 Low 1 unhealthy d/yr today · 1 by 30 yrs out
Nearby sold comps map
Loading sold comps map…
Walkable amenities ~0.75 mi
Loading nearby amenities…
Taxation est. · year 1
- Rental income
- $36,744
- − Mortgage interest
- −$14,228
- − Property taxes
- −$3,448
- − Insurance
- −$1,936
- − Repairs & maintenance
- −$2,940
- − Management
- −$2,940
- − Depreciation
- −$7,389
- Taxable income
- $3,863
- Est. tax owed @ 24.0%
- −$927
- After-tax cash flow
- $6,732/yr
For passive investors: Depreciation is non-cash, so a rental often shows a tax loss while cash-flowing — sheltering income. Rental losses are passive: they offset passive income freely, and up to $25,000/yr can offset ordinary (W-2) income if you actively participate and your MAGI is under $100k (phasing out to $0 by $150k); unused losses carry forward. On sale, claimed depreciation is recaptured at up to 25%, and gains may owe capital-gains tax (a 1031 exchange can defer both). Figures are a year-1 estimate at your 24.0% rate — not tax advice; consult a CPA.
Schools (NCES district)
- District
- Indian River Central School District
- NCES district ID
- 3615300
- Math proficiency
- 33% ▼ -21.00%
- Reading proficiency
- 50% ▲ 1.00%
- Median HH income
- $45,599
- Composite
- 35.25/100
- National rank
- #4977
- State rank
- #502 of 590 in NY
Livability — Theresa
- Score
- 65/100
- State rank
- #693
- US rank
- #13103
Category grades
Schools grade is shown separately in the Schools card above.
Census & demographics
- Census place
- Theresa, NY
- Population (ZIP)
- 3,172
Population outlook (Jefferson County) Hauer SSP2
- Today (2025)
- 111,748 people
- By 2030
- 109,370 · -2.1%
- By 2040
- 103,828 · -7.1%
- By 2050
- 98,523 · -11.8%
- By 2075
- 91,422 · -18.2%
- By 2100
- 78,214 · -30.0%
Race, ethnicity, and origin ACS 2023
- Neighborhood character
- Predominantly White (82%)
- Race & ethnicity
- White 82% Two or more races 12% Asian 3% Hispanic / Latino 2%
- Common ancestry
- Lithuanian 5% Slovak 2% Romanian 2%
- Foreign-born
- 2% · China, Canada
- Languages at home
- 97% English-only · Other Indo-European 1% Spanish 1% Chinese 1%
Political lean MEDSL · Jefferson
- 2024 margin
- Strong R (+23.6) · D 38.2% · R 61.8%
- 2008→2024 swing
- -18.3pp toward R · 2008: -5.3pp · 2024: -23.6pp
- All cycles
- 2024: R+23.6 2020: R+19.0 2016: R+22.4 2012: R+2.9 2008: R+5.3
Not yet ingested
- Civics
- —
Market trends
- HPI YoY
- ▲ 5.63%
- Current HPI
- 459.7016
- Rent YoY
- —
- Metro
- —
- State GDP YoY
- ▲ 2.60%
- F500 in state
- 92
Industry mix (Fortune 500 HQ in NY)
| Industry | F500 HQs | Revenue |
|---|---|---|
| Financial Services | 10 | $950B |
|
||
| Consumer Goods | 9 | $162B |
|
||
| Insurance | 4 | $225B |
|
||
| Telecommunications | 2 | $144B |
|
||
| Pharmaceuticals | 2 | $112B |
|
||
| Media / Entertainment | 2 | $69B |
|
||
Price history
+709.4% since first listed2 events — show timeline
- 2026-04-29 Listed $259,000 CNYIS
- 2004-09-17 Sold (Public Records) $32,000 Public Records
Property tax history
+1.2%/yrLatest (2025): $3,448 · +0.3% YoY. Source: county tax records.
Cash-flow waterfall
monthlySold comps — $/sqft
last 12 mo · ≤1 miLoading sold comps…