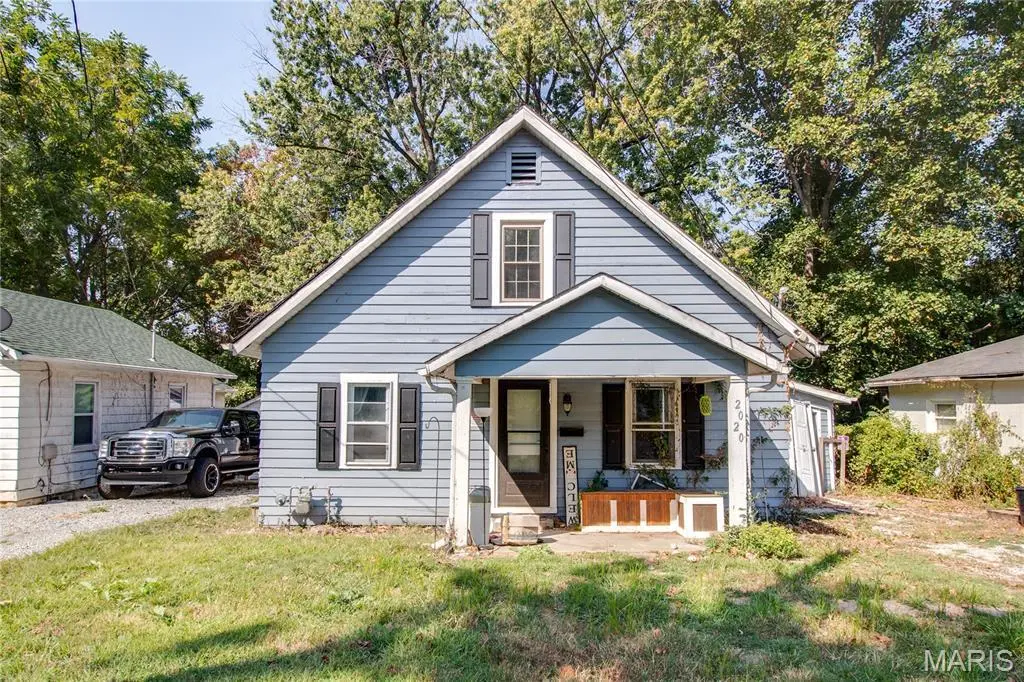
2020 Country Club Dr · Alton, IL
Flood risk 1/10 · Minimal
- FEMA flood zone
- X
- Chance of flooding over 30 yrs
- 0.0%
- Est. flood insurance / yr
- $473 – $860
Fire risk 1/10 · Minimal
- Est. fire insurance / yr
- $804 – $1,492
Heat risk 4/10 · Minor
- Hot days now (above 106°F)
- 7 days/yr
- Hot days in 30 yrs
- 19 days/yr
Wind risk 2/10 · Minimal
- Chance of severe wind over 30 yrs
- 1.0%
Air-quality risk 3/10 · Minor
- Unhealthy air days now
- 2 days/yr
- Unhealthy air days in 30 yrs
- 4 days/yr
Risk factors via First Street. Map © Google.
Why this score? — see what drove the C+ grade
The composite is a weighted blend of 9 inputs, each scored 0–100. Each bar is that input's sub-score; the figure is the points it added to the 100-point composite (weight × sub-score).
- Cash flow +30.0/30.0
- DSCR +10.0/10.0
- 1% rule +9.0/10.0
- Rent growth +4.6/5.0
- Livability +3.2/5.0
- Condition / age +2.5/5.0
- Schools +1.1/10.0
- ARV discount +0.0/15.0
- Appreciation +0.0/10.0
$80,000
🖨 Deal sheet (PDF) 📄 Offer letter ✓ Due diligence
Listing remarks MLS
Lots of potential in this 3 bedroom Alton home! Located in close proximity to Alton Middle School and several local businesses. The large fenced in backyard provides good entertaining space. The yard backs up to Rock Springs Park. Perfect for an investor or a buyer seeking a fixer upper. Home is being sold as is.
Key facts
- 8,598 sq ft lot
- Garage
- Built 1945
Neighborhood map
What this means for you Summary
Snapshot
- This is a 3-bed/1.0-bath single-family listed at $80k.
Deal economics
- At list price, monthly cash flow is $332 ($4k/yr) — positive.
- The deal already cash-flows at list — no discount required.
- Meets the 1% rule at list price ($1k rent vs $80k).
- Recommended offer: $70k (12.0% below list) — sets the bar for market timing.
- Cap rate 11.3% vs local median 6.4% in Alton — top-decile yield for the area; either an underpriced asset or a hidden risk that comps aren't pricing in. Stress-test before assuming the spread holds.
Location & tenants
- Location reads 64/100 on livability (#701 in IL) — a middle-class / working-renter tenant base. Strengths: cost of living A+, housing A; Watch: health & safety C-, schools F, crime F.
- Alton CUSD 11 (suburban): math 12% / reading 13% proficiency, ranked #544 of 620 in IL (top 88%) — low school quality limits family demand, transient renter base, plan for 1-2y turnover; 60% free/reduced lunch — lower-income household profile, screen leases tightly.
- Market conditions: Rents rising fast (+8.2%/yr); 169 active listings in the ZIP; 8 comparable units currently listed for rent nearby; rentals at typical pace (median 22d on market — plan ~3-4 weeks tenant-placement turnaround); 336 units permitted in Madison County in 2024 (0 in 5+ unit buildings).
Forward outlook
- Local home prices are declining (-3.0%/yr); year-one equity from $553 of loan paydown is wiped out by about $2k of value loss. Plan a longer hold.
- Madison County population projected at -18% by 2050 — secular population decline; favor cash flow + early exit over multi-decade hold.
- At projected returns (-3.0% appreciation + 8.0% rent growth), your $22k cash investment doubles in ~6 years — after that, you're playing with house money.
Negotiation context
- It's been on market 279 days — a 12% lower offer ($70k) is reasonable based on typical stale-listing flexibility.
- 2 sale attempts since 3y ago with the ask held roughly flat each time — persistent listings suggest the price (not the market) is what's stuck; bring a comps-based counter.
Risks & watch-outs
- Watch-outs: built in 1945 — expect roof / HVAC / electrical / plumbing capex.
Questions for the listing agent
- It's been on market 279 days. Have you received any prior offers? Is the seller open to a 12% concession, seller financing, or rate buy-down credit?
- Built in 1945 — when were the roof, HVAC, electrical panel, plumbing, and water heater last replaced?
- Why hasn't it sold? Are there any deal-killer items the seller is aware of (foundation, flood, title, zoning, code violations)?
- Is there a deadline driving the sale (1031 exchange, divorce, estate, relocation)? That informs how much negotiation room exists.
- Schools are F-rated, which usually means shorter tenancies and higher turnover. Who's the typical renter profile here, and what's been the actual vacancy rate?
- Crime grade is F in this area — have there been break-ins, vandalism, or insurance claims at this property in the last 3 years? What carrier currently insures it and at what premium?
- What's the average days-on-market for RENTAL listings here right now (not sales)? A rising rental-DOM trend means longer vacancies and softer asking-rent achievability than the comps imply.
- What's the recent tenant-quality profile in this submarket — average credit score on applications, eviction rate, late-payment / NSF rate, and stable-employment percentage? A property-management company in the area should have these aggregated.
- How much new for-sale + rental construction is in the pipeline within 1–3 miles? Heavy new supply typically softens prices + rents 12–24 months out; constrained supply supports both.
Investment metrics
- 1% rule
- 1.40% ✓
- Cap rate
- 11.27%
- Cash-on-cash
- 17.78%
- DSCR
- 1.79
- GRM
- 6.0
CMA / ARV
- ARV (median comp)
- $64,229
- List price
- $80,000
- Delta
- 24.55%
- Verdict
- OVERPRICED
- Comps
- 20 within 1.0 mi
Show comp detail 9 sales within ~0.75 mi
| Address | Dist | Beds/Ba | Sqft | Sold | Price | $/sf | Match |
|---|---|---|---|---|---|---|---|
| 2421 Main St | 0.49mi | 3/1.0 | 990 (+4%) | 16mo | $69,900 | $71 | 57 |
| 2309 Judson Ave | 0.27mi | 2/1.0 (-1) | 818 (-14%) | 8mo | $14,500 | $18 | 52 |
| 2623 Powhattan St | 0.46mi | 2/1.0 (-1) | 876 (-8%) | 10mo | $65,000 | $74 | 52 |
| 1235 Fairway Dr | 0.39mi | 2/1.0 (-1) | 1,076 (+13%) | 5mo | $60,000 | $56 | 50 |
| 2004 Clawson St | 0.46mi | 2/1.0 (-1) | 896 (-6%) | 16mo | $78,000 | $87 | 50 |
| 2329 Brown St | 0.57mi | 2/1.0 (-1) | 900 (-6%) | 13mo | $110,000 | $122 | 49 |
| 1134 Seiler St | 0.71mi | 3/1.0 | 903 (-5%) | 15mo | $5,000 | $6 | 46 |
| 1225 Fairway Dr | 0.41mi | 2/1.0 (-1) | 825 (-13%) | 16mo | $68,500 | $83 | 40 |
| 1521 Seminary St | 0.75mi | 2/1.0 (-1) | 810 (-15%) | 7mo | $107,500 | $133 | 29 |
Match score weights: distance 35% · size 25% · config 20% · recency 20%. Top-matched comps best support the ARV.
Projected returns pro-forma
-3.0% appreciation · 8.0% rent growth · sell at horizon
- IRR
- 14.8%
- Equity multiple
- 1.63×
- Total profit
- $14,096
- Equity at exit
- $11,928
- IRR
- 27.0%
- Equity multiple
- 3.97×
- Total profit
- $66,427
- Equity at exit
- $6,917
Cash invested: $22,400 (down + closing). Projections, not guarantees.
Landlord ↔ Tenant lean methodology
- Overall (STATE)
- 43 Moderately Tenant-Leaning
- State Illinois
- 43 Moderately Tenant-Leaning · D+7
- County
- — inherits STATE
- City
- — inherits STATE
ZIP-level market 62002
- Home prices YoY
- -33.6%
- Rents YoY
- 8.2%
- Active inventory
- 169
- Price-to-rent
- 6.0×
Monthly cashflow live
- Estimated rent
- $1,117 high interval (Pro) →
- Mortgage (P&I)
- −$420
- Tax from tax record
- −$98 /mo · $1,171/yr
- Insurance
- −$33
- HOA
- −$0
- Vacancy / Maint / Mgmt
- −$235
- Net cashflow
- $332
Break-even live
Sensitivity live
| Price | -10% $377 | -5% $355 | +0% $332 | +5% $309 | +10% $287 |
|---|---|---|---|---|---|
| Rent | -10% $244 | -5% $288 | +0% $332 | +5% $376 | +10% $420 |
| Rate | -1.0pp $372 | -0.5pp $352 | base $332 | +0.5pp $311 | +1.0pp $290 |
UW: 25.0% down · 7.5% · 30yr · 1.5% tax · 5.0% vac · 8.0% maint · 8.0% mgmt
Financing live
Cash to close
- Down payment
- $20,000
- Closing costs
- $2,400
- Reserves months
- —
- Total cash needed
- —
Loan-product check · same deal, 3 products live
Conventional
25% down · 7.5% · 30yr
- Down + closing
- —
- Monthly P&I
- —
- Monthly cashflow
- —
- DSCR
- —
- Eligible?
- —
Personal DTI + credit; lowest rate.
DSCR
20% down · 8.5% · 30yr
- Down + closing
- —
- Monthly P&I
- —
- Monthly cashflow
- —
- DSCR
- —
- Eligible?
- —
No personal income docs; deal must DSCR.
Hard money
10% down · 12.0% · 12mo
- Down + closing
- —
- Monthly P&I
- —
- Monthly cashflow
- —
- DSCR
- —
- Eligible?
- —
Short-term bridge; refi at stabilization.
Rent comps 8 comps
| Address | Beds | Baths | Sqft | Rent | $/sqft | DOM | Units | Dist |
|---|---|---|---|---|---|---|---|---|
| 2016 Salu St Alton, IL | 3.0 | 1.0 | 1073 | $1,100 | $1.03 | 17d | 1 | 0.35mi |
| 2222 Brown St Alton, IL | 4.0 | 2.0 | 1025 | $1,050 | $1.02 | 9d | 1 | 0.56mi |
| 2418 Sanford Ave Alton, IL | 2.0 | 1.0 | 958 | $875 | $0.91 | 21d | 1 | 0.96mi |
| 3303 Jackson St Alton, IL | 2.0 | 1.0 | 1050 | $1,295 | $1.23 | 45d | 1 | 1.06mi |
| 306 Lampert St Alton, IL | 2.0 | 1.0 | 925 | $1,000 | $1.08 | 0d | 1 | 1.25mi |
| 504 Cherry St Alton, IL | 2.0 | 1.0 | 1000 | $895 | $0.90 | 45d | 1 | 1.31mi |
| 3305 Franor St Alton, IL | 2.0 | 1.0 | 1000 | $549 | $0.55 | 3d | 1 | 1.35mi |
| 1110 George St Alton, IL | 2.0 | 1.0 | 780 | $1,019 | $1.31 | 45d | 1 | 1.45mi |
Listing history 21 events
-
2026-06-21days on market $80,000 Active 279 DOM
-
2026-06-18days on market $80,000 Active 276 DOM
-
2026-06-17days on market $80,000 Active 275 DOM
-
2026-06-16days on market $80,000 Active 274 DOM
-
2026-06-15days on market $80,000 Active 273 DOM
-
2026-06-13days on market $80,000 Active 271 DOM
-
2026-06-09days on market $80,000 Active 267 DOM
-
2026-06-08days on market $80,000 Active 266 DOM
-
2026-06-07days on market $80,000 Active 265 DOM
-
2026-06-03days on market $80,000 Active 261 DOM
-
2026-06-02days on market $80,000 Active 260 DOM
-
2026-06-01days on market $80,000 Active 259 DOM
-
2026-05-31days on market $80,000 Active 258 DOM
-
2025-09-15$80,000 Active 314-char remark
Show marketing remark (314 chars)
Lots of potential in this 3 bedroom Alton home! Located in close proximity to Alton Middle School and several local businesses. The large fenced in backyard provides good entertaining space. The yard backs up to Rock Springs Park. Perfect for an investor or a buyer seeking a fixer upper. Home is being sold as is.
-
2023-03-14soldstatus $90,000
-
2023-03-10soldstatus Closed 790-char remark
Show marketing remark (790 chars)
Welcome home to this charming 3 Bed/1 Bath home in the heart of Alton. This 2 story home boasts a fully updated kitchen complete with new cabinets, countertops, flooring, and includes all appliances. Also found on the main level is a large living room (with new flooring), dining room, and bedroom. The full bathroom is completely updated with a beautiful tiled shower, vanity, and tile flooring. Head upstairs to find two additional generously sized bedrooms with original hardwood floors. The unfinished walkout basement provides excellent space for future expansion or storage. You'll love entertain in the fully fenced backyard that features a huge deck and wooden walkways. This home also includes a one car garage and has new siding. Call your favorite agent today to schedule a tour.
-
2023-02-09status Pending 790-char remark
Show marketing remark (790 chars)
Welcome home to this charming 3 Bed/1 Bath home in the heart of Alton. This 2 story home boasts a fully updated kitchen complete with new cabinets, countertops, flooring, and includes all appliances. Also found on the main level is a large living room (with new flooring), dining room, and bedroom. The full bathroom is completely updated with a beautiful tiled shower, vanity, and tile flooring. Head upstairs to find two additional generously sized bedrooms with original hardwood floors. The unfinished walkout basement provides excellent space for future expansion or storage. You'll love entertain in the fully fenced backyard that features a huge deck and wooden walkways. This home also includes a one car garage and has new siding. Call your favorite agent today to schedule a tour.
-
2023-01-30$85,000 Active 790-char remark
Show marketing remark (790 chars)
Welcome home to this charming 3 Bed/1 Bath home in the heart of Alton. This 2 story home boasts a fully updated kitchen complete with new cabinets, countertops, flooring, and includes all appliances. Also found on the main level is a large living room (with new flooring), dining room, and bedroom. The full bathroom is completely updated with a beautiful tiled shower, vanity, and tile flooring. Head upstairs to find two additional generously sized bedrooms with original hardwood floors. The unfinished walkout basement provides excellent space for future expansion or storage. You'll love entertain in the fully fenced backyard that features a huge deck and wooden walkways. This home also includes a one car garage and has new siding. Call your favorite agent today to schedule a tour.
-
2012-08-28historical
-
1998-05-15soldstatus $17,000
-
1998-05-15soldstatus $40,000
ⓘ Source: listings_history table (triggers on properties + properties_extension) + one-shot
backfill from property_details.listing_events for pre-trigger history.
Tax reassessment forecast IL · Partial reset (capped growth)
- Current annual tax
- $1,171 · $98/mo
- Projected year-2 tax
- $1,494 · $124/mo
- Expected delta
- +$322/yr (+$27/mo · 27.5%)
ⓘ Screening estimate from a state-policy table — verify with the county assessor before closing.
Climate risk First Street
- Flood 1/10 Low FEMA zone X · 0% chance over 30 yrs
- Wildfire 1/10 Low
- Heat 4/10 Moderate 7 d/yr ≥106°F today · 19 d/yr by 30 yrs out
- Wind 2/10 Low 100% chance of damaging wind over 30 yrs
- Air quality 3/10 Moderate 2 unhealthy d/yr today · 4 by 30 yrs out
Nearby sold comps map
Loading sold comps map…
Walkable amenities ~0.75 mi
Loading nearby amenities…
Taxation est. · year 1
- Rental income
- $13,404
- − Mortgage interest
- −$4,481
- − Property taxes
- −$1,171
- − Insurance
- −$400
- − Repairs & maintenance
- −$1,072
- − Management
- −$1,072
- − Depreciation
- −$2,327
- Taxable income
- $2,879
- Est. tax owed @ 24.0%
- −$691
- After-tax cash flow
- $3,292/yr
For passive investors: Depreciation is non-cash, so a rental often shows a tax loss while cash-flowing — sheltering income. Rental losses are passive: they offset passive income freely, and up to $25,000/yr can offset ordinary (W-2) income if you actively participate and your MAGI is under $100k (phasing out to $0 by $150k); unused losses carry forward. On sale, claimed depreciation is recaptured at up to 25%, and gains may owe capital-gains tax (a 1031 exchange can defer both). Figures are a year-1 estimate at your 24.0% rate — not tax advice; consult a CPA.
Schools (NCES district)
- District
- Alton CUSD 11
- NCES district ID
- 1703600
- Math proficiency
- 12% ▼ -10.00%
- Reading proficiency
- 13% ▼ -10.00%
- Median HH income
- $46,257
- Composite
- 11.34/100
- National rank
- #9710
- State rank
- #544 of 620 in IL
Livability — Alton
- Score
- 64/100
- State rank
- #701
- US rank
- #14289
Category grades
Schools grade is shown separately in the Schools card above.
Census & demographics
- Census place
- Alton, IL
- County
- Madison County · 189,064 people
- City population
- 29,543
- Metro
- St. Louis, MO-IL
- Population (ZIP)
- 29,543
- Household income
- $61,414
- Rent vs Own
- Severe rent burden
- 960.0
Population outlook (Madison County) Hauer SSP2
- Today (2025)
- 258,371 people
- By 2030
- 251,523 · -2.7%
- By 2040
- 233,640 · -9.6%
- By 2050
- 213,042 · -17.5%
- By 2075
- 165,255 · -36.0%
- By 2100
- 123,953 · -52.0%
Race, ethnicity, and origin ACS 2023
- Neighborhood character
- Predominantly White (71%)
- Race & ethnicity
- White 71% Black 20% Two or more races 6% Hispanic / Latino 2% Asian 1%
- Common ancestry
- Romanian 2% Lithuanian 2% Slovak 1%
- Foreign-born
- 2% · Canada
- Languages at home
- 97% English-only · Spanish 1% Other Indo-European 1%
Political lean MEDSL · Madison
- 2024 margin
- R (+13.3) · D 42.5% · R 55.8% · Other 1.8%
- 2008→2024 swing
- -22.5pp toward R · 2008: 9.2pp · 2024: -13.3pp
- All cycles
- 2024: R+13.3 2020: R+13.2 2016: R+15.6 2012: R+1.4 2008: D+9.2
Not yet ingested
- Civics
- —
Market trends
- HPI YoY
- ▼ -98.43%
- Current HPI
- 194.7313
- Rent YoY
- ▲ 8.24%
- Metro
- St. Louis, MO-IL
- State GDP YoY
- ▲ 1.59%
- F500 in state
- 60
Industry mix (Fortune 500 HQ in IL)
| Industry | F500 HQs | Revenue |
|---|---|---|
| Insurance | 4 | $201B |
|
||
| Consumer Goods | 4 | $87B |
|
||
| Industrial Machinery | 3 | $64B |
|
||
| Healthcare | 2 | $55B |
|
||
| Retail / Pharmacy | 1 | $148B |
|
||
| Agriculture / Food | 1 | $86B |
|
||
Price history
+370.6% since first listed8 events — show timeline
- 2025-09-15 Listed $80,000 MARIS as Distributed by MLS Grid
- 2023-03-14 Sold (Public Records) $90,000 Public Records
- 2023-03-10 Sold (MLS) — MARIS as Distributed by MLS Grid
- 2023-02-09 Pending — MARIS as Distributed by MLS Grid
- 2023-01-30 Listed $85,000 MARIS as Distributed by MLS Grid
- 2012-08-28 Listing Removed — MRED as Distributed by MLS Grid
- 1998-05-15 Sold (Public Records) $40,000 Public Records
- 1998-05-15 Sold (Public Records) $17,000 Public Records
Property tax history
-1.4%/yrLatest (2024): $1,171 · +97.6% YoY. Source: county tax records.
Cash-flow waterfall
monthlySold comps — $/sqft
last 12 mo · ≤1 miLoading sold comps…