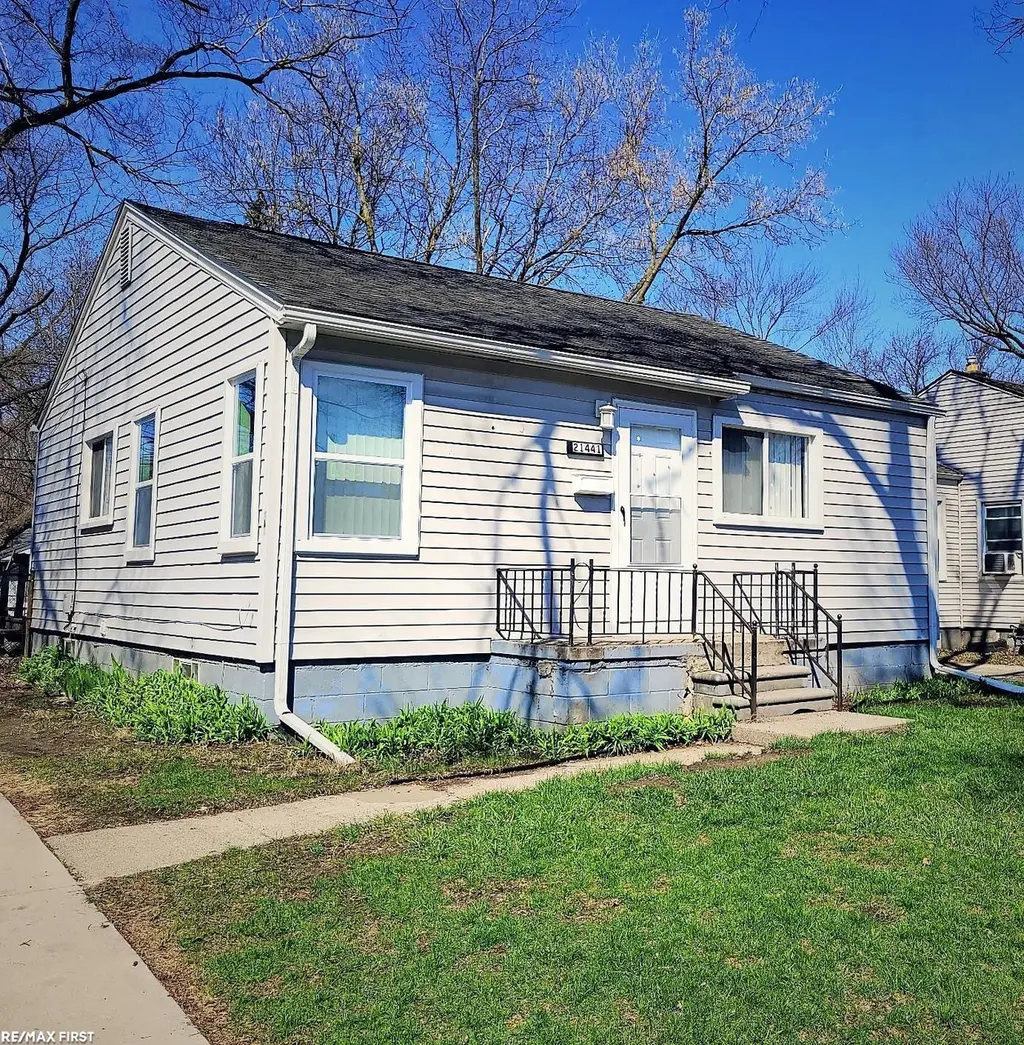
21441 Atlantic Av Ave · Warren, MI
Flood risk 7/10 · Major
- FEMA flood zone
- X (unshaded)
- Chance of flooding over 30 yrs
- 0.99%
- Est. flood insurance / yr
- $473 – $860
Fire risk 1/10 · Minimal
- Est. fire insurance / yr
- $784 – $1,456
Heat risk 3/10 · Minor
- Hot days now (above 97°F)
- 7 days/yr
- Hot days in 30 yrs
- 15 days/yr
Wind risk 1/10 · Minimal
- Chance of severe wind over 30 yrs
- —
Air-quality risk 3/10 · Minor
- Unhealthy air days now
- 3 days/yr
- Unhealthy air days in 30 yrs
- 5 days/yr
Risk factors via First Street. Map © Google.
Why this score? — see what drove the B- grade
The composite is a weighted blend of 9 inputs, each scored 0–100. Each bar is that input's sub-score; the figure is the points it added to the 100-point composite (weight × sub-score).
- Cash flow +27.2/30.0
- ARV discount +11.6/15.0
- DSCR +9.5/10.0
- 1% rule +9.0/10.0
- Livability +3.7/5.0
- Rent growth +3.1/5.0
- Condition / age +2.5/5.0
- Schools +1.3/10.0
- Appreciation +0.0/10.0
$95,000
🖨 Deal sheet (PDF) 📄 Offer letter ✓ Due diligence
Listing remarks MLS
Prime rental investment opportunity — a fully renovated ranch in a high-demand area. This turnkey two-bedroom, one-bath home is move-in ready for immediate cash flow, with a tenant already in place to ensure reliable, income from day one. All major systems have been updated, and recent upgrades include a new roof, new gutters, new windows, updated electrical and plumbing, enhanced insulation for lower operating costs, and new interior and exterior doors. The kitchen boasts new cabinets, and there is newly installed wood flooring throughout. The property is city-certified, underscoring its compliance and quality. Financials reflect a strong return on investment in a growing market. This home represents a hassle-free addition to any expanding portfolio, offering steady, predictable income from an already occupied unit in a desirable neighborhood with demonstrated rent demand. Important notices: Property has a tenant so please schedule a viewing, and allow for 24 hours’ notice prior to any showing. Don’t miss this opportunity to elevate your portfolio with a high-ROI, low-hassle rental.
Key facts
- Updated electrical
- New gutters
- New roof
Tags
Property features AI
Finance
- Other: Subdivision: RAMM & COS MOUND PARK # 01; Located near Toepfer and Mound
- HOA & community: Homeowners association present
Exterior
- Utilities: Public water; Public sewer
- Home design: Single-family residence; One story
- Construction: Vinyl siding; Slab foundation
- Exterior features: Lot approximately 47 x 122 (0.13 acres)
Interior
- Bathrooms: One full bathroom
- Heating & cooling: Forced air heating (natural gas); No central air conditioning
- Interior features: Two total rooms
Neighborhood map
What this means for you Summary
Snapshot
- This is a 2-bed/1.0-bath single-family listed at $95k.
Deal economics
- At list price, monthly cash flow is $217 ($3k/yr) — positive.
- The deal already cash-flows at list — no discount required.
- Meets the 1% rule at list price ($1k rent vs $95k).
- Recommended offer: $94k (1.5% below list) — sets the bar for market timing.
- Cap rate 9.7% vs local median 5.2% in Warren — top-decile yield for the area; either an underpriced asset or a hidden risk that comps aren't pricing in. Stress-test before assuming the spread holds.
Location & tenants
- Location reads 74/100 on livability (#171 in MI, #4,491 nationally) — a middle-class / working-renter tenant base. Strengths: commute A+, cost of living A+, housing A+; Watch: amenities D, employment D, crime D-.
- Fitzgerald Public Schools (urban): math 8% / reading 23% proficiency, ranked #503 of 540 in MI (top 93%) — low school quality limits family demand, transient renter base, plan for 1-2y turnover; 77% free/reduced lunch — lower-income household profile, screen leases tightly.
- Zoned schools: Mound Park Elementary School (math 6% / reading 16%, grade F, #1,226 of 1,397 statewide, top 88%, 260 students, 87% FRL); Pd Chatterton Middle School (math 9% / reading 27%, grade F, #433 of 493 statewide, top 88%, 410 students, 86% FRL); Fitzgerald Senior High School (math 8% / reading 26%, grade F, #636 of 713 statewide, top 89%, 806 students, 82% FRL).
- Market conditions: Rents rising (+2.4%/yr); 170 active listings in the ZIP; 34 comparable units currently listed for rent nearby; rentals at typical pace (median 26d on market — plan ~3-4 weeks tenant-placement turnaround); 1,321 units permitted in Macomb County in 2024 (86 in 5+ unit buildings).
Forward outlook
- Local home prices are declining (-3.0%/yr); year-one equity from $657 of loan paydown is wiped out by about $3k of value loss. Plan a longer hold.
- Macomb County population projected at +9% by 2050 — modest demand growth; plan on rents tracking national, not racing it.
Negotiation context
- It's been on market 24 days — a 2% lower offer ($94k) is reasonable based on typical stale-listing flexibility.
- 24 sale attempts since 27y ago with the ask held roughly flat each time — persistent listings suggest the price (not the market) is what's stuck; bring a comps-based counter.
- Current owner paid $69k; 38% above their basis — modest negotiation headroom, anchor on the comps not their cost.
Risks & watch-outs
- Watch-outs: property tax is 3.1% of price; flood insurance adds $56/mo; built in 1951 — expect roof / HVAC / electrical / plumbing capex.
- Climate carrying-cost: major flood risk — expect insurance premiums to compound above CPI over the hold.
Questions for the listing agent
- Built in 1951 — when were the roof, HVAC, electrical panel, plumbing, and water heater last replaced?
- Property tax is high relative to price — has the assessment been appealed recently, and will the sale trigger a re-assessment?
- What's the actual annual flood-insurance premium (NFIP or private), and is the property in a SFHA with mandatory coverage?
- Is there a deadline driving the sale (1031 exchange, divorce, estate, relocation)? That informs how much negotiation room exists.
- Schools are D-rated, which usually means shorter tenancies and higher turnover. Who's the typical renter profile here, and what's been the actual vacancy rate?
- Crime grade is D in this area — have there been break-ins, vandalism, or insurance claims at this property in the last 3 years? What carrier currently insures it and at what premium?
- What's the average days-on-market for RENTAL listings here right now (not sales)? A rising rental-DOM trend means longer vacancies and softer asking-rent achievability than the comps imply.
- What's the recent tenant-quality profile in this submarket — average credit score on applications, eviction rate, late-payment / NSF rate, and stable-employment percentage? A property-management company in the area should have these aggregated.
- How much new for-sale + rental construction is in the pipeline within 1–3 miles? Heavy new supply typically softens prices + rents 12–24 months out; constrained supply supports both.
Investment metrics
- 1% rule
- 1.40% ✓
- Cap rate
- 9.73%
- Cash-on-cash
- 12.29%
- DSCR
- 1.55
- GRM
- 5.9
CMA / ARV
- ARV (median comp)
- $104,629
- List price
- $95,000
- Delta
- -4.42%
- Verdict
- FAIR
- Comps
- 20 within 1.0 mi
Show comp detail 12 sales within ~0.75 mi
| Address | Dist | Beds/Ba | Sqft | Sold | Price | $/sf | Match |
|---|---|---|---|---|---|---|---|
| 22002 Panama Ave | 0.34mi | 2/1.0 | 780 (0%) | 9mo | $89,000 | $114 | 76 |
| 21589 Curie Ave | 0.12mi | 2/1.0 | 718 (-8%) | 8mo | $111,500 | $155 | 74 |
| 21116 Cyman Ave | 0.20mi | 2/1.0 | 710 (-9%) | 3mo | $85,000 | $120 | 74 |
| 20818 Atlantic Ave | 0.26mi | 2/1.0 | 836 (+7%) | 6mo | $72,000 | $86 | 71 |
| 21106 Audrey St | 0.13mi | 2/1.0 | 696 (-11%) | 6mo | $53,000 | $76 | 71 |
| 21034 Atlantic Ave | 0.18mi | 3/1.0 (+1) | 836 (+7%) | 5mo | $120,000 | $144 | 70 |
| 21771 Cunningham Ave | 0.35mi | 2/1.0 | 696 (-11%) | 4mo | $125,000 | $180 | 63 |
| 20203 Moenart St | 0.61mi | 2/1.0 | 725 (-7%) | 3mo | $48,000 | $66 | 57 |
| 20892 Dean St | 0.56mi | 2/1.0 | 840 (+8%) | 9mo | $136,500 | $163 | 54 |
| 21115 Albany Ave | 0.37mi | 3/1.5 (+1) | 859 (+10%) | 8mo | $155,000 | $180 | 52 |
| 20270 Dean Ave | 0.75mi | 3/1.0 (+1) | 792 (+2%) | 7mo | $55,000 | $69 | 51 |
| 22595 Curie Ave | 0.50mi | 2/1.0 | 887 (+14%) | 4mo | $40,000 | $45 | 50 |
Match score weights: distance 35% · size 25% · config 20% · recency 20%. Top-matched comps best support the ARV.
Projected returns pro-forma
-3.0% appreciation · 2.35% rent growth · sell at horizon
- IRR
- -2.3%
- Equity multiple
- 0.91×
- Total profit
- $-2,317
- Equity at exit
- $14,165
- IRR
- 6.6%
- Equity multiple
- 1.48×
- Total profit
- $12,791
- Equity at exit
- $8,214
Cash invested: $26,600 (down + closing). Projections, not guarantees.
Landlord ↔ Tenant lean methodology
- Overall (STATE)
- 62 Landlord-Friendly
- State Michigan
- 62 Landlord-Friendly · EVEN
- County
- — inherits STATE
- City
- — inherits STATE
ZIP-level market 48091
- Rents YoY
- 2.4%
- Active inventory
- 170
- Price-to-rent
- 5.9×
Monthly cashflow live
- Estimated rent
- $1,332 high interval (Pro) →
- Mortgage (P&I)
- −$498
- Tax from tax record
- −$242 /mo · $2,903/yr
- Insurance
- −$40
- Flood insurance flood zone
- −$56 /mo · $666/yr
- HOA
- −$0
- Vacancy / Maint / Mgmt
- −$280
- Net cashflow
- $217
Break-even live
Sensitivity live
| Price | -10% $271 | -5% $244 | +0% $217 | +5% $190 | +10% $163 |
|---|---|---|---|---|---|
| Rent | -10% $112 | -5% $164 | +0% $217 | +5% $269 | +10% $322 |
| Rate | -1.0pp $265 | -0.5pp $241 | base $217 | +0.5pp $192 | +1.0pp $167 |
UW: 25.0% down · 7.5% · 30yr · 1.5% tax · 5.0% vac · 8.0% maint · 8.0% mgmt
Financing live
Cash to close
- Down payment
- $23,750
- Closing costs
- $2,850
- Reserves months
- —
- Total cash needed
- —
Loan-product check · same deal, 3 products live
Conventional
25% down · 7.5% · 30yr
- Down + closing
- —
- Monthly P&I
- —
- Monthly cashflow
- —
- DSCR
- —
- Eligible?
- —
Personal DTI + credit; lowest rate.
DSCR
20% down · 8.5% · 30yr
- Down + closing
- —
- Monthly P&I
- —
- Monthly cashflow
- —
- DSCR
- —
- Eligible?
- —
No personal income docs; deal must DSCR.
Hard money
10% down · 12.0% · 12mo
- Down + closing
- —
- Monthly P&I
- —
- Monthly cashflow
- —
- DSCR
- —
- Eligible?
- —
Short-term bridge; refi at stabilization.
Rent comps 34 comps
| Address | Beds | Baths | Sqft | Rent | $/sqft | DOM | Units | Dist |
|---|---|---|---|---|---|---|---|---|
| 21410 Panama St Warren, MI | 3.0 | 1.0 | 900 | $1,600 | $1.78 | 26d | 1 | 0.22mi |
| 20794 Audrey Ave Warren, MI | 3.0 | 1.0 | 954 | $1,350 | $1.42 | 45d | 1 | 0.26mi |
| 21465 Syracuse Ave Warren, MI | 3.0 | 1.0 | 990 | $1,375 | $1.39 | 45d | 1 | 0.31mi |
| 22622 Panama Ave Warren, MI | 3.0 | 1.5 | 920 | $1,395 | $1.52 | 12d | 1 | 0.57mi |
| 22580 Masch Ave Warren, MI | 3.0 | 1.0 | 988 | $1,450 | $1.47 | 26d | 1 | 0.58mi |
| 20263 Caldwell St Detroit, MI | 3.0 | 1.0 | 909 | $1,350 | $1.49 | 18d | 1 | 0.59mi |
| 3974 Berkshire Ave Warren, MI | 1.0 | 1.0 | 900 | $1,350 | $1.50 | 0d | 1 | 0.62mi |
| 19930 Binder St Detroit, MI | 3.0 | 1.0 | 1000 | $1,450 | $1.45 | 18d | 1 | 1.01mi |
| 19450 Fenelon St Detroit, MI | 3.0 | 1.0 | 1062 | $1,384 | $1.30 | 6d | 1 | 1.03mi |
| 7033 Westminster Ave Warren, MI | 2.0 | 1.0 | 561 | $1,050 | $1.87 | 45d | 1 | 1.10mi |
| 7043 Meadow Ave Warren, MI | 2.0 | 1.0 | 911 | $1,274 | $1.40 | 45d | 1 | 1.12mi |
| 19361 Moenart St Unit 1 Detroit, MI | 2.0 | 1.0 | 1000 | $1,100 | $1.10 | 25d | 1 | 1.12mi |
| 7060 Victory Ave Warren, MI | 3.0 | 1.0 | 945 | $1,450 | $1.53 | 13d | 1 | 1.12mi |
| 3840 Bart Ave Warren, MI | 3.0 | 1.0 | 1062 | $1,350 | $1.27 | 26d | 1 | 1.16mi |
| 19415 Gable St Detroit, MI | 3.0 | 1.0 | 1000 | $1,373 | $1.37 | 26d | 1 | 1.17mi |
| 19260 Bloom St Detroit, MI | 3.0 | 1.0 | 1100 | $1,350 | $1.23 | 6d | 1 | 1.21mi |
| 21155 Warner Ave Warren, MI | 2.0 | 1.0 | 756 | $1,029 | $1.36 | 26d | 1 | 1.22mi |
| 20255 Harned St Detroit, MI | 3.0 | 1.0 | 1000 | $1,374 | $1.37 | 18d | 1 | 1.23mi |
| 7275 Chalmers Ave Warren, MI | 2.0 | 1.0 | 703 | $1,200 | $1.71 | 26d | 1 | 1.24mi |
| 7511 Toepfer Rd Warren, MI | 3.0 | 1.0 | 1032 | $1,199 | $1.16 | 23d | 1 | 1.26mi |
| 19450 Norwood St Detroit, MI | 3.0 | 1.0 | 1000 | $1,200 | $1.20 | 6d | 1 | 1.28mi |
| 19162 Conley St Detroit, MI | 2.0 | 1.0 | 1000 | $1,300 | $1.30 | 45d | 1 | 1.29mi |
| 19694 Gallagher St Detroit, MI | 3.0 | 1.0 | 1000 | $1,150 | $1.15 | 16d | 1 | 1.30mi |
| 7605 Jackson Ave Warren, MI | 2.0 | 1.0 | 600 | $1,165 | $1.94 | 26d | 1 | 1.37mi |
| 19360 Revere St Detroit, MI | 3.0 | 1.0 | 1050 | $1,250 | $1.19 | 26d | 1 | 1.37mi |
| 18891 Moenart St Detroit, MI | 3.0 | 1.0 | 870 | $1,195 | $1.37 | 18d | 1 | 1.40mi |
| 18884 Bloom St Detroit, MI | 3.0 | 1.0 | 979 | $975 | $1.00 | 45d | 1 | 1.41mi |
| 18884 Bloom St Detroit, MI | 3.0 | 1.0 | 979 | $975 | $1.00 | 23d | 1 | 1.41mi |
| 8065 Meadow Ave Warren, MI | 2.0 | 1.0 | 800 | $1,050 | $1.31 | 26d | 1 | 1.45mi |
| 8036 Hupp Ave Warren, MI | 2.0 | 1.0 | 680 | $1,150 | $1.69 | 45d | 1 | 1.46mi |
| 2709 Capitol Ave Warren, MI | 3.0 | 2.0 | 1056 | $1,649 | $1.56 | 45d | 1 | 1.47mi |
| 2034 John B Ave Warren, MI | 3.0 | 1.0 | 920 | $1,261 | $1.37 | 45d | 1 | 1.49mi |
| 19682 Rogge St Detroit, MI | 3.0 | 1.0 | 1000 | $1,350 | $1.35 | 0d | 1 | 1.49mi |
| 21516 Dequindre Rd Warren, MI | 1.0–2.0 | 1.0 | 837 | $1,375 | $1.64 | 23d | 1 | 1.50mi |
Listing history 50 events
-
2026-06-21days on market $95,000 Active 24 DOM
-
2026-06-18days on market $95,000 Active 21 DOM
-
2026-06-17days on market $95,000 Active 20 DOM
-
2026-06-16days on market $95,000 Active 19 DOM
-
2026-06-15days on market $95,000 Active 18 DOM
-
2026-06-13days on market $95,000 Active 16 DOM
-
2026-06-13days on market $95,000 Active 15 DOM
-
2026-06-09days on market $95,000 Active 12 DOM
-
2026-06-08days on market $95,000 Active 11 DOM
-
2026-06-07days on market $95,000 Active 10 DOM
-
2026-06-04days on market $95,000 Active 7 DOM
-
2026-06-03days on market $95,000 Active 6 DOM
-
2026-06-02days on market $95,000 Active 5 DOM
-
2026-06-01days on market $95,000 Active 4 DOM
-
2026-05-31days on market $95,000 Active 3 DOM
-
2026-04-01status Active 1156-char remark
-
2026-04-01status Active 1174-char remark
-
2026-04-01historical 1174-char remark
-
2026-03-02price $99,999 1174-char remark
-
2026-03-01price $99,999 1156-char remark
-
2026-01-05$105,000 Active 1156-char remark
-
2026-01-05historical 1156-char remark
-
2026-01-05$105,000 Active 1174-char remark
-
2026-01-02historical
-
2026-01-02historical
-
2025-11-21$105,000 Active
-
2025-11-21$105,000 Active
-
2025-10-13historical
-
2025-10-13historical
-
2025-08-22status Active
-
2025-08-22status Active
-
2025-08-18historical Accepting Backup Offers
-
2025-08-18historical Active Under Contract
-
2025-08-06$110,000 Active
-
2025-08-06$110,000 Active
-
2025-08-04historical
-
2025-08-04historical
-
2025-07-29price $114,999
-
2025-07-29price $116,500
-
2025-07-28price $114,999
-
2025-07-28price $116,500
-
2025-07-23price $118,500
-
2025-07-22price $118,500
-
2025-07-11$120,000 Active
-
2025-07-11$120,000 Active
-
2023-11-29soldstatus $69,000
-
2023-11-22soldstatus $69,000
-
2023-11-22soldstatus $69,000 Closed
-
2023-11-20status Pending
-
2023-11-18price $69,000
ⓘ Source: listings_history table (triggers on properties + properties_extension) + one-shot
backfill from property_details.listing_events for pre-trigger history.
Tax reassessment forecast MI · Partial reset (capped growth)
- Current annual tax
- $2,903 · $242/mo
- Projected year-2 tax
- $2,903 · $242/mo
- Expected delta
- $0/yr ($0/mo · 0.0%)
ⓘ Screening estimate from a state-policy table — verify with the county assessor before closing.
Climate risk First Street
- Flood 7/10 Severe FEMA zone X (unshaded) · 99% chance over 30 yrs
- Wildfire 1/10 Low
- Heat 3/10 Moderate 7 d/yr ≥97°F today · 15 d/yr by 30 yrs out
- Wind 1/10 Low
- Air quality 3/10 Moderate 3 unhealthy d/yr today · 5 by 30 yrs out
Nearby sold comps map
Loading sold comps map…
Walkable amenities ~0.75 mi
Loading nearby amenities…
Taxation est. · year 1
- Rental income
- $15,981
- − Mortgage interest
- −$5,321
- − Property taxes
- −$2,903
- − Insurance
- −$1,142
- − Repairs & maintenance
- −$1,279
- − Management
- −$1,279
- − Depreciation
- −$2,764
- Taxable income
- $1,295
- Est. tax owed @ 24.0%
- −$311
- After-tax cash flow
- $2,292/yr
For passive investors: Depreciation is non-cash, so a rental often shows a tax loss while cash-flowing — sheltering income. Rental losses are passive: they offset passive income freely, and up to $25,000/yr can offset ordinary (W-2) income if you actively participate and your MAGI is under $100k (phasing out to $0 by $150k); unused losses carry forward. On sale, claimed depreciation is recaptured at up to 25%, and gains may owe capital-gains tax (a 1031 exchange can defer both). Figures are a year-1 estimate at your 24.0% rate — not tax advice; consult a CPA.
Schools (NCES district)
- District
- Fitzgerald Public Schools
- NCES district ID
- 2614460
- Math proficiency
- 8% ▼ -8.00%
- Reading proficiency
- 23% ▼ -11.00%
- Median HH income
- $34,828
- Composite
- 12.67/100
- National rank
- #9608
- State rank
- #503 of 540 in MI
Livability — Warren
- Score
- 74/100
- State rank
- #171
- US rank
- #4491
Category grades
Schools grade is shown separately in the Schools card above.
Census & demographics
- Census place
- Warren, MI
- County
- Macomb County · 638,552 people
- City population
- 114,937
- Metro
- Detroit-Warren-Dearborn, MI
- Population (ZIP)
- 30,696
- Household income
- $54,230
- Rent vs Own
- Severe rent burden
- 1296.0
Population outlook (Macomb County) Hauer SSP2
- Today (2025)
- 925,296 people
- By 2030
- 948,226 · +2.5%
- By 2040
- 983,961 · +6.3%
- By 2050
- 1,010,200 · +9.2%
- By 2075
- 1,076,222 · +16.3%
- By 2100
- 1,077,065 · +16.4%
Race, ethnicity, and origin ACS 2023
- Neighborhood character
- Diverse neighborhood (Simpson 0.68)
- Race & ethnicity
- White 47% Black 25% Asian 19% Two or more races 5% Hispanic / Latino 3% Native American 2%
- Common ancestry
- Romanian 7% Lithuanian 2% Slovak 1%
- Foreign-born
- 16% · Canada
- Languages at home
- 77% English-only · Other Indo-European 14% Other Asian/Pacific 3% Russian/Polish/Slavic 2%
Political lean MEDSL · Macomb
- 2024 margin
- R (+13.7) · D 42.2% · R 55.9% · Other 1.9%
- 2008→2024 swing
- -22.3pp toward R · 2008: 8.6pp · 2024: -13.7pp
- All cycles
- 2024: R+13.7 2020: R+8.1 2016: R+11.6 2012: D+4.0 2008: D+8.6
Not yet ingested
- Civics
- —
Market trends
- HPI YoY
- ▼ -199.66%
- Current HPI
- 177.9273
- Rent YoY
- ▲ 2.35%
- Metro
- Detroit-Warren-Dearborn, MI
- State GDP YoY
- ▲ 1.37%
- F500 in state
- 28
Industry mix (Fortune 500 HQ in MI)
| Industry | F500 HQs | Revenue |
|---|---|---|
| Automotive Parts | 3 | $48B |
|
||
| Automotive | 2 | $372B |
|
||
| Chemicals | 1 | $45B |
|
||
| Automotive Retail | 1 | $29B |
|
||
| Healthcare / Medical Devices | 1 | $23B |
|
||
| Automotive Technology | 1 | $20B |
|
||
Price history
+280.0% since first listed63 events — show timeline
- 2026-05-28 Listed $95,000 REALCOMP
- 2026-05-28 Listing Removed — MiRealSource-MiMLS
- 2026-05-28 Listed $95,000 MiRealSource-MiMLS
- 2026-04-01 Relisted — REALCOMP
- 2026-04-01 Relisted — MiRealSource-MiMLS
- 2026-04-01 Listing Removed — MiRealSource-MiMLS
- 2026-03-02 Price Changed $99,999 MiRealSource-MiMLS
- 2026-03-01 Price Changed $99,999 REALCOMP
- 2026-01-05 Listed $105,000 REALCOMP
- 2026-01-05 Listed $105,000 MiRealSource-MiMLS
- 2026-01-05 Listing Removed — REALCOMP
- 2026-01-05 Listing Removed — REALCOMP
- 2026-01-02 Listing Removed — MiRealSource-MiMLS
- 2026-01-02 Listing Removed — REALCOMP
- 2025-11-21 Listed $105,000 REALCOMP
- 2025-11-21 Listed $105,000 MiRealSource-MiMLS
- 2025-10-13 Listing Removed — MiRealSource-MiMLS
- 2025-10-13 Listing Removed — REALCOMP
- 2025-08-22 Relisted — MiRealSource-MiMLS
- 2025-08-22 Relisted — REALCOMP
- 2025-08-18 Contingent — MiRealSource-MiMLS
- 2025-08-18 Contingent — REALCOMP
- 2025-08-06 Listed $110,000 MiRealSource-MiMLS
- 2025-08-06 Listed $110,000 REALCOMP
- 2025-08-04 Listing Removed — REALCOMP
- 2025-08-04 Listing Removed — MiRealSource-MiMLS
- 2025-07-29 Price Changed $114,999 MiRealSource-MiMLS
- 2025-07-29 Price Changed $116,500 MiRealSource-MiMLS
- 2025-07-28 Price Changed $114,999 REALCOMP
- 2025-07-28 Price Changed $116,500 REALCOMP
- 2025-07-23 Price Changed $118,500 MiRealSource-MiMLS
- 2025-07-22 Price Changed $118,500 REALCOMP
- 2025-07-11 Listed $120,000 REALCOMP
- 2025-07-11 Listed $120,000 MiRealSource-MiMLS
- 2023-11-29 Sold (Public Records) $69,000 Public Records
- 2023-11-22 Sold (MLS) $69,000 MiRealSource-MiMLS
- 2023-11-22 Sold (MLS) $69,000 REALCOMP
- 2023-11-20 Pending — MiRealSource-MiMLS
- 2023-11-18 Price Changed $69,000 MiRealSource-MiMLS
- 2023-11-17 Relisted — MiRealSource-MiMLS
- 2023-11-01 Listing Removed — MiRealSource-MiMLS
- 2023-10-30 Contingent — MiRealSource-MiMLS
- 2023-10-27 Listed $67,000 MiRealSource-MiMLS
- 2023-10-27 Listed $69,000 REALCOMP
- 2017-01-02 Listing Removed — MiRealSource-MiMLS
- 2017-01-02 Listing Removed — REALCOMP
- 2016-12-02 Listed $24,900 MiRealSource-MiMLS
- 2016-12-01 Listed $24,900 REALCOMP
- 2016-07-22 Sold (MLS) $20,000 MiRealSource-MiMLS
- 2016-07-22 Sold (MLS) $20,000 REALCOMP
- 2016-07-21 Listed $29,900 MiRealSource-MiMLS
- 2016-07-21 Listing Removed — MiRealSource-MiMLS
- 2016-07-21 Listed $29,900 REALCOMP
- 2016-07-21 Listing Removed — REALCOMP
- 2014-06-25 Listing Removed — REALCOMP
- 2014-06-25 Listing Removed — MiRealSource-MiMLS
- 2014-06-16 Listed $24,900 REALCOMP
- 2014-06-16 Listed $24,900 MiRealSource-MiMLS
- 2000-04-06 Sold (Public Records) $48,000 Public Records
- 1999-11-03 Sold (MLS) $48,000 MiRealSource-MiMLS
- 1999-09-25 Listing Removed — MiRealSource-MiMLS
- 1999-08-26 Listed $51,900 MiRealSource-MiMLS
- 1989-08-29 Sold (Public Records) $25,000 Public Records
Property tax history
+9.7%/yrLatest (2025): $2,903 · +0.0% YoY. Source: county tax records.
Cash-flow waterfall
monthlySold comps — $/sqft
last 12 mo · ≤1 miLoading sold comps…