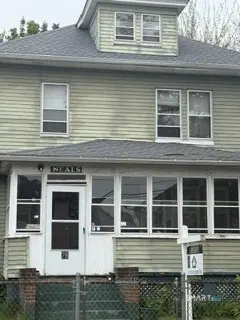
26 Euclid St W · Hartford, CT
Flood risk 1/10 · Minimal
- FEMA flood zone
- X (unshaded)
- Chance of flooding over 30 yrs
- 0.0%
- Est. flood insurance / yr
- $473 – $860
Fire risk 1/10 · Minimal
- Est. fire insurance / yr
- $829 – $1,539
Heat risk 5/10 · Moderate
- Hot days now (above 97°F)
- 7 days/yr
- Hot days in 30 yrs
- 16 days/yr
Wind risk 6/10 · Moderate
- Chance of severe wind over 30 yrs
- 27.0%
Air-quality risk 3/10 · Minor
- Unhealthy air days now
- 3 days/yr
- Unhealthy air days in 30 yrs
- 4 days/yr
Risk factors via First Street. Map © Google.
Why this score? — see what drove the C+ grade
The composite is a weighted blend of 9 inputs, each scored 0–100. Each bar is that input's sub-score; the figure is the points it added to the 100-point composite (weight × sub-score).
- Cash flow +17.5/30.0
- ARV discount +12.4/15.0
- Appreciation +10.0/10.0
- DSCR +5.5/10.0
- 1% rule +4.6/10.0
- Livability +3.8/5.0
- Rent growth +2.5/5.0
- Condition / age +2.5/5.0
- Schools +1.4/10.0
$267,000
🖨 Deal sheet (PDF) 📄 Offer letter ✓ Due diligence
Listing remarks
Colonial four bedroom two bathroom house with a lot of character. Nice back yard, front porch that adds character, roof is architectural shingles, heating system gas. This house has been well lived in it just needs some tic.
Key facts
- Back yard
- Front porch
- Heating system gas
Tags
Property features AI
Exterior
- Parking: Off-street parking; 5 total parking spaces
- Utilities: Public water; Public sewer; Natural gas
- Home design: Single-family home
- Construction: Frame construction; Concrete foundation; Asphalt shingle roof
- Exterior features: Breezeway; Level lot; Vinyl siding; Green exterior color
Interior
- Kitchen: Cooktop
- Bedrooms: 3 bedrooms
- Bathrooms: 2 full bathrooms
- Heating & cooling: Baseboard heat (natural gas)
- Interior features: Cable available; Ceiling fans; One fireplace; Full basement with hatchway; Walk-up attic
- Laundry & utility: 30-gallon natural gas hot water tank
Neighborhood map
What this means for you Summary
Snapshot
- This is a 3-bed/1.5-bath single-family listed at $267k.
Deal economics
- At list price, monthly cash flow is $206 ($2k/yr) — positive.
- The deal already cash-flows at list — no discount required.
- To meet the 1% rule (rent ≥ 1% of price), the offer needs to be $256k (4.3% below list).
- Recommended offer: $256k (4.3% below list) — sets the bar for 1% rule.
Location & tenants
- Location reads 76/100 on livability (#58 in CT, #3,553 nationally) — a middle-class / working-renter tenant base. Strengths: amenities A+, commute A+, health & safety A+; Watch: crime F, employment F.
- Hartford School District (urban): math 13% / reading 21% proficiency, ranked #150 of 153 in CT (top 98%) — low school quality limits family demand, transient renter base, plan for 1-2y turnover; 84% free/reduced lunch — lower-income household profile, screen leases tightly.
- Zoned schools: Stem Magnet At Annie Fisher School (math 27% / reading 44%, grade F, #335 of 553 statewide, top 61%, 344 students, 62% FRL); Renzulli Gifted And Talented Academy (math 52% / reading 72%, grade B+, #38 of 175 statewide, top 21%, 119 students, 72% FRL); University High School of Science And Engineering (math 37% / reading 42%, grade F, #107 of 194 statewide, top 56%, 412 students, 66% FRL) — zoned schools average 67% FRL vs 84% district-wide (17 pts lower); this property's tenant base skews higher-income than the district average.
- Zoned-school proficiency averages 46% at this address vs 17% district-wide (+29 pts) — the actual schools serving this property are materially stronger than the Hartford School District average implies; a family-tenant draw the district grade alone would hide.
- Market conditions: 47 active listings in the ZIP; 3 comparable units currently listed for rent nearby; rentals leasing fast (median 14d on market — plan ~1-2 weeks tenant-placement turnaround); lower-income renter base — watch delinquency; 1,867 units permitted in Capitol Planning Region in 2024 (1,399 in 5+ unit buildings).
- At $2,556/mo this rent would consume 69% of the median local household income ($44k/yr) (locally 1466% of renters already pay >50% of income on rent) — very limited rent-growth headroom before tenants either downsize or default.
Forward outlook
- In year one you build about $29k of equity ($2k loan paydown + $27k appreciation (10.0% local appreciation)).
- At projected returns (10.0% appreciation + 3.0% rent growth), your $75k cash investment doubles in ~3 years — after that, you're playing with house money.
- By year 2, paydown + projected appreciation supports a ~$46k cash-out refi (75% LTV) — recoverable capital for the next deal without selling this one.
Negotiation context
- It's been on market 44 days — a 3% lower offer ($259k) is reasonable based on typical stale-listing flexibility.
Risks & watch-outs
- Watch-outs: built in 1916 — expect roof / HVAC / electrical / plumbing capex.
- Climate carrying-cost: major wind risk, 27% chance of damaging wind over 30y; extreme-heat days projected 7→16/yr by 2055 (HVAC capex compounding) — expect insurance premiums to compound above CPI over the hold.
Questions for the listing agent
- It's been on market 44 days. Have you received any prior offers? Is the seller open to a 4% concession, seller financing, or rate buy-down credit?
- Built in 1916 — when were the roof, HVAC, electrical panel, plumbing, and water heater last replaced?
- Is there a deadline driving the sale (1031 exchange, divorce, estate, relocation)? That informs how much negotiation room exists.
- Schools are D-rated, which usually means shorter tenancies and higher turnover. Who's the typical renter profile here, and what's been the actual vacancy rate?
- Crime grade is F in this area — have there been break-ins, vandalism, or insurance claims at this property in the last 3 years? What carrier currently insures it and at what premium?
- What's the average days-on-market for RENTAL listings here right now (not sales)? A rising rental-DOM trend means longer vacancies and softer asking-rent achievability than the comps imply.
- What's the recent tenant-quality profile in this submarket — average credit score on applications, eviction rate, late-payment / NSF rate, and stable-employment percentage? A property-management company in the area should have these aggregated.
- How much new for-sale + rental construction is in the pipeline within 1–3 miles? Heavy new supply typically softens prices + rents 12–24 months out; constrained supply supports both.
Investment metrics
- 1% rule
- 0.96% ✗
- Cap rate
- 7.22%
- Cash-on-cash
- 3.31%
- DSCR
- 1.15
- GRM
- 8.7
CMA / ARV
- ARV (median comp)
- $299,479
- List price
- $267,000
- Delta
- -10.85%
- Verdict
- UNDERPRICED
- Comps
- 20 within 1.0 mi
Show comp detail 4 sales within ~0.75 mi
| Address | Dist | Beds/Ba | Sqft | Sold | Price | $/sf | Match |
|---|---|---|---|---|---|---|---|
| 102 Brookline Ave | 0.23mi | 4/1.5 (+1) | 1,792 (+3%) | 20mo | $290,000 | $162 | 63 |
| 13 Patton Rd | 0.47mi | 3/1.5 | 1,612 (-8%) | 3mo | $350,000 | $217 | 63 |
| 104 Boothbay St | 0.44mi | 4/1.5 (+1) | 1,567 (-10%) | 11mo | $240,000 | $153 | 48 |
| 11 Mitchell Dr | 0.53mi | 3/2.0 | 1,540 (-12%) | 22mo | $269,000 | $175 | 36 |
Match score weights: distance 35% · size 25% · config 20% · recency 20%. Top-matched comps best support the ARV.
Projected returns pro-forma
10.0% appreciation · 3.0% rent growth · sell at horizon
- IRR
- 26.7%
- Equity multiple
- 3.12×
- Total profit
- $158,557
- Equity at exit
- $240,535
- IRR
- 23.4%
- Equity multiple
- 7.11×
- Total profit
- $456,642
- Equity at exit
- $518,722
Cash invested: $74,760 (down + closing). Projections, not guarantees.
Landlord ↔ Tenant lean methodology
- Overall (STATE)
- 27 Tenant-Leaning
- State Connecticut
- 27 Tenant-Leaning · D+7
- County
- — inherits STATE
- City
- — inherits STATE
ZIP-level market 06112
- Home prices YoY
- 4.9%
- Active inventory
- 47
- Price-to-rent
- 8.7×
Monthly cashflow live
- Estimated rent
- $2,556 medium interval (Pro) →
- Mortgage (P&I)
- −$1,400
- Tax from tax record
- −$302 /mo · $3,618/yr
- Insurance
- −$111
- HOA
- −$0
- Vacancy / Maint / Mgmt
- −$537
- Net cashflow
- $206
Break-even live
Sensitivity live
| Price | -10% $357 | -5% $282 | +0% $206 | +5% $130 | +10% $55 |
|---|---|---|---|---|---|
| Rent | -10% $4 | -5% $105 | +0% $206 | +5% $307 | +10% $408 |
| Rate | -1.0pp $341 | -0.5pp $274 | base $206 | +0.5pp $137 | +1.0pp $66 |
UW: 25.0% down · 7.5% · 30yr · 1.5% tax · 5.0% vac · 8.0% maint · 8.0% mgmt
Financing live
Cash to close
- Down payment
- $66,750
- Closing costs
- $8,010
- Reserves months
- —
- Total cash needed
- —
Loan-product check · same deal, 3 products live
Conventional
25% down · 7.5% · 30yr
- Down + closing
- —
- Monthly P&I
- —
- Monthly cashflow
- —
- DSCR
- —
- Eligible?
- —
Personal DTI + credit; lowest rate.
DSCR
20% down · 8.5% · 30yr
- Down + closing
- —
- Monthly P&I
- —
- Monthly cashflow
- —
- DSCR
- —
- Eligible?
- —
No personal income docs; deal must DSCR.
Hard money
10% down · 12.0% · 12mo
- Down + closing
- —
- Monthly P&I
- —
- Monthly cashflow
- —
- DSCR
- —
- Eligible?
- —
Short-term bridge; refi at stabilization.
Rent comps 3 comps
| Address | Beds | Baths | Sqft | Rent | $/sqft | DOM | Units | Dist |
|---|---|---|---|---|---|---|---|---|
| 38 Baltic St Hartford, CT | 3.0 | 1.0 | 1938 | $2,300 | $1.19 | 18d | 1 | 0.39mi |
| 42 Alderwood Dr West Hartford, CT | 3.0 | 1.5 | 1470 | $3,300 | $2.24 | 13d | 1 | 1.27mi |
| 38 Portage Rd West Hartford, CT | 4.0 | 3.0 | 1842 | $3,950 | $2.14 | 3d | 1 | 1.43mi |
Listing history 17 events
-
2026-06-22days on market $267,000 Active 44 DOM
-
2026-06-18days on market $267,000 Active 41 DOM
-
2026-06-17days on market $267,000 Active 40 DOM
-
2026-06-16days on market $267,000 Active 39 DOM
-
2026-06-15days on market $267,000 Active 38 DOM
-
2026-06-13days on market $267,000 Active 36 DOM
-
2026-06-13days on market $267,000 Active 35 DOM
-
2026-06-10days on market $267,000 Active 33 DOM
-
2026-06-09days on market $267,000 Active 32 DOM
-
2026-06-08days on market $267,000 Active 31 DOM
-
2026-06-07days on market $267,000 Active 30 DOM
-
2026-06-05days on market $267,000 Active 27 DOM
-
2026-06-03days on market $267,000 Active 26 DOM
-
2026-06-02days on market $267,000 Active 25 DOM
-
2026-06-01days on market $267,000 Active 24 DOM
-
2026-05-31days on market $267,000 Active 23 DOM
-
2026-05-08$267,000 Active 224-char remark
ⓘ Source: listings_history table (triggers on properties + properties_extension) + one-shot
backfill from property_details.listing_events for pre-trigger history.
Tax reassessment forecast CT · Partial reset (capped growth)
- Current annual tax
- $3,618 · $302/mo
- Projected year-2 tax
- $4,666 · $389/mo
- Expected delta
- +$1,048/yr (+$87/mo · 29.0%)
ⓘ Screening estimate from a state-policy table — verify with the county assessor before closing.
Climate risk First Street
- Flood 1/10 Low FEMA zone X (unshaded) · 0% chance over 30 yrs
- Wildfire 1/10 Low
- Heat 5/10 Major 7 d/yr ≥97°F today · 16 d/yr by 30 yrs out
- Wind 6/10 Major 27% chance of damaging wind over 30 yrs
- Air quality 3/10 Moderate 3 unhealthy d/yr today · 4 by 30 yrs out
Nearby sold comps map
Loading sold comps map…
Walkable amenities ~0.75 mi
Loading nearby amenities…
Taxation est. · year 1
- Rental income
- $30,668
- − Mortgage interest
- −$14,956
- − Property taxes
- −$3,618
- − Insurance
- −$1,335
- − Repairs & maintenance
- −$2,453
- − Management
- −$2,453
- − Depreciation
- −$7,767
- Taxable loss
- −$1,915
- Est. tax savings @ 24.0%
- +$460
- After-tax cash flow
- $2,932/yr
For passive investors: Depreciation is non-cash, so a rental often shows a tax loss while cash-flowing — sheltering income. Rental losses are passive: they offset passive income freely, and up to $25,000/yr can offset ordinary (W-2) income if you actively participate and your MAGI is under $100k (phasing out to $0 by $150k); unused losses carry forward. On sale, claimed depreciation is recaptured at up to 25%, and gains may owe capital-gains tax (a 1031 exchange can defer both). Figures are a year-1 estimate at your 24.0% rate — not tax advice; consult a CPA.
Schools (NCES district)
- District
- Hartford School District
- NCES district ID
- 0901920
- Math proficiency
- 13% ▼ -5.00%
- Reading proficiency
- 21% ▼ -6.00%
- Median HH income
- $30,521
- Composite
- 13.54/100
- National rank
- #9514
- State rank
- #150 of 153 in CT
Livability — Hartford
- Score
- 76/100
- State rank
- #58
- US rank
- #3553
Category grades
Schools grade is shown separately in the Schools card above.
Census & demographics
- Census place
- Hartford, CT
- County
- Hartford County · 754,208 people
- City population
- 121,162
- Metro
- Hartford-East Hartford-Middletown, CT
- Population (ZIP)
- 22,333
- Household income
- $44,460
- Rent vs Own
- Severe rent burden
- 1466.0
Population outlook (Capitol County) Hauer SSP2
- By 2040
- 1,063,519
Race, ethnicity, and origin ACS 2023
- Neighborhood character
- Predominantly Black (68%)
- Race & ethnicity
- Black 68% Hispanic / Latino 19% White 9% Two or more races 6%
- Hispanic origin (detail)
- Puerto Rican 15% Dominican 1%
- Common ancestry
- Hispanic 2%
- Foreign-born
- 26% · Canada
- Languages at home
- 81% English-only · Spanish 14% French/Haitian/Cajun 2% Other Indo-European 1%
Political lean MEDSL · Capitol
- 2024 margin
- Strong D (+21.9) · D 60.1% · R 38.2% · Other 1.7%
- All cycles
- 2024: D+21.9
Not yet ingested
- Civics
- —
Market trends
- HPI YoY
- ▲ 14.58%
- Current HPI
- 310.7763
- Rent YoY
- —
- Metro
- Hartford-East Hartford-Middletown, CT
- State GDP YoY
- ▲ 1.06%
- F500 in state
- 38
Industry mix (Fortune 500 HQ in CT)
| Industry | F500 HQs | Revenue |
|---|---|---|
| Industrial Machinery | 4 | $38B |
|
||
| Insurance | 3 | $71B |
|
||
| Financial Services | 2 | $25B |
|
||
| Transportation / Logistics | 2 | $18B |
|
||
| Healthcare | 1 | $247B |
|
||
| Telecommunications | 1 | $55B |
|
||
Price history
1 event — show timeline
- 2026-05-08 Listed $267,000 Smart MLS
Property tax history
+2.5%/yrLatest (2025): $3,618 · +0.0% YoY. Source: county tax records.
Cash-flow waterfall
monthlySold comps — $/sqft
last 12 mo · ≤1 miLoading sold comps…