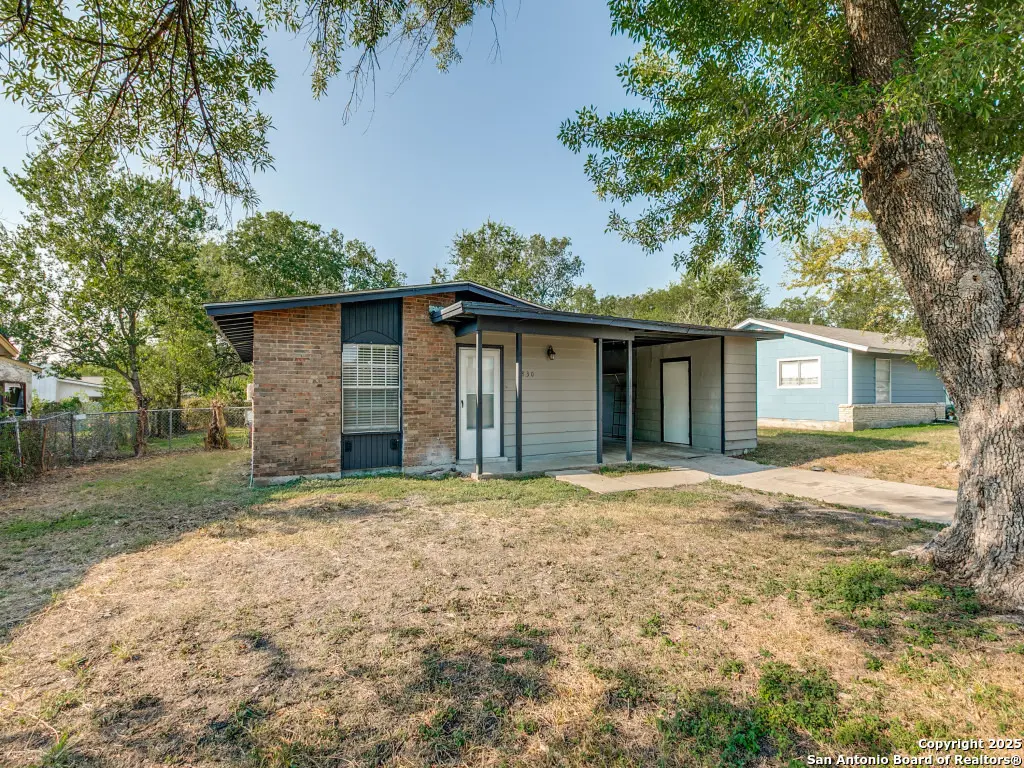
5830 Castle Yard · San Antonio, TX
Flood risk 1/10 · Minimal
- FEMA flood zone
- X (unshaded)
- Chance of flooding over 30 yrs
- 0.0%
- Est. flood insurance / yr
- $507 – $1,088
Fire risk 1/10 · Minimal
- Est. fire insurance / yr
- $1,222 – $2,270
Heat risk 8/10 · Major
- Hot days now (above 108°F)
- 7 days/yr
- Hot days in 30 yrs
- 22 days/yr
Wind risk 8/10 · Major
- Chance of severe wind over 30 yrs
- 80.0%
Air-quality risk 2/10 · Minimal
- Unhealthy air days now
- 0 days/yr
- Unhealthy air days in 30 yrs
- 1 days/yr
Risk factors via First Street. Map © Google.
Why this score? — see what drove the D grade
The composite is a weighted blend of 9 inputs, each scored 0–100. Each bar is that input's sub-score; the figure is the points it added to the 100-point composite (weight × sub-score).
- ARV discount +15.0/15.0
- Cash flow +11.2/30.0
- 1% rule +4.4/10.0
- Livability +4.0/5.0
- DSCR +3.3/10.0
- Condition / age +2.5/5.0
- Schools +2.4/10.0
- Rent growth +1.1/5.0
- Appreciation +0.0/10.0
$149,200
🖨 Deal sheet (PDF) 📄 Offer letter ✓ Due diligence
Listing remarks MLS
One-story home with endless potential! This 2-bedroom, 1-bathroom property in the East Village subdivision, just off Loop 410, offers convenient access to city amenities. Perfect for investors or those looking to make it their own, the spacious backyard provides ample room for expansion or creating an outdoor retreat. A true value-add opportunity!
Key facts
- Spacious backyard
- Endless potential
- 7,927 sq ft lot
Tags
Neighborhood map
What this means for you Summary
Snapshot
- This is a 3-bed/1.0-bath single-family listed at $149k.
Deal economics
- At list price, monthly cash flow is $-58 ($-698/yr) — negative.
- To cash-flow at today's rent, offer at most $139k (6.9% below list).
- To meet the 1% rule (rent ≥ 1% of price), the offer needs to be $140k (6.5% below list).
- Recommended offer: $131k (12.0% below list) — sets the bar for market timing.
- Cap rate 5.8% vs local median 3.8% in San Antonio — top-decile yield for the area; either an underpriced asset or a hidden risk that comps aren't pricing in. Stress-test before assuming the spread holds.
Location & tenants
- Location reads 80/100 on livability (#31 in TX, #1,616 nationally) — a professional / high-income tenant draw. Strengths: amenities A+, commute A+, cost of living A+; Watch: crime F.
- Judson ISD (suburban): math 21% / reading 33% proficiency, ranked #660 of 826 in TX (top 80%) — low school quality limits family demand, transient renter base, plan for 1-2y turnover.
- Zoned schools: Park Village El (math 8% / reading 22%, grade F, #4,021 of 4,322 statewide, top 94%, 441 students, 88% FRL); Kirby Middle (math 11% / reading 23%, grade F, #1,520 of 1,662 statewide, top 92%, 683 students, 94% FRL); Karen Wagner H S (math 12% / reading 29%, grade F, #1,389 of 1,632 statewide, top 86%, 2,366 students, 80% FRL) — zoned schools average 88% FRL vs 57% district-wide (31 pts higher); higher-poverty schools than district average — tighter screening recommended.
- Market conditions: Rents falling (-5.6%/yr); 135 active listings in the ZIP; 32 comparable units currently listed for rent nearby; rentals at typical pace (median 24d on market — plan ~3-4 weeks tenant-placement turnaround); 8,308 units permitted in Bexar County in 2024 (2,506 in 5+ unit buildings).
Forward outlook
- Local home prices are declining (-3.0%/yr); year-one equity from $1k of loan paydown is wiped out by about $4k of value loss. Plan a longer hold.
- Bexar County population projected at +50% by 2050 — long-run rental-demand tailwind backs the buy-and-hold thesis.
Negotiation context
- It's been on market 277 days — a 12% lower offer ($131k) is reasonable based on typical stale-listing flexibility.
- 2 sale attempts; this cycle's ask is 10557% above the opening price — seller raised mid-cycle; expect resistance to lowballs.
Risks & watch-outs
- Watch-outs: property tax is 2.5% of price.
- Climate carrying-cost: severe wind risk, 80% chance of damaging wind over 30y; extreme-heat days projected 7→22/yr by 2055 (HVAC capex compounding) — expect insurance premiums to compound above CPI over the hold.
Questions for the listing agent
- What do current leases actually rent for vs. the listed asking? Can we see a recent rent roll and the last 12 months of T-12 income?
- It's been on market 277 days. Have you received any prior offers? Is the seller open to a 12% concession, seller financing, or rate buy-down credit?
- Built in 1970 — when were the roof, HVAC, electrical panel, plumbing, and water heater last replaced?
- Property tax is high relative to price — has the assessment been appealed recently, and will the sale trigger a re-assessment?
- Why hasn't it sold? Are there any deal-killer items the seller is aware of (foundation, flood, title, zoning, code violations)?
- Is there a deadline driving the sale (1031 exchange, divorce, estate, relocation)? That informs how much negotiation room exists.
- Crime grade is F in this area — have there been break-ins, vandalism, or insurance claims at this property in the last 3 years? What carrier currently insures it and at what premium?
- The area grade is low — what's the realistic commute time and amenity access for the typical tenant pool here? Any planned neighborhood developments (good or bad) we should know about?
- What's the average days-on-market for RENTAL listings here right now (not sales)? A rising rental-DOM trend means longer vacancies and softer asking-rent achievability than the comps imply.
- What's the recent tenant-quality profile in this submarket — average credit score on applications, eviction rate, late-payment / NSF rate, and stable-employment percentage? A property-management company in the area should have these aggregated.
- How much new for-sale + rental construction is in the pipeline within 1–3 miles? Heavy new supply typically softens prices + rents 12–24 months out; constrained supply supports both.
Investment metrics
- 1% rule
- 0.94% ✗
- Cap rate
- 5.83%
- Cash-on-cash
- -1.67%
- DSCR
- 0.93
- GRM
- 8.9
CMA / ARV
- ARV (median comp)
- $181,807
- List price
- $149,200
- Delta
- -17.94%
- Verdict
- UNDERPRICED
- Comps
- 20 within 1.0 mi
Show comp detail 12 sales within ~0.75 mi
| Address | Dist | Beds/Ba | Sqft | Sold | Price | $/sf | Match |
|---|---|---|---|---|---|---|---|
| 5806 Castle Yard | 0.08mi | 2/1.0 (-1) | 984 (+2%) | 11mo | $130,000 | $132 | 78 |
| 5814 Castle Lk | 0.18mi | 3/1.0 | 998 (+4%) | 12mo | $178,500 | $179 | 75 |
| 4806 Castle Brg | 0.20mi | 3/1.0 | 900 (-6%) | 15mo | $185,000 | $206 | 67 |
| 5878 Midcrown Dr | 0.07mi | 2/1.0 (-1) | 896 (-7%) | 17mo | $139,995 | $156 | 66 |
| 4818 Castle Inn | 0.23mi | 3/1.0 | 864 (-10%) | 12mo | $179,500 | $208 | 63 |
| 4830 Castle Arms | 0.46mi | 3/1.5 | 952 (-1%) | 20mo | $180,000 | $189 | 59 |
| 6022 Castle Vw | 0.28mi | 3/1.0 | 864 (-10%) | 20mo | $170,000 | $197 | 54 |
| 5242 Village Hvn | 0.69mi | 3/1.5 | 930 (-3%) | 10mo | $154,900 | $167 | 52 |
| 4843 Castle Shield | 0.52mi | 3/1.0 | 1,032 (+8%) | 16mo | $129,900 | $126 | 50 |
| 5235 Village Gln | 0.67mi | 3/1.0 | 984 (+2%) | 19mo | $180,000 | $183 | 49 |
| 5239 Village Hvn | 0.70mi | 3/1.0 | 900 (-6%) | 14mo | $179,800 | $200 | 45 |
| 4831 Castle Sword | 0.41mi | 4/2.0 (+1) | 1,050 (+9%) | 14mo | $229,700 | $219 | 45 |
Match score weights: distance 35% · size 25% · config 20% · recency 20%. Top-matched comps best support the ARV.
Projected returns pro-forma
-3.0% appreciation · 0.0% rent growth · sell at horizon
- IRR
- -22.9%
- Equity multiple
- 0.24×
- Total profit
- $-31,869
- Equity at exit
- $22,246
- IRR
- -29.7%
- Equity multiple
- -0.15×
- Total profit
- $-47,915
- Equity at exit
- $12,900
Cash invested: $41,776 (down + closing). Projections, not guarantees.
Landlord ↔ Tenant lean methodology
- Overall (STATE)
- 87 Strongly Landlord-Friendly
- State Texas
- 87 Strongly Landlord-Friendly · R+5
- County
- — inherits STATE
- City
- — inherits STATE
ZIP-level market 78218
- Home prices YoY
- -16.1%
- Rents YoY
- -5.6%
- Active inventory
- 135
- Price-to-rent
- 8.9×
Monthly cashflow live
- Estimated rent
- $1,396 high interval (Pro) →
- Mortgage (P&I)
- −$782
- Tax from tax record
- −$316 /mo · $3,792/yr
- Insurance
- −$62
- HOA
- −$0
- Vacancy / Maint / Mgmt
- −$293
- Net cashflow
- $-58
Break-even live
Sensitivity live
| Price | -10% $26 | -5% $-16 | +0% $-58 | +5% $-100 | +10% $-143 |
|---|---|---|---|---|---|
| Rent | -10% $-168 | -5% $-113 | +0% $-58 | +5% $-3 | +10% $52 |
| Rate | -1.0pp $17 | -0.5pp $-20 | base $-58 | +0.5pp $-97 | +1.0pp $-136 |
UW: 25.0% down · 7.5% · 30yr · 1.5% tax · 5.0% vac · 8.0% maint · 8.0% mgmt
Financing live
Cash to close
- Down payment
- $37,300
- Closing costs
- $4,476
- Reserves months
- —
- Total cash needed
- —
Loan-product check · same deal, 3 products live
Conventional
25% down · 7.5% · 30yr
- Down + closing
- —
- Monthly P&I
- —
- Monthly cashflow
- —
- DSCR
- —
- Eligible?
- —
Personal DTI + credit; lowest rate.
DSCR
20% down · 8.5% · 30yr
- Down + closing
- —
- Monthly P&I
- —
- Monthly cashflow
- —
- DSCR
- —
- Eligible?
- —
No personal income docs; deal must DSCR.
Hard money
10% down · 12.0% · 12mo
- Down + closing
- —
- Monthly P&I
- —
- Monthly cashflow
- —
- DSCR
- —
- Eligible?
- —
Short-term bridge; refi at stabilization.
Rent comps 32 comps
| Address | Beds | Baths | Sqft | Rent | $/sqft | DOM | Units | Dist |
|---|---|---|---|---|---|---|---|---|
| 4839 Castle Strm San Antonio, TX | 3.0 | 1.0 | 872 | $1,300 | $1.49 | 24d | 1 | 0.42mi |
| 4843 Castle Shield San Antonio, TX | 3.0 | 1.0 | 1032 | $1,350 | $1.31 | 26d | 1 | 0.53mi |
| 4830 Ray Bon Dr Unit 710 San Antonio, TX | 2.0 | 2.0 | 850 | $1,158 | $1.36 | 0d | 1 | 0.74mi |
| 5414 Midcrown Dr Unit 710 San Antonio, TX | 2.0 | 2.0 | 998 | $1,031 | $1.03 | 0d | 1 | 0.80mi |
| 5819 Woodhill San Antonio, TX | 3.0 | 2.0 | 1015 | $1,300 | $1.28 | 45d | 1 | 0.89mi |
| 5100 Eisenhauer Rd Unit 710 San Antonio, TX | 2.0 | 2.0 | 1088 | $1,196 | $1.10 | 0d | 1 | 0.90mi |
| 5143 Village Lawn San Antonio, TX | 3.0 | 1.5 | 1008 | $1,450 | $1.44 | 24d | 1 | 0.98mi |
| 7526 Windsor Oaks Unit 7526 San Antonio, TX | 2.0 | 1.0 | 730 | $900 | $1.23 | 9d | 1 | 1.17mi |
| 7548 Windsor Oaks Unit 7548 San Antonio, TX | 3.0 | 2.0 | 1001 | $1,200 | $1.20 | 45d | 1 | 1.22mi |
| 4545 Hoeneke St San Antonio, TX | 2.0 | 2.0 | 995 | $999 | $1.00 | 6d | 2 | 1.22mi |
| 5415 N Foster Rd San Antonio, TX | 1.0–3.0 | 1.0–2.0 | 966 | $1,655 | $1.71 | 0d | 23 | 1.24mi |
| 7571 Windsor Oaks San Antonio, TX | 2.0 | 1.0 | 750 | $695 | $0.93 | 26d | 1 | 1.26mi |
| 4807 Georges Farm San Antonio, TX | 3.0 | 2.0 | 1008 | $1,295 | $1.28 | 45d | 1 | 1.27mi |
| 4411 Mystic Sunrise Dr San Antonio, TX | 3.0 | 2.0 | 1120 | $2,000 | $1.79 | 26d | 1 | 1.30mi |
| 7027 Farm-To-Market Road 78 Unit 9204 San Antonio, TX | 2.0 | 2.0 | 954 | $1,780 | $1.87 | 6d | 1 | 1.32mi |
| 7027 Farm to Market Road 78 Unit 14203 San Antonio, TX | 2.0 | 1.0 | 881 | $1,580 | $1.79 | 5d | 1 | 1.32mi |
| 7027 Farm to Market Road 78 Unit 710 San Antonio, TX | 2.0 | 2.0 | 881 | $1,115 | $1.27 | 0d | 1 | 1.32mi |
| 8000 Midcrown Dr San Antonio, TX | 1.0–3.0 | 1.0–2.0 | 853 | $1,251 | $1.47 | 3d | 26 | 1.34mi |
| 7651 Oak Chase San Antonio, TX | 3.0 | 3.5 | 1034 | $1,695 | $1.64 | 26d | 1 | 1.37mi |
| 5310 Gawain Dr San Antonio, TX | 2.0 | 2.0 | 912 | $1,099 | $1.21 | 26d | 1 | 1.40mi |
| 4711 Gavlick Farm San Antonio, TX | 3.0 | 1.0 | 975 | $1,250 | $1.28 | 45d | 1 | 1.40mi |
| 5341 Gawain Dr Apt 224 San Antonio, TX | 2.0 | 1.0 | 763 | $1,075 | $1.41 | 0d | 1 | 1.40mi |
| 5341 Gawain Dr Apt 212 San Antonio, TX | 2.0 | 1.0 | 763 | $1,075 | $1.41 | 5d | 1 | 1.40mi |
| 5341 Gawain Dr Unit 314 San Antonio, TX | 2.0 | 1.0 | 763 | $1,099 | $1.44 | 16d | 1 | 1.40mi |
| 5308 Gawain Dr San Antonio, TX | 2.0 | 2.0 | 912 | $1,195 | $1.31 | 45d | 1 | 1.41mi |
| 7027 FM 78 San Antonio, TX | 1.0–3.0 | 1.0–2.0 | 868 | $2,351 | $2.71 | 22d | 10 | 1.41mi |
| 5306 Gawain Dr Unit 5308 San Antonio, TX | 2.0 | 2.0 | 912 | $1,195 | $1.31 | 45d | 1 | 1.41mi |
| 7107 Winding Shelf San Antonio, TX | 3.0 | 1.0 | 1016 | $1,408 | $1.39 | 26d | 1 | 1.45mi |
| 5202 Gawain Dr San Antonio, TX | 2.0 | 1.0 | 1100 | $1,075 | $0.98 | 13d | 1 | 1.45mi |
| 5315 Gawain Dr Unit 710 San Antonio, TX | 2.0 | 2.0 | 944 | $1,073 | $1.14 | 0d | 1 | 1.46mi |
| 4848 Goldfield San Antonio, TX | 2.0 | 1.0 | 930 | $1,325 | $1.42 | 45d | 1 | 1.46mi |
| 5954 Summer Fest Dr San Antonio, TX | 2.0 | 1.0 | 919 | $1,300 | $1.41 | 45d | 1 | 1.48mi |
Listing history 20 events
-
2026-06-21days on market $149,200 Active 277 DOM
-
2026-06-18days on market $149,200 Active 274 DOM
-
2026-06-17days on market $149,200 Active 273 DOM
-
2026-06-16days on market $149,200 Active 272 DOM
-
2026-06-15days on market $149,200 Active 271 DOM
-
2026-06-13days on market $149,200 Active 269 DOM
-
2026-06-09days on market $149,200 Active 265 DOM
-
2026-06-08days on market $149,200 Active 264 DOM
-
2026-06-07days on market $149,200 Active 263 DOM
-
2026-06-04days on market $149,200 Active 260 DOM
-
2026-06-03days on market $149,200 Active 259 DOM
-
2026-06-02statusdays on market $149,200 Active 258 DOM
-
2026-06-01days on market $149,200 Price Change 257 DOM
-
2026-05-31days on market $149,200 Price Change 256 DOM
-
2026-05-06price $159,200 349-char remark
Show marketing remark (349 chars)
One-story home with endless potential! This 2-bedroom, 1-bathroom property in the East Village subdivision, just off Loop 410, offers convenient access to city amenities. Perfect for investors or those looking to make it their own, the spacious backyard provides ample room for expansion or creating an outdoor retreat. A true value-add opportunity!
-
2026-04-16price $1,250
-
2026-02-22$1,400
-
2025-11-17price $170,500 349-char remark
Show marketing remark (349 chars)
One-story home with endless potential! This 2-bedroom, 1-bathroom property in the East Village subdivision, just off Loop 410, offers convenient access to city amenities. Perfect for investors or those looking to make it their own, the spacious backyard provides ample room for expansion or creating an outdoor retreat. A true value-add opportunity!
-
2025-09-17$178,500 New 349-char remark
Show marketing remark (349 chars)
One-story home with endless potential! This 2-bedroom, 1-bathroom property in the East Village subdivision, just off Loop 410, offers convenient access to city amenities. Perfect for investors or those looking to make it their own, the spacious backyard provides ample room for expansion or creating an outdoor retreat. A true value-add opportunity!
-
2003-01-06soldstatus
ⓘ Source: listings_history table (triggers on properties + properties_extension) + one-shot
backfill from property_details.listing_events for pre-trigger history.
Tax reassessment forecast TX · Resets to sale price
- Current annual tax
- $3,792 · $316/mo
- Projected year-2 tax
- $3,792 · $316/mo
- Expected delta
- $0/yr ($0/mo · 0.0%)
ⓘ Screening estimate from a state-policy table — verify with the county assessor before closing.
Climate risk First Street
- Flood 1/10 Low FEMA zone X (unshaded) · 0% chance over 30 yrs
- Wildfire 1/10 Low
- Heat 8/10 Severe 7 d/yr ≥108°F today · 22 d/yr by 30 yrs out
- Wind 8/10 Severe 80% chance of damaging wind over 30 yrs
- Air quality 2/10 Low 0 unhealthy d/yr today · 1 by 30 yrs out
Nearby sold comps map
Loading sold comps map…
Walkable amenities ~0.75 mi
Loading nearby amenities…
Taxation est. · year 1
- Rental income
- $16,746
- − Mortgage interest
- −$8,358
- − Property taxes
- −$3,792
- − Insurance
- −$746
- − Repairs & maintenance
- −$1,340
- − Management
- −$1,340
- − Depreciation
- −$4,340
- Taxable loss
- −$3,169
- Est. tax savings @ 24.0%
- +$761
- After-tax cash flow
- $63/yr
For passive investors: Depreciation is non-cash, so a rental often shows a tax loss while cash-flowing — sheltering income. Rental losses are passive: they offset passive income freely, and up to $25,000/yr can offset ordinary (W-2) income if you actively participate and your MAGI is under $100k (phasing out to $0 by $150k); unused losses carry forward. On sale, claimed depreciation is recaptured at up to 25%, and gains may owe capital-gains tax (a 1031 exchange can defer both). Figures are a year-1 estimate at your 24.0% rate — not tax advice; consult a CPA.
Schools (NCES district)
- District
- Judson ISD
- NCES district ID
- 4824990
- Math proficiency
- 21% ▼ -21.00%
- Reading proficiency
- 33% ▼ -7.00%
- Median HH income
- $57,542
- Composite
- 24.39/100
- National rank
- #7689
- State rank
- #660 of 826 in TX
Livability — San Antonio
- Score
- 80/100
- State rank
- #31
- US rank
- #1616
Category grades
Schools grade is shown separately in the Schools card above.
Census & demographics
- Census place
- San Antonio, TX
- County
- Bexar County · 1,990,555 people
- City population
- 1,806,925
- Metro
- San Antonio-New Braunfels, TX
- Population (ZIP)
- 39,428
- Household income
- $57,285
- Rent vs Own
- Severe rent burden
- 2508.0
Population outlook (Bexar County) Hauer SSP2
- Today (2025)
- 2,336,851 people
- By 2030
- 2,560,728 · +9.6%
- By 2040
- 3,020,569 · +29.3%
- By 2050
- 3,493,522 · +49.5%
- By 2075
- 4,668,459 · +99.8%
- By 2100
- 5,533,242 · +136.8%
Race, ethnicity, and origin ACS 2023
- Neighborhood character
- Diverse neighborhood (Simpson 0.64)
- Race & ethnicity
- Hispanic / Latino 53% Two or more races 26% White 25% Black 14% Asian 3% Native American 2%
- Hispanic origin (detail)
- Mexican 41% Puerto Rican 3%
- Common ancestry
- Serbian 2% Italian 1% Romanian 1%
- Foreign-born
- 18% · Canada, Vietnam, China
- Languages at home
- 60% English-only · Spanish 34% Vietnamese 1% Other Asian/Pacific 1%
Political lean MEDSL · Bexar
- 2024 margin
- Lean D (+9.8) · D 54.3% · R 44.6% · Other 1.1%
- 2008→2024 swing
- +4.2pp toward D · 2008: 5.6pp · 2024: 9.8pp
- All cycles
- 2024: D+9.8 2020: D+18.2 2016: D+13.5 2012: D+4.6 2008: D+5.6
Not yet ingested
- Civics
- —
Market trends
- HPI YoY
- ▼ -52.17%
- Current HPI
- 271.2807
- Rent YoY
- ▼ -5.56%
- Metro
- San Antonio-New Braunfels, TX
- State GDP YoY
- ▲ 3.95%
- F500 in state
- 110
Industry mix (Fortune 500 HQ in TX)
| Industry | F500 HQs | Revenue |
|---|---|---|
| Energy | 16 | $1,198B |
|
||
| Technology | 5 | $198B |
|
||
| Engineering / Construction | 4 | $72B |
|
||
| Energy Services | 3 | $60B |
|
||
| Utilities | 3 | $41B |
|
||
| Healthcare | 2 | $330B |
|
||
Price history
-10.8% since first listed6 events — show timeline
- 2026-05-06 Price Changed $159,200 LERA
- 2026-04-16 Price Changed $1,250 APPFOLIO
- 2026-02-22 Listed for Rent $1,400 APPFOLIO
- 2025-11-17 Price Changed $170,500 LERA
- 2025-09-17 Listed $178,500 LERA
- 2003-01-06 Sold (Public Records) — Public Records
Property tax history
+14.6%/yrLatest (2025): $3,792 · +1.6% YoY. Source: county tax records.
Cash-flow waterfall
monthlySold comps — $/sqft
last 12 mo · ≤1 miLoading sold comps…