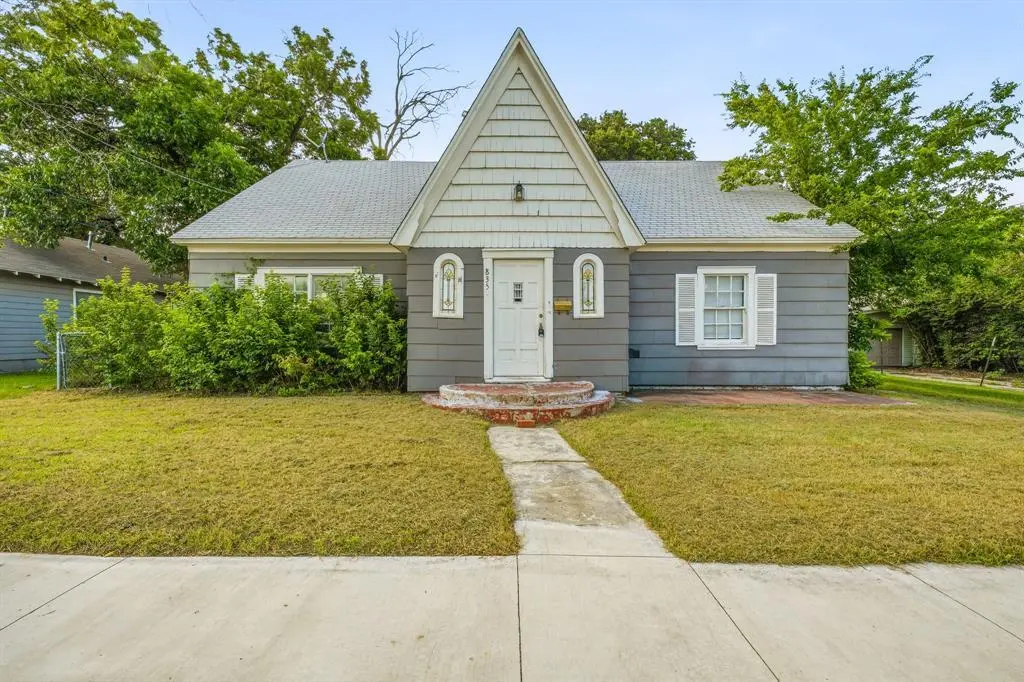
835 W Long St · Stephenville, TX
Flood risk 1/10 · Minimal
- FEMA flood zone
- X (unshaded)
- Chance of flooding over 30 yrs
- 0.0%
- Est. flood insurance / yr
- $507 – $1,088
Fire risk 7/10 · Major
- Est. fire insurance / yr
- $1,222 – $2,270
Heat risk 6/10 · Moderate
- Hot days now (above 105°F)
- 7 days/yr
- Hot days in 30 yrs
- 22 days/yr
Wind risk 6/10 · Moderate
- Chance of severe wind over 30 yrs
- 27.0%
Air-quality risk 1/10 · Minimal
- Unhealthy air days now
- 0 days/yr
- Unhealthy air days in 30 yrs
- 0 days/yr
Risk factors via First Street. Map © Google.
Why this score? — see what drove the C- grade
The composite is a weighted blend of 9 inputs, each scored 0–100. Each bar is that input's sub-score; the figure is the points it added to the 100-point composite (weight × sub-score).
- ARV discount +15.0/15.0
- Cash flow +14.2/30.0
- DSCR +4.3/10.0
- Schools +4.2/10.0
- 1% rule +4.1/10.0
- Livability +3.8/5.0
- Rent growth +2.5/5.0
- Condition / age +2.5/5.0
- Appreciation +0.0/10.0
$169,900
🖨 Deal sheet (PDF) 📄 Offer letter ✓ Due diligence
Listing remarks MLS
CHARMING VICTORIAN HOME W/ HARDWOOD FLOORS. CENTRAL HEAT & AIR. JUST THE RIGHT SIZE BREAKFAST NOOK IN KITCHEN & HAS BAY WINDOW EFFECT. NICE BACK YARD W/ LARGE TREES. SPACIOUS HOME. GARAGE APT. W/ SEPARATE KITCHEN (EFF. APT. ). WASHER/DRYER HOOK-UPS DOWNSTAIRS FOR THE APT.
Key facts
- Flexible floor plan
- Separate dining room
- Convenient location
Tags
Property features AI
Finance
- Financial info: Listing accepts Cash, Conventional, FHA, and VA financing; No second mortgage
- HOA & community: No association
Exterior
- Parking: 2 covered parking spaces; 2 carport spaces; Additional parking available; No garage spaces
- Security: Smoke detector(s)
- Utilities: City water; City sewer; Not in a municipal utility district
- Home design: Single family residence; Residential property; Not attached to another property; Built in 1930; One story
- Construction: Siding exterior; Composition roof; Pillar/post/pier foundation
- Exterior features: Patio; Chain link fencing; Few trees; Large backyard with grass; Interior lot; Guest house (accessory unit approx. 400 sq ft)
Interior
- Kitchen: Eat-in kitchen with built-in cabinets and solid surface counters; Dishwasher; Gas range; Refrigerator
- Bedrooms: Primary bedroom on level 1 (14 x 14); Second bedroom on level 1 (13 x 11)
- Flooring: Wood flooring; Other flooring types
- Bathrooms: One full bathroom (level 1) with built-in cabinets and medicine cabinet
- Heating & cooling: Central heating; Central air; Ceiling fan(s)
- Interior features: Open floorplan; Built-in features; Eat-in kitchen; Natural woodwork; Window coverings; One level; 8 total rooms; 1 living area; 2 dining areas
- Laundry & utility: Laundry room on level 1; Full-size washer/dryer area; Utility room
Neighborhood map
What this means for you Summary
Snapshot
- This is a 2-bed/1.0-bath single-family listed at $170k.
Deal economics
- At list price, monthly cash flow is $29 ($349/yr) — positive.
- The deal already cash-flows at list — no discount required.
- To meet the 1% rule (rent ≥ 1% of price), the offer needs to be $154k (9.4% below list).
- Recommended offer: $154k (9.4% below list) — sets the bar for 1% rule.
- Cap rate 6.5% vs local median 2.2% in Stephenville — top-decile yield for the area; either an underpriced asset or a hidden risk that comps aren't pricing in. Stress-test before assuming the spread holds.
Location & tenants
- Location reads 75/100 on livability (#124 in TX, #3,840 nationally) — a middle-class / working-renter tenant base. Strengths: cost of living A+, housing A+, health & safety A+; Watch: commute F, employment D-.
- Stephenville ISD (town): math 53% / reading 48% proficiency, ranked #191 of 826 in TX (top 23%) — acceptable for families but not a draw, mixed tenant base, ~2y average lease.
- Zoned schools: Central El (422 students, 64% FRL); Henderson J H (math 60% / reading 50%, grade B-, #248 of 1,662 statewide, top 15%, 551 students, 48% FRL); Stephenville H S (math 45% / reading 56%, grade D+, #492 of 1,632 statewide, top 30%, 1,127 students, 45% FRL).
- Market conditions: Rents flat; 384 active listings in the ZIP; 14 comparable units currently listed for rent nearby; rentals lingering (median 46d on market — plan ~5-8 weeks vacancy on turnover, expect pricing pressure); 100% of comp listings sitting > 30 days — soft ceiling on asking rent; 110 units permitted in Erath County in 2024 (61 in 5+ unit buildings).
- This rent runs 30% of the median local income ($61k/yr) — at the standard rent-burdened threshold; future hikes will face affordability resistance.
Forward outlook
- Local home prices are declining (-3.0%/yr); year-one equity from $1k of loan paydown is wiped out by about $5k of value loss. Plan a longer hold.
- Erath County population projected at +55% by 2050 — long-run rental-demand tailwind backs the buy-and-hold thesis.
Negotiation context
- Only 2 days on market — expect competitive offers; lowballing is unlikely to land.
- 2 sale attempts since 22y ago with the ask held roughly flat each time — persistent listings suggest the price (not the market) is what's stuck; bring a comps-based counter.
Risks & watch-outs
- Watch-outs: built in 1930 — expect roof / HVAC / electrical / plumbing capex.
- Climate carrying-cost: major wind risk, 27% chance of damaging wind over 30y; major wildfire risk; extreme-heat days projected 7→22/yr by 2055 (HVAC capex compounding) — expect insurance premiums to compound above CPI over the hold.
Questions for the listing agent
- Built in 1930 — when were the roof, HVAC, electrical panel, plumbing, and water heater last replaced?
- Is there a deadline driving the sale (1031 exchange, divorce, estate, relocation)? That informs how much negotiation room exists.
- What's the average days-on-market for RENTAL listings here right now (not sales)? A rising rental-DOM trend means longer vacancies and softer asking-rent achievability than the comps imply.
- What's the recent tenant-quality profile in this submarket — average credit score on applications, eviction rate, late-payment / NSF rate, and stable-employment percentage? A property-management company in the area should have these aggregated.
- How much new for-sale + rental construction is in the pipeline within 1–3 miles? Heavy new supply typically softens prices + rents 12–24 months out; constrained supply supports both.
Investment metrics
- 1% rule
- 0.91% ✗
- Cap rate
- 6.50%
- Cash-on-cash
- 0.73%
- DSCR
- 1.03
- GRM
- 9.2
CMA / ARV
- ARV (on-the-fly)
- $261,002
- Comps found
- 12
Show comp detail 12 sales within ~0.75 mi
| Address | Dist | Beds/Ba | Sqft | Sold | Price | $/sf | Match |
|---|---|---|---|---|---|---|---|
| 321 S Columbia St | 0.31mi | 2/1.0 | 1,310 (-9%) | 2mo | $499,900 | $382 | 68 |
| 1043 W Green St | 0.30mi | 3/2.0 (+1) | 1,484 (+3%) | 6mo | $375,000 | $253 | 67 |
| 608 N Belknap Ave | 0.52mi | 2/2.0 | 1,304 (-10%) | 2mo | $320,000 | $245 | 54 |
| 819 Paddock St | 0.62mi | 3/2.0 (+1) | 1,372 (-5%) | 2mo | $189,000 | $138 | 53 |
| 625 S Lillian St | 0.62mi | 2/2.0 | 1,346 (-7%) | 5mo | $222,000 | $165 | 52 |
| 835 W Vanderbilt St | 0.42mi | 3/1.5 (+1) | 1,268 (-12%) | 5mo | $125,000 | $99 | 49 |
| 960 N Stephen Ave | 0.70mi | 3/2.0 (+1) | 1,366 (-5%) | 1mo | $249,000 | $182 | 49 |
| 265 W Shirley St | 0.69mi | 3/1.0 (+1) | 1,296 (-10%) | 1mo | $157,000 | $121 | 45 |
| 1211 W Cage St | 0.43mi | 3/2.0 (+1) | 1,240 (-14%) | 3mo | $225,000 | $181 | 45 |
| 210 W Frey St | 0.73mi | 3/2.0 (+1) | 1,359 (-6%) | 3mo | $195,500 | $144 | 45 |
| 695 S Lillian St | 0.63mi | 3/2.0 (+1) | 1,304 (-10%) | 5mo | $200,000 | $153 | 41 |
| 955 N Mccart St | 0.70mi | 3/2.0 (+1) | 1,544 (+7%) | 7mo | $337,500 | $219 | 41 |
Match score weights: distance 35% · size 25% · config 20% · recency 20%. Top-matched comps best support the ARV.
Projected returns pro-forma
-3.0% appreciation · 0.07% rent growth · sell at horizon
- IRR
- -18.5%
- Equity multiple
- 0.37×
- Total profit
- $-30,061
- Equity at exit
- $25,333
- IRR
- -18.2%
- Equity multiple
- 0.14×
- Total profit
- $-40,737
- Equity at exit
- $14,690
Cash invested: $47,572 (down + closing). Projections, not guarantees.
Landlord ↔ Tenant lean methodology
- Overall (STATE)
- 87 Strongly Landlord-Friendly
- State Texas
- 87 Strongly Landlord-Friendly · R+5
- County
- — inherits STATE
- City
- — inherits STATE
ZIP-level market 76401
- Rents YoY
- 0.1%
- Active inventory
- 384
- Price-to-rent
- 9.2×
Monthly cashflow live
- Estimated rent
- $1,540 high interval (Pro) →
- Mortgage (P&I)
- −$891
- Tax from tax record
- −$226 /mo · $2,710/yr
- Insurance
- −$71
- HOA
- −$0
- Vacancy / Maint / Mgmt
- −$323
- Net cashflow
- $29
Break-even live
Sensitivity live
| Price | -10% $125 | -5% $77 | +0% $29 | +5% $-19 | +10% $-67 |
|---|---|---|---|---|---|
| Rent | -10% $-93 | -5% $-32 | +0% $29 | +5% $90 | +10% $151 |
| Rate | -1.0pp $115 | -0.5pp $72 | base $29 | +0.5pp $-15 | +1.0pp $-60 |
UW: 25.0% down · 7.5% · 30yr · 1.5% tax · 5.0% vac · 8.0% maint · 8.0% mgmt
Financing live
Cash to close
- Down payment
- $42,475
- Closing costs
- $5,097
- Reserves months
- —
- Total cash needed
- —
Loan-product check · same deal, 3 products live
Conventional
25% down · 7.5% · 30yr
- Down + closing
- —
- Monthly P&I
- —
- Monthly cashflow
- —
- DSCR
- —
- Eligible?
- —
Personal DTI + credit; lowest rate.
DSCR
20% down · 8.5% · 30yr
- Down + closing
- —
- Monthly P&I
- —
- Monthly cashflow
- —
- DSCR
- —
- Eligible?
- —
No personal income docs; deal must DSCR.
Hard money
10% down · 12.0% · 12mo
- Down + closing
- —
- Monthly P&I
- —
- Monthly cashflow
- —
- DSCR
- —
- Eligible?
- —
Short-term bridge; refi at stabilization.
Rent comps 14 comps
| Address | Beds | Baths | Sqft | Rent | $/sqft | DOM | Units | Dist |
|---|---|---|---|---|---|---|---|---|
| 1026 W Tarleton St Apt 102 Stephenville, TX | 2.0 | 2.0 | 1000 | $1,500 | $1.50 | 45d | 1 | 0.30mi |
| 504 S 1st Ave Unit 1 Stephenville, TX | 3.0 | 1.5 | 1100 | $1,250 | $1.14 | 45d | 1 | 0.34mi |
| 290 S McIlhaney St Unit 1102 Stephenville, TX | 3.0 | 3.0 | 1223 | $775 | $0.63 | 45d | 1 | 0.35mi |
| 561 S Second Ave Stephenville, TX | 3.0 | 3.0 | 1500 | $750 | $0.50 | 45d | 1 | 0.39mi |
| 1321 W Swan St Stephenville, TX | 2.0 | 2.0 | 1000 | $1,100 | $1.10 | 45d | 1 | 0.43mi |
| 1361 W McNeill St Stephenville, TX | 3.0 | 1.0 | 1200 | $1,495 | $1.25 | 45d | 1 | 0.46mi |
| 1435 W McNeill St Stephenville, TX | 2.0 | 1.0 | 1120 | $1,500 | $1.34 | 45d | 1 | 0.50mi |
| 791 N Clinton St Stephenville, TX | 2.0 | 1.5 | 1160 | $1,800 | $1.55 | 45d | 1 | 0.59mi |
| 701 S Lillian St Stephenville, TX | 3.0 | 3.0 | 1375 | $695 | $0.51 | 45d | 1 | 0.63mi |
| 949 S Lillian St Stephenville, TX | 1.0–2.0 | 1.0–1.5 | 709 | $952 | $1.34 | 45d | 19 | 0.68mi |
| 402 Garrett Ct Stephenville, TX | 3.0 | 3.0 | 1300 | $750 | $0.58 | 45d | 1 | 0.70mi |
| 794 W Pecan St Unit 101 Stephenville, TX | 3.0 | 2.5 | 1540 | $2,200 | $1.43 | 45d | 1 | 0.74mi |
| 508 Galt Dr Stephenville, TX | 3.0 | 2.5 | 1544 | $2,200 | $1.42 | 45d | 1 | 0.86mi |
| 1713 Bingham St Stephenville, TX | 3.0 | 1.0 | 1218 | $1,750 | $1.44 | 45d | 1 | 1.08mi |
Listing history 3 events
-
2026-06-14statusdays on market $169,900 Pending 2 DOM
-
2026-06-12remarks 658-char remark
-
2026-06-12$169,900 Active 1 DOM
ⓘ Source: listings_history table (triggers on properties + properties_extension) + one-shot
backfill from property_details.listing_events for pre-trigger history.
Tax reassessment forecast TX · Resets to sale price
- Current annual tax
- $2,710 · $226/mo
- Projected year-2 tax
- $3,109 · $259/mo
- Expected delta
- +$399/yr (+$33/mo · 14.7%)
ⓘ Screening estimate from a state-policy table — verify with the county assessor before closing.
Climate risk First Street
- Flood 1/10 Low FEMA zone X (unshaded) · 0% chance over 30 yrs
- Wildfire 7/10 Severe
- Heat 6/10 Major 7 d/yr ≥105°F today · 22 d/yr by 30 yrs out
- Wind 6/10 Major 27% chance of damaging wind over 30 yrs
- Air quality 1/10 Low 0 unhealthy d/yr today · 0 by 30 yrs out
Nearby sold comps map
Loading sold comps map…
Walkable amenities ~0.75 mi
Loading nearby amenities…
Taxation est. · year 1
- Rental income
- $18,481
- − Mortgage interest
- −$9,517
- − Property taxes
- −$2,710
- − Insurance
- −$850
- − Repairs & maintenance
- −$1,478
- − Management
- −$1,478
- − Depreciation
- −$4,943
- Taxable loss
- −$2,495
- Est. tax savings @ 24.0%
- +$599
- After-tax cash flow
- $947/yr
For passive investors: Depreciation is non-cash, so a rental often shows a tax loss while cash-flowing — sheltering income. Rental losses are passive: they offset passive income freely, and up to $25,000/yr can offset ordinary (W-2) income if you actively participate and your MAGI is under $100k (phasing out to $0 by $150k); unused losses carry forward. On sale, claimed depreciation is recaptured at up to 25%, and gains may owe capital-gains tax (a 1031 exchange can defer both). Figures are a year-1 estimate at your 24.0% rate — not tax advice; consult a CPA.
Schools (NCES district)
- District
- Stephenville ISD
- NCES district ID
- 4841520
- Math proficiency
- 53% ▼ -1.00%
- Reading proficiency
- 48% ▼ -4.00%
- Median HH income
- $39,565
- Composite
- 42.23/100
- National rank
- #3283
- State rank
- #191 of 826 in TX
Livability — Stephenville
- Score
- 75/100
- State rank
- #124
- US rank
- #3840
Category grades
Schools grade is shown separately in the Schools card above.
Census & demographics
- Census place
- Stephenville, TX
- County
- Erath County · 31,375 people
- City population
- 31,375
- Metro
- Stephenville, TX
- Population (ZIP)
- 31,375
- Household income
- $61,210
- Rent vs Own
- Severe rent burden
- 1758.0
Population outlook (Erath County) Hauer SSP2
- Today (2025)
- 50,437 people
- By 2030
- 55,510 · +10.1%
- By 2040
- 66,379 · +31.6%
- By 2050
- 77,981 · +54.6%
- By 2075
- 109,727 · +117.6%
- By 2100
- 132,574 · +162.9%
Race, ethnicity, and origin ACS 2023
- Neighborhood character
- Predominantly White (76%)
- Race & ethnicity
- White 76% Hispanic / Latino 18% Two or more races 8% Black 2% Asian 1%
- Hispanic origin (detail)
- Mexican 15%
- Common ancestry
- Slovak 2% Italian 1% Serbian 1%
- Foreign-born
- 5% · Canada, China
- Languages at home
- 88% English-only · Spanish 10% Chinese 1%
Political lean MEDSL · Erath
- 2024 margin
- Solid R (+68.0) · D 15.7% · R 83.7%
- 2008→2024 swing
- -13.5pp toward R · 2008: -54.5pp · 2024: -68.0pp
- All cycles
- 2024: R+68.0 2020: R+63.9 2016: R+65.5 2012: R+67.1 2008: R+54.5
Not yet ingested
- Civics
- —
Market trends
- HPI YoY
- ▼ -133.71%
- Current HPI
- 234.4986
- Rent YoY
- ▲ 0.07%
- Metro
- Stephenville, TX
- State GDP YoY
- ▲ 3.95%
- F500 in state
- 110
Industry mix (Fortune 500 HQ in TX)
| Industry | F500 HQs | Revenue |
|---|---|---|
| Energy | 16 | $1,198B |
|
||
| Technology | 5 | $198B |
|
||
| Engineering / Construction | 4 | $72B |
|
||
| Energy Services | 3 | $60B |
|
||
| Utilities | 3 | $41B |
|
||
| Healthcare | 2 | $330B |
|
||
Price history
+122.1% since first listed9 events — show timeline
- 2026-06-11 Listed $169,900 NTREIS
- 2005-01-28 Sold (MLS) — NTREIS
- 2005-01-25 Sold (Public Records) — Public Records
- 2004-12-29 Listing Removed — NTREIS
- 2004-09-14 Listed $76,500 NTREIS
- 2001-07-27 Sold (Public Records) — Public Records
- 2001-01-19 Sold (Public Records) — Public Records
- 2000-04-11 Sold (Public Records) — Public Records
- 1996-07-23 Sold (Public Records) — Public Records
Property tax history
+3.6%/yrLatest (2025): $2,710 · -3.8% YoY. Source: county tax records.
Cash-flow waterfall
monthlySold comps — $/sqft
last 12 mo · ≤1 miLoading sold comps…