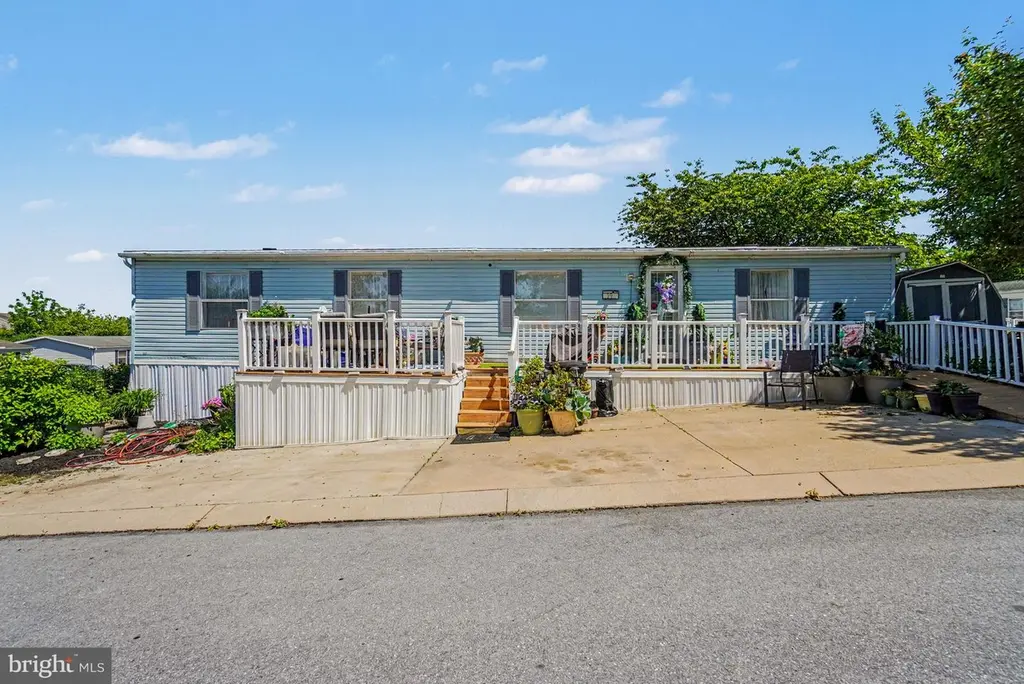
29 Katherine Ave · Lebanon South, PA
Flood risk 1/10 · Minimal
- FEMA flood zone
- X (unshaded)
- Chance of flooding over 30 yrs
- 0.0%
- Est. flood insurance / yr
- $507 – $1,088
Fire risk 1/10 · Minimal
- Est. fire insurance / yr
- $511 – $949
Heat risk 5/10 · Moderate
- Hot days now (above 99°F)
- 7 days/yr
- Hot days in 30 yrs
- 16 days/yr
Wind risk 4/10 · Minor
- Chance of severe wind over 30 yrs
- 11.0%
Air-quality risk 3/10 · Minor
- Unhealthy air days now
- 3 days/yr
- Unhealthy air days in 30 yrs
- 4 days/yr
Risk factors via First Street. Map © Google.
Why this score? — see what drove the B grade
The composite is a weighted blend of 9 inputs, each scored 0–100. Each bar is that input's sub-score; the figure is the points it added to the 100-point composite (weight × sub-score).
- Cash flow +30.0/30.0
- 1% rule +10.0/10.0
- DSCR +10.0/10.0
- ARV discount +7.5/15.0
- Schools +4.1/10.0
- Livability +3.6/5.0
- Rent growth +3.4/5.0
- Condition / age +2.5/5.0
- Appreciation +0.0/10.0
$115,000
🖨 Deal sheet 📄 Offer letter ✓ Due diligence
Listing remarks MLS
Sometimes a penny just needs some polish and a little effort to shine like new again. Save many pennies with this 3 BR / 2 BA home that just needs a little TLC. Nestled on a beautiful corner lot in 55+ Sycamore Park this double wide offers a huge master BR suite, cathedral ceiling, kitchen w/ breakfast bar, deck, shed, gas heat, newer roof, and off-st parking. Lot rent $330 & incl trash & lawn. Priced way below the others, make this your home!
Key facts
- Cozy breakfast nook
- Split-floor plan
- Cathedral ceilings
Tags
Property features AI
Finance
- Other: Not in a federal flood zone; Pets allowed with breed restrictions and number limits
- Financial info: Annual ground rent listed as an income/expense item
- HOA & community: Senior community (55+); Ground rent of $401 paid monthly; Rented lot
Exterior
- Parking: Two off-street parking spaces via concrete driveway; Total of 2 garage/parking spaces
- Utilities: Public water; Public sewer; Electric-powered cooling and hot water; Natural gas heating
- Home design: Manufactured home (double wide); Located on a corner lot; Senior community with 55+ age requirement
- Construction: Vinyl siding; Shingle roof; Estimated year built
- Exterior features: Deck(s); Rented lot in a community (ground rent applies); Shed; Located in Sycamore Park
Interior
- Kitchen: Electric oven/range; Refrigerator; Dishwasher not listed
- Bedrooms: Three bedrooms on the main level
- Bathrooms: Two full bathrooms on the main level
- Heating & cooling: Forced air heating (natural gas); Central air conditioning; 200+ amp electrical service
- Interior features: Cathedral ceilings; No basement; Property in good condition; Property managed by on-site/third-party property manager
- Laundry & utility: Washer and dryer located on the main floor; Electric water heater
Neighborhood map
What this means for you Summary
Snapshot
- This is a 3-bed/2.0-bath manufactured listed at $115k.
Deal economics
- At list price, monthly cash flow is $772 ($9k/yr) — positive.
- The deal already cash-flows at list — no discount required.
- Meets the 1% rule at list price ($2k rent vs $115k).
- Recommended offer: $113k (1.5% below list) — sets the bar for market timing.
Location & tenants
- Location reads 71/100 on livability (#700 in PA) — a middle-class / working-renter tenant base. Strengths: crime A+, cost of living A+, housing A+; Watch: employment D+, amenities F, commute F.
- Cornwall-Lebanon SD (suburban): math 37% / reading 56% proficiency, ranked #219 of 539 in PA (top 41%) — families likely to look elsewhere, expect single-tenant / working-renter base with shorter leases.
- Zoned schools: Cedar Crest Hs (math 77% / reading 34%, grade C, #93 of 437 statewide, top 22%, 1,633 students, 34% FRL).
- Market conditions: Rents rising (+3.5%/yr); 264 active listings in the ZIP; 3 comparable units currently listed for rent nearby; rentals lingering (median 44d on market — plan ~5-8 weeks vacancy on turnover, expect pricing pressure); 67% of comp listings sitting > 30 days — soft ceiling on asking rent; 315 units permitted in Lebanon County in 2024 (36 in 5+ unit buildings).
- This rent runs 31% of the median local income ($75k/yr) — at the standard rent-burdened threshold; future hikes will face affordability resistance.
Forward outlook
- Local home prices are declining (-3.0%/yr); year-one equity from $795 of loan paydown is wiped out by about $3k of value loss. Plan a longer hold.
- Lebanon County population projected at +10% by 2050 — modest demand growth; plan on rents tracking national, not racing it.
- At projected returns (-3.0% appreciation + 3.5% rent growth), your $32k cash investment doubles in ~5 years — after that, you're playing with house money.
Negotiation context
- It's been on market 16 days — a 2% lower offer ($113k) is reasonable based on typical stale-listing flexibility.
- 4 sale attempts since 26y ago with the ask held roughly flat each time — persistent listings suggest the price (not the market) is what's stuck; bring a comps-based counter.
- Current owner paid $8k; list at $115k implies a 1433% gain — meaningful room to come down on a strong offer.
Risks & watch-outs
- Climate carrying-cost: extreme-heat days projected 7→16/yr by 2055 (HVAC capex compounding) — expect insurance premiums to compound above CPI over the hold.
Questions for the listing agent
- Is there a deadline driving the sale (1031 exchange, divorce, estate, relocation)? That informs how much negotiation room exists.
- Schools are D-rated, which usually means shorter tenancies and higher turnover. Who's the typical renter profile here, and what's been the actual vacancy rate?
- What's the average days-on-market for RENTAL listings here right now (not sales)? A rising rental-DOM trend means longer vacancies and softer asking-rent achievability than the comps imply.
- What's the recent tenant-quality profile in this submarket — average credit score on applications, eviction rate, late-payment / NSF rate, and stable-employment percentage? A property-management company in the area should have these aggregated.
- How much new for-sale + rental construction is in the pipeline within 1–3 miles? Heavy new supply typically softens prices + rents 12–24 months out; constrained supply supports both.
Investment metrics
- 1% rule
- 1.67% ✓
- Cap rate
- 14.35%
- Cash-on-cash
- 28.78%
- DSCR
- 2.28
- GRM
- 5.0
CMA / ARV
No comps found within radius.
Projected returns pro-forma
-3.0% appreciation · 3.53% rent growth · sell at horizon
- IRR
- 23.7%
- Equity multiple
- 1.98×
- Total profit
- $31,581
- Equity at exit
- $17,147
- IRR
- 31.9%
- Equity multiple
- 3.95×
- Total profit
- $95,093
- Equity at exit
- $9,943
Cash invested: $32,200 (down + closing). Projections, not guarantees.
Landlord ↔ Tenant lean methodology
- Overall (STATE)
- 62 Landlord-Friendly
- State Pennsylvania
- 62 Landlord-Friendly · EVEN
- County
- — inherits STATE
- City
- — inherits STATE
ZIP-level market 17042
- Rents YoY
- 3.5%
- Active inventory
- 264
- Price-to-rent
- 5.0×
Monthly cashflow live
- Estimated rent
- $1,918 medium interval (Pro) →
- Mortgage (P&I)
- −$603
- Tax from tax record
- −$92 /mo · $1,103/yr
- Insurance
- −$48
- HOA
- −$0
- Vacancy / Maint / Mgmt
- −$403
- Net cashflow
- $772
Break-even live
UW: 25.0% down · 7.5% · 30yr · 1.5% tax · 5.0% vac · 8.0% maint · 8.0% mgmt
Financing live
Cash to close
- Down payment
- $28,750
- Closing costs
- $3,450
- Reserves months
- —
- Total cash needed
- —
Loan-product check · same deal, 3 products live
Conventional
25% down · 7.5% · 30yr
- Down + closing
- —
- Monthly P&I
- —
- Monthly cashflow
- —
- DSCR
- —
- Eligible?
- —
Personal DTI + credit; lowest rate.
DSCR
20% down · 8.5% · 30yr
- Down + closing
- —
- Monthly P&I
- —
- Monthly cashflow
- —
- DSCR
- —
- Eligible?
- —
No personal income docs; deal must DSCR.
Hard money
10% down · 12.0% · 12mo
- Down + closing
- —
- Monthly P&I
- —
- Monthly cashflow
- —
- DSCR
- —
- Eligible?
- —
Short-term bridge; refi at stabilization.
Rent comps 3 comps
| Address | Beds | Baths | Sqft | Rent | $/sqft | DOM | Units | Dist |
|---|---|---|---|---|---|---|---|---|
| 1211 Heritage Ln Unit 141 Lebanon, PA | 2.0 | 1.0 | 1050 | $1,350 | $1.29 | 44d | 1 | 0.96mi |
| 1207 Colony Ct Unit 122 Lebanon, PA | 3.0 | 2.0 | 1250 | $1,825 | $1.46 | 44d | 1 | 1.00mi |
| 410 Springwood Dr Lebanon, PA | 3.0 | 1.0–2.0 | 897 | $2,900 | $3.23 | 14d | 118 | 1.21mi |
Listing history 13 events
-
2026-06-19days on market $115,000 Active 16 DOM
-
2026-06-18days on market $115,000 Active 15 DOM
-
2026-06-17days on market $115,000 Active 14 DOM
-
2026-06-16days on market $115,000 Active 13 DOM
-
2026-06-15days on market $115,000 Active 12 DOM
-
2026-06-14days on market $115,000 Active 10 DOM
-
2026-06-13days on market $115,000 Active 9 DOM
-
2026-06-10days on market $115,000 Active 7 DOM
-
2026-06-09days on market $115,000 Active 6 DOM
-
2026-06-08days on market $115,000 Active 5 DOM
-
2026-06-07days on market $115,000 Active 4 DOM
-
2026-06-03remarks 699-char remark
-
2026-06-03$115,000 Active 1 DOM
ⓘ Source: listings_history table (triggers on properties + properties_extension) + one-shot
backfill from property_details.listing_events for pre-trigger history.
Tax reassessment forecast PA · Partial reset (capped growth)
- Current annual tax
- $1,103 · $92/mo
- Projected year-2 tax
- $1,460 · $122/mo
- Expected delta
- +$357/yr (+$30/mo · 32.4%)
ⓘ Screening estimate from a state-policy table — verify with the county assessor before closing.
Climate risk First Street
- Flood 1/10 Low FEMA zone X (unshaded) · 0% chance over 30 yrs
- Wildfire 1/10 Low
- Heat 5/10 Major 7 d/yr ≥99°F today · 16 d/yr by 30 yrs out
- Wind 4/10 Moderate 11% chance of damaging wind over 30 yrs
- Air quality 3/10 Moderate 3 unhealthy d/yr today · 4 by 30 yrs out
Nearby sold comps map
Loading sold comps map…
Walkable amenities ~0.75 mi
Loading nearby amenities…
Taxation est. · year 1
- Rental income
- $23,016
- − Mortgage interest
- −$6,442
- − Property taxes
- −$1,103
- − Insurance
- −$575
- − Repairs & maintenance
- −$1,841
- − Management
- −$1,841
- − Depreciation
- −$3,345
- Taxable income
- $7,868
- Est. tax owed @ 24.0%
- −$1,888
- After-tax cash flow
- $7,380/yr
For passive investors: Depreciation is non-cash, so a rental often shows a tax loss while cash-flowing — sheltering income. Rental losses are passive: they offset passive income freely, and up to $25,000/yr can offset ordinary (W-2) income if you actively participate and your MAGI is under $100k (phasing out to $0 by $150k); unused losses carry forward. On sale, claimed depreciation is recaptured at up to 25%, and gains may owe capital-gains tax (a 1031 exchange can defer both). Figures are a year-1 estimate at your 24.0% rate — not tax advice; consult a CPA.
Schools (NCES district)
- District
- Cornwall-Lebanon SD
- NCES district ID
- 4206840
- Math proficiency
- 37% ▼ -15.00%
- Reading proficiency
- 56% ▼ -15.00%
- Median HH income
- $62,483
- Composite
- 41.0/100
- National rank
- #3589
- State rank
- #219 of 539 in PA
Livability — Lebanon South
- Score
- 71/100
- State rank
- #700
- US rank
- #6902
Category grades
Schools grade is shown separately in the Schools card above.
Census & demographics
- Census place
- Lebanon South, PA
- County
- Lebanon County · 95,836 people
- Metro
- Lebanon, PA
- Population (ZIP)
- 40,161
- Household income
- $74,831
- Rent vs Own
- Severe rent burden
- 801.0
Population outlook (Lebanon County) Hauer SSP2
- Today (2025)
- 144,806 people
- By 2030
- 147,534 · +1.9%
- By 2040
- 152,952 · +5.6%
- By 2050
- 159,406 · +10.1%
- By 2075
- 181,736 · +25.5%
- By 2100
- 198,402 · +37.0%
Race, ethnicity, and origin ACS 2023
- Neighborhood character
- Predominantly White (77%)
- Race & ethnicity
- White 77% Hispanic / Latino 16% Two or more races 8% Black 3% Asian 1%
- Hispanic origin (detail)
- Puerto Rican 12% Dominican 1%
- Common ancestry
- Romanian 2% Polish 2% Iranian 1%
- Foreign-born
- 3% · Canada
- Languages at home
- 87% English-only · Spanish 10% German/W. Germanic 1% Other Indo-European 1%
Political lean MEDSL · Lebanon
- 2024 margin
- Solid R (+32.0) · D 33.6% · R 65.5%
- 2008→2024 swing
- -13.1pp toward R · 2008: -18.9pp · 2024: -32.0pp
- All cycles
- 2024: R+32.0 2020: R+31.7 2016: R+35.5 2012: R+28.0 2008: R+18.9
Not yet ingested
- Civics
- —
Market trends
- HPI YoY
- ▼ -124.28%
- Current HPI
- 192.3643
- Rent YoY
- ▲ 3.53%
- Metro
- Lebanon, PA
- State GDP YoY
- ▲ 1.68%
- F500 in state
- 34
Industry mix (Fortune 500 HQ in PA)
| Industry | F500 HQs | Revenue |
|---|---|---|
| Healthcare | 2 | $309B |
|
||
| Insurance | 2 | $27B |
|
||
| Telecommunications / Media | 1 | $124B |
|
||
| Industrial Distribution | 1 | $22B |
|
||
| Financial Services | 1 | $20B |
|
||
| Chemicals / Materials | 1 | $18B |
|
||
Price history
+173.8% since first listed10 events — show timeline
- 2026-06-03 Listed $115,000 BRIGHT MLS
- 2014-11-05 Sold (MLS) $7,500 BRIGHT MLS
- 2014-11-01 Listing Removed — BRIGHT MLS
- 2014-07-23 Listed $9,999 BRIGHT MLS
- 2001-02-22 Sold (MLS) $42,000 BRIGHT MLS
- 2001-02-08 Listing Removed — BRIGHT MLS
- 2001-01-22 Listed $42,000 BRIGHT MLS
- 2000-10-31 Sold (MLS) $36,000 BRIGHT MLS
- 2000-09-25 Listing Removed — BRIGHT MLS
- 2000-08-01 Listed $42,000 BRIGHT MLS
Property tax history
+3.3%/yrLatest (2026): $1,103 · +4.2% YoY. Source: county tax records.
Cash-flow waterfall
monthlySold comps — $/sqft
last 12 mo · ≤1 miLoading sold comps…