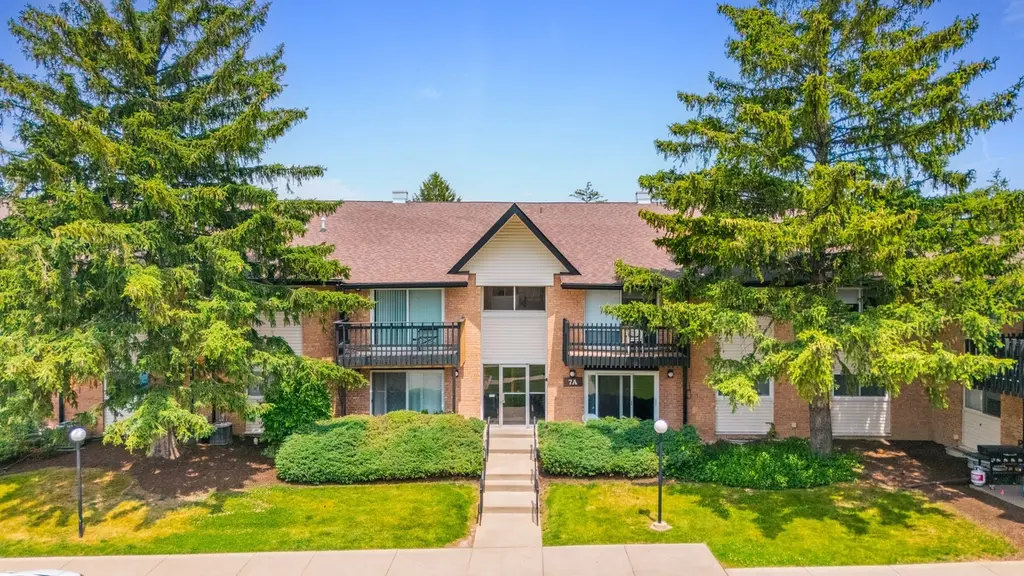
7A Kingery Quarter Ave #201 · Burr Ridge, IL
Flood risk 1/10 · Minimal
- FEMA flood zone
- X (unshaded)
- Chance of flooding over 30 yrs
- 0.0%
- Est. flood insurance / yr
- $507 – $1,088
Fire risk 2/10 · Minimal
- Est. fire insurance / yr
- $804 – $1,492
Heat risk 3/10 · Minor
- Hot days now (above 103°F)
- 7 days/yr
- Hot days in 30 yrs
- 15 days/yr
Wind risk 2/10 · Minimal
- Chance of severe wind over 30 yrs
- 0.0%
Air-quality risk 4/10 · Minor
- Unhealthy air days now
- 4 days/yr
- Unhealthy air days in 30 yrs
- 5 days/yr
Risk factors via First Street. Map © Google.
Why this score? — see what drove the C+ grade
The composite is a weighted blend of 9 inputs, each scored 0–100. Each bar is that input's sub-score; the figure is the points it added to the 100-point composite (weight × sub-score).
- Cash flow +21.4/30.0
- 1% rule +8.2/10.0
- ARV discount +7.5/15.0
- DSCR +6.8/10.0
- Schools +6.0/10.0
- Rent growth +3.8/5.0
- Livability +3.8/5.0
- Condition / age +2.5/5.0
- Appreciation +0.0/10.0
$209,999
🖨 Deal sheet 📄 Offer letter ✓ Due diligence
Listing remarks
Welcome to this beautifully updated, move-in ready 3-bedroom, 2-bath second-floor condo in desirable Hinsdale Point. Recent upgrades include new appliances, updated flooring in all bedrooms, and a brand-new furnace installed in 2025, offering both style and peace of mind. The unit features spacious living and dining areas, ample closet space, and convenient on-site laundry. Enjoy access to fantastic community amenities including a clubhouse, fitness center, outdoor pool, and private party room. Ideally located near walking trails, expressways, shopping, restaurants, and within a highly rated school district. A great opportunity to own a beautifully maintained condo in an unbeatable location
Key facts
- Fitness center
- Clubhouse
- Community amenities
Tags
Property features AI
Finance
- Other: Building contains 16 units
- Financial info: Special service area: No
- HOA & community: Monthly association fee of $497; Association covers heat, water, parking, insurance, clubhouse, exercise facilities, pool, lawn care, and snow removal; Pets allowed (cats and dogs permitted; max pet weight listed as 99 lbs)
Exterior
- Parking: Two parking spaces
- Utilities: Public water; Public sewer
- Home design: Attached single condo; Entry level: 2
- Construction: Brick construction; Estimated age: 41–50 years; Not rebuilt or rehabilitated
- Exterior features: Common lot/grounds; Directions: Clarendon Hills and Kingery Quarter
Interior
- Kitchen: Kitchen on main level (10 x 10)
- Bedrooms: Three bedrooms (including a main-level master bedroom with full bath); Bedroom 2 on main level (14 x 11); Bedroom 3 on main level (12 x 10)
- Bathrooms: Two full bathrooms
- Heating & cooling: Natural gas heating; Central air conditioning
- Interior features: Six total rooms
- Laundry & utility: Laundry room
Neighborhood map
What this means for you Summary
Snapshot
- This is a 3-bed/2.0-bath condo listed at $210k.
Deal economics
- At list price, monthly cash flow is $310 ($4k/yr) — positive.
- The deal already cash-flows at list — no discount required.
- Meets the 1% rule at list price ($3k rent vs $210k).
- Recommended offer: $207k (1.5% below list) — sets the bar for market timing.
- Cap rate 8.1% vs local median 1.4% in Burr Ridge — top-decile yield for the area; either an underpriced asset or a hidden risk that comps aren't pricing in. Stress-test before assuming the spread holds.
Location & tenants
- Location reads 76/100 on livability (#200 in IL, #3,725 nationally) — a middle-class / working-renter tenant base. Strengths: crime A+, employment A+, housing A; Watch: health & safety D+, amenities F, cost of living F.
- Hinsdale Twp Hsd 86 (suburban): math 62% / reading 64% proficiency, ranked #17 of 620 in IL (top 3%) — acceptable for families but not a draw, mixed tenant base, ~2y average lease.
- Market conditions: Rents rising fast (+5.3%/yr); 127 active listings in the ZIP; 1 comparable units currently listed for rent nearby; solid renter incomes; 1,378 units permitted in DuPage County in 2024 (594 in 5+ unit buildings).
- This rent runs 31% of the median local income ($107k/yr) — at the standard rent-burdened threshold; future hikes will face affordability resistance.
Forward outlook
- Local home prices are declining (-3.0%/yr); year-one equity from $1k of loan paydown is wiped out by about $6k of value loss. Plan a longer hold.
- At projected returns (-3.0% appreciation + 5.3% rent growth), your $59k cash investment doubles in ~10 years — after that, you're playing with house money.
Negotiation context
- It's been on market 17 days — a 2% lower offer ($207k) is reasonable based on typical stale-listing flexibility.
- 2 sale attempts; this cycle's ask has dropped $12k (5%) from the opening price — seller is motivated, your offer sets the floor, not the list.
Questions for the listing agent
- What does the HOA fee cover, when was the last increase, and are there any pending special assessments or reserve-fund shortfalls?
- Any open or pending special assessments — roof, HVAC, plumbing, elevator, façade? What's the per-unit balance and payoff schedule, and is the seller paying it off at close or rolling it to the buyer?
- Is there a deadline driving the sale (1031 exchange, divorce, estate, relocation)? That informs how much negotiation room exists.
- Schools are B-rated — typically a magnet for longer-tenancy family renters. What's the average tenant stay here, and is there a school-zone premium baked into asking?
- What's the average days-on-market for RENTAL listings here right now (not sales)? A rising rental-DOM trend means longer vacancies and softer asking-rent achievability than the comps imply.
- What's the recent tenant-quality profile in this submarket — average credit score on applications, eviction rate, late-payment / NSF rate, and stable-employment percentage? A property-management company in the area should have these aggregated.
- How much new apartment / multifamily construction is in the pipeline within 1–3 miles? Heavy new supply (>2% of stock underway) typically softens rents 12–24 months out; light construction supports rent growth.
Investment metrics
- 1% rule
- 1.32% ✓
- Cap rate
- 8.07%
- Cash-on-cash
- 6.33%
- DSCR
- 1.28
- GRM
- 6.3
CMA / ARV
No comps found within radius.
Projected returns pro-forma
-3.0% appreciation · 5.35% rent growth · sell at horizon
- IRR
- -3.2%
- Equity multiple
- 0.88×
- Total profit
- $-7,263
- Equity at exit
- $31,312
- IRR
- 9.6%
- Equity multiple
- 1.84×
- Total profit
- $49,230
- Equity at exit
- $18,157
Cash invested: $58,800 (down + closing). Projections, not guarantees.
Landlord ↔ Tenant lean methodology
- Overall (STATE)
- 43 Moderately Tenant-Leaning
- State Illinois
- 43 Moderately Tenant-Leaning · D+7
- County
- — inherits STATE
- City
- — inherits STATE
ZIP-level market 60527
- Rents YoY
- 5.3%
- Active inventory
- 127
- Price-to-rent
- 6.3×
Monthly cashflow live
- Estimated rent
- $2,771 medium interval (Pro) →
- Mortgage (P&I)
- −$1,101
- Tax from tax record
- −$194 /mo · $2,322/yr
- Insurance
- −$87
- HOA
- −$497
- Vacancy / Maint / Mgmt
- −$582
- Net cashflow
- $310
Break-even live
UW: 25.0% down · 7.5% · 30yr · 1.5% tax · 5.0% vac · 8.0% maint · 8.0% mgmt
Financing live
Cash to close
- Down payment
- $52,500
- Closing costs
- $6,300
- Reserves months
- —
- Total cash needed
- —
Loan-product check · same deal, 3 products live
Conventional
25% down · 7.5% · 30yr
- Down + closing
- —
- Monthly P&I
- —
- Monthly cashflow
- —
- DSCR
- —
- Eligible?
- —
Personal DTI + credit; lowest rate.
DSCR
20% down · 8.5% · 30yr
- Down + closing
- —
- Monthly P&I
- —
- Monthly cashflow
- —
- DSCR
- —
- Eligible?
- —
No personal income docs; deal must DSCR.
Hard money
10% down · 12.0% · 12mo
- Down + closing
- —
- Monthly P&I
- —
- Monthly cashflow
- —
- DSCR
- —
- Eligible?
- —
Short-term bridge; refi at stabilization.
Rent comps 1 comps
| Address | Beds | Baths | Sqft | Rent | $/sqft | DOM | Units | Dist |
|---|---|---|---|---|---|---|---|---|
| 8401 Meadowbrook Dr Burr Ridge, IL | 3.0 | 1.5 | 1190 | $3,600 | $3.03 | 1d | 1 | 1.28mi |
HOA detail condo
- Monthly dues
- $497 · $5,964/yr
- Likely covers
- poolgym
- Assessments
- None detected in remarks — confirm with the listing agent.
Listing history 20 events
-
2026-06-18days on market $209,999 Active 17 DOM
-
2026-06-17days on market $209,999 Active 16 DOM
-
2026-06-16days on market $209,999 Active 15 DOM
-
2026-06-15days on market $209,999 Active 14 DOM
-
2026-06-13days on market $209,999 Active 12 DOM
-
2026-06-13days on market $209,999 Active 11 DOM
-
2026-06-09days on market $209,999 Active 8 DOM
-
2026-06-08days on market $209,999 Active 7 DOM
-
2026-06-07days on market $209,999 Active 6 DOM
-
2026-06-04days on market $209,999 Active 3 DOM
-
2026-06-03days on market $209,999 Active 2 DOM
-
2026-06-02pricedays on market $209,999 Active 1 DOM
-
2026-06-01days on market $210,000 Active 42 DOM
-
2026-05-31days on market $210,000 Active 41 DOM
-
2026-05-15price $210,000
-
2026-04-20$221,900 Active
-
2026-04-20historical
-
2026-04-07Active
-
2024-09-06soldstatus $190,000
-
1998-02-03soldstatus $69,500
ⓘ Source: listings_history table (triggers on properties + properties_extension) + one-shot
backfill from property_details.listing_events for pre-trigger history.
Tax reassessment forecast IL · Partial reset (capped growth)
- Current annual tax
- $2,322 · $194/mo
- Projected year-2 tax
- $3,545 · $295/mo
- Expected delta
- +$1,222/yr (+$102/mo · 52.6%)
ⓘ Screening estimate from a state-policy table — verify with the county assessor before closing.
Climate risk First Street
- Flood 1/10 Low FEMA zone X (unshaded) · 0% chance over 30 yrs
- Wildfire 2/10 Low
- Heat 3/10 Moderate 7 d/yr ≥103°F today · 15 d/yr by 30 yrs out
- Wind 2/10 Low 0% chance of damaging wind over 30 yrs
- Air quality 4/10 Moderate 4 unhealthy d/yr today · 5 by 30 yrs out
Nearby sold comps map
Loading sold comps map…
Walkable amenities ~0.75 mi
Loading nearby amenities…
Taxation est. · year 1
- Rental income
- $33,257
- − Mortgage interest
- −$11,763
- − Property taxes
- −$2,322
- − Insurance
- −$1,050
- − Repairs & maintenance
- −$2,661
- − Management
- −$2,661
- − HOA
- −$5,964
- − Depreciation
- −$6,109
- Taxable income
- $728
- Est. tax owed @ 24.0%
- −$175
- After-tax cash flow
- $3,547/yr
For passive investors: Depreciation is non-cash, so a rental often shows a tax loss while cash-flowing — sheltering income. Rental losses are passive: they offset passive income freely, and up to $25,000/yr can offset ordinary (W-2) income if you actively participate and your MAGI is under $100k (phasing out to $0 by $150k); unused losses carry forward. On sale, claimed depreciation is recaptured at up to 25%, and gains may owe capital-gains tax (a 1031 exchange can defer both). Figures are a year-1 estimate at your 24.0% rate — not tax advice; consult a CPA.
Schools (NCES district)
- District
- Hinsdale Twp Hsd 86
- NCES district ID
- 1719320
- Math proficiency
- 62% ▼ -5.00%
- Reading proficiency
- 64% ▬ 0.00%
- Median HH income
- $118,692
- Composite
- 60.13/100
- National rank
- #868
- State rank
- #17 of 620 in IL
Livability — Burr Ridge
- Score
- 76/100
- State rank
- #200
- US rank
- #3725
Category grades
Schools grade is shown separately in the Schools card above.
Census & demographics
- County
- DuPage County · 904,569 people
- City population
- 29,024
- Metro
- Chicago-Naperville-Elgin, IL-IN-WI
- Population (ZIP)
- 29,028
- Household income
- $106,543
- Rent vs Own
- Severe rent burden
- 675.0
Population outlook (DuPage County) Hauer SSP2
- Today (2025)
- 960,187 people
- By 2030
- 965,850 · +0.6%
- By 2040
- 965,812 · +0.6%
- By 2050
- 954,890 · -0.6%
- By 2075
- 910,185 · -5.2%
- By 2100
- 816,255 · -15.0%
Race, ethnicity, and origin ACS 2023
- Neighborhood character
- Predominantly White (66%)
- Race & ethnicity
- White 66% Asian 13% Black 8% Hispanic / Latino 7% Two or more races 6%
- Hispanic origin (detail)
- Mexican 4%
- Common ancestry
- Romanian 12% Iranian 1% Slovak 1%
- Foreign-born
- 23% · Canada, China, Vietnam
- Languages at home
- 67% English-only · Other Indo-European 9% Russian/Polish/Slavic 9% Spanish 6%
Political lean MEDSL · DuPage
- 2024 margin
- D (+13.3) · D 55.9% · R 42.5% · Other 1.6%
- 2008→2024 swing
- +2.5pp toward D · 2008: 10.8pp · 2024: 13.3pp
- All cycles
- 2024: D+13.3 2020: D+18.1 2016: D+14.1 2012: D+1.0 2008: D+10.8
Not yet ingested
- Civics
- —
Market trends
- HPI YoY
- ▼ -171.58%
- Current HPI
- 184.6453
- Rent YoY
- ▲ 5.35%
- Metro
- Chicago-Naperville-Elgin, IL-IN-WI
- State GDP YoY
- ▲ 1.59%
- F500 in state
- 60
Industry mix (Fortune 500 HQ in IL)
| Industry | F500 HQs | Revenue |
|---|---|---|
| Insurance | 4 | $201B |
|
||
| Consumer Goods | 4 | $87B |
|
||
| Industrial Machinery | 3 | $64B |
|
||
| Healthcare | 2 | $55B |
|
||
| Retail / Pharmacy | 1 | $148B |
|
||
| Agriculture / Food | 1 | $86B |
|
||
Price history
+202.2% since first listed6 events — show timeline
- 2026-05-15 Price Changed $210,000 MRED as Distributed by MLS Grid
- 2026-04-20 Listing Removed — MRED as Distributed by MLS Grid
- 2026-04-20 Listed $221,900 MRED as Distributed by MLS Grid
- 2026-04-07 Listed — MRED as Distributed by MLS Grid
- 2024-09-06 Sold (Public Records) $190,000 Public Records
- 1998-02-03 Sold (Public Records) $69,500 Public Records
Property tax history
+1.5%/yrLatest (2024): $2,322 · +5.4% YoY. Source: county tax records.
Cash-flow waterfall
monthlySold comps — $/sqft
last 12 mo · ≤1 miLoading sold comps…