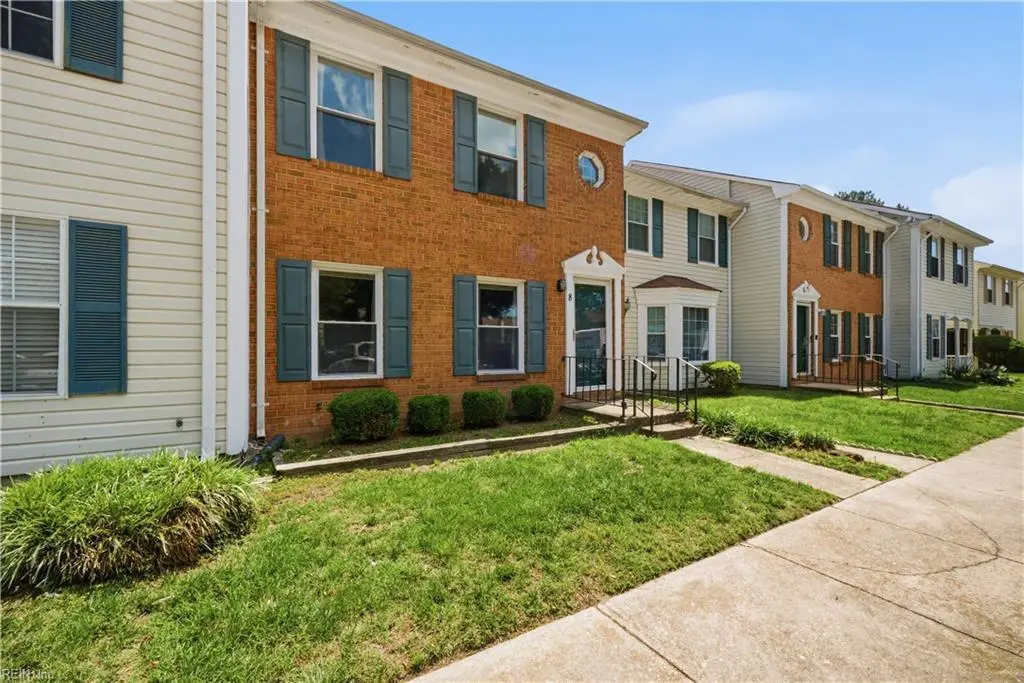
8 N Gawain Way · Hampton, VA
Flood risk 6/10 · Moderate
- FEMA flood zone
- X (shaded)
- Chance of flooding over 30 yrs
- 0.57%
- Est. flood insurance / yr
- $507 – $1,088
Fire risk 1/10 · Minimal
- Est. fire insurance / yr
- $666 – $1,236
Heat risk 9/10 · Severe
- Hot days now (above 104°F)
- 7 days/yr
- Hot days in 30 yrs
- 16 days/yr
Wind risk 8/10 · Major
- Chance of severe wind over 30 yrs
- 80.0%
Air-quality risk 2/10 · Minimal
- Unhealthy air days now
- 2 days/yr
- Unhealthy air days in 30 yrs
- 2 days/yr
Risk factors via First Street. Map © Google.
Why this score? — see what drove the D+ grade
The composite is a weighted blend of 9 inputs, each scored 0–100. Each bar is that input's sub-score; the figure is the points it added to the 100-point composite (weight × sub-score).
- ARV discount +15.0/15.0
- Cash flow +10.9/30.0
- Schools +5.5/10.0
- Rent growth +3.9/5.0
- Livability +3.8/5.0
- 1% rule +3.6/10.0
- DSCR +3.2/10.0
- Condition / age +2.5/5.0
- Appreciation +0.0/10.0
$207,000
🖨 Deal sheet 📄 Offer letter ✓ Due diligence
Listing remarks
Come visit this Charming Townhome - New Laminate Flooring. Freshly Painted. Wood Burning Fireplace in Den. Breakfast Nook. Open Living room & Dining room. The Backyard Is Perfect For Low-Maintenance Outdoor Living. This Home Presents a Fantastic Opportunity for All Buyers. Gated Community. Located near Langley Military Base, VA Hospital, Hampton University, Restaurants, Shopping, and Interstate. Call to Schedule a Showing! Don't Miss Out on Owning Your Own Home!
Key facts
- Breakfast nook
- Gated community
- $130 HOA
Tags
Property features AI
Finance
- HOA & community: Has HOA (Kings Square Homeowners Assoc); HOA/POA monthly fee $130; Ground maintenance included
Exterior
- Parking: Assigned/reserved parking
- Security: Gated community
- Utilities: City water; City sewer; Electric water heater
- Home design: Attached townhouse; Two stories; Simple ownership; City view
- Construction: Brick and vinyl siding; Asphalt shingle roof; Slab foundation
- Exterior features: Located on a cul-de-sac; Back and partial wood fencing; Fenced yard
Interior
- Kitchen: Electric range; Dishwasher; Refrigerator; Pantry; Breakfast area
- Bedrooms: Master bedroom with ensuite; Additional bedroom
- Flooring: Carpet; Laminate
- Bathrooms: Two full bathrooms; One half bathroom
- Heating & cooling: Heat pump; Central air
- Interior features: Ceiling fan; Cable hookup; Fireplace (wood-burning); Scuttle access; Walk-in closet; Window treatments
- Laundry & utility: Washer; Dryer; Utility room; Utility closet
Neighborhood map
What this means for you Summary
Snapshot
- This is a 3-bed/2.5-bath townhouse listed at $207k.
Deal economics
- At list price, monthly cash flow is $-91 ($-1k/yr) — negative.
- To cash-flow at today's rent, offer at most $191k (7.8% below list).
- To meet the 1% rule (rent ≥ 1% of price), the offer needs to be $178k (13.9% below list).
- Recommended offer: $178k (13.9% below list) — sets the bar for 1% rule.
- Cap rate 5.8% vs local median 4.5% in Hampton — meaningfully above typical; check what's discounted (condition, days-on-market, listing class) to confirm the premium yield is real.
Location & tenants
- Location reads 75/100 on livability (#133 in VA, #4,302 nationally) — a middle-class / working-renter tenant base. Strengths: housing A+, health & safety A+, cost of living A; Watch: crime C-, amenities D+, commute F.
- Hampton City Public School District (urban): math 60% / reading 70% proficiency, ranked #40 of 131 in VA (top 30%) — acceptable for families but not a draw, mixed tenant base, ~2y average lease.
- Zoned schools: Barron Elementary (math 62% / reading 77%, grade A-, #313 of 1,108 statewide, top 32%, 368 students, 87% FRL); Kecoughtan High (math 68% / reading 87%, grade A-, #83 of 319 statewide, top 28%, 1,564 students, 86% FRL) — zoned schools average 86% FRL vs 49% district-wide (38 pts higher); higher-poverty schools than district average — tighter screening recommended.
- Market conditions: Rents rising fast (+5.4%/yr); 232 active listings in the ZIP; 26 comparable units currently listed for rent nearby; rentals at typical pace (median 15d on market — plan ~3-4 weeks tenant-placement turnaround); 68 units permitted in Hampton city in 2024 (0 in 5+ unit buildings).
- This rent runs 30% of the median local income ($71k/yr) — at the standard rent-burdened threshold; future hikes will face affordability resistance.
Forward outlook
- Local home prices are declining (-3.0%/yr); year-one equity from $1k of loan paydown is wiped out by about $6k of value loss. Plan a longer hold.
- Hampton County population projected at -13% by 2050 — secular population decline; favor cash flow + early exit over multi-decade hold.
Negotiation context
- It's been on market 16 days — a 2% lower offer ($204k) is reasonable based on typical stale-listing flexibility.
- 2 sale attempts with the ask held roughly flat each time — persistent listings suggest the price (not the market) is what's stuck; bring a comps-based counter.
- Current owner paid $66k; list at $207k implies a 212% gain — meaningful room to come down on a strong offer.
Risks & watch-outs
- Climate carrying-cost: major flood risk; severe wind risk, 80% chance of damaging wind over 30y; extreme-heat days projected 7→16/yr by 2055 (HVAC capex compounding) — expect insurance premiums to compound above CPI over the hold.
Questions for the listing agent
- What do current leases actually rent for vs. the listed asking? Can we see a recent rent roll and the last 12 months of T-12 income?
- What does the HOA fee cover, when was the last increase, and are there any pending special assessments or reserve-fund shortfalls?
- Is there a deadline driving the sale (1031 exchange, divorce, estate, relocation)? That informs how much negotiation room exists.
- Schools are B-rated — typically a magnet for longer-tenancy family renters. What's the average tenant stay here, and is there a school-zone premium baked into asking?
- The area grade is low — what's the realistic commute time and amenity access for the typical tenant pool here? Any planned neighborhood developments (good or bad) we should know about?
- What's the average days-on-market for RENTAL listings here right now (not sales)? A rising rental-DOM trend means longer vacancies and softer asking-rent achievability than the comps imply.
- What's the recent tenant-quality profile in this submarket — average credit score on applications, eviction rate, late-payment / NSF rate, and stable-employment percentage? A property-management company in the area should have these aggregated.
- How much new for-sale + rental construction is in the pipeline within 1–3 miles? Heavy new supply typically softens prices + rents 12–24 months out; constrained supply supports both.
Investment metrics
- 1% rule
- 0.86% ✗
- Cap rate
- 5.77%
- Cash-on-cash
- -1.88%
- DSCR
- 0.92
- GRM
- 9.7
CMA / ARV
- ARV (on-the-fly)
- $261,340
- Comps found
- 9
Show comp detail 9 sales within ~0.75 mi
| Address | Dist | Beds/Ba | Sqft | Sold | Price | $/sf | Match |
|---|---|---|---|---|---|---|---|
| 8 Saxony Pl | 0.08mi | 3/2.5 | 1,460 (0%) | 2mo | $222,000 | $152 | 95 |
| 227 Dockside Dr Unit C | 0.45mi | 3/2.0 | 1,454 (-0%) | 3mo | $260,000 | $179 | 74 |
| 210 Dockside Dr Unit A | 0.49mi | 3/2.0 | 1,454 (-0%) | 4mo | $259,900 | $179 | 71 |
| 236 Dockside Dr Unit B | 0.47mi | 3/2.0 | 1,454 (-0%) | 8mo | $270,000 | $186 | 69 |
| 150 Eberly Ter | 0.34mi | 2/2.5 (-1) | 1,292 (-12%) | 6mo | $244,997 | $190 | 55 |
| 212 Dockside Dr Unit C | 0.49mi | 2/2.0 (-1) | 1,253 (-14%) | 0mo | $265,000 | $211 | 46 |
| 234 Dockside Dr Unit B | 0.47mi | 2/2.0 (-1) | 1,282 (-12%) | 13mo | $250,000 | $195 | 40 |
| 222 Dockside Dr Unit C | 0.49mi | 2/2.0 (-1) | 1,253 (-14%) | 14mo | $200,000 | $160 | 35 |
| 212 Dockside Dr Unit B | 0.49mi | 2/2.0 (-1) | 1,253 (-14%) | 22mo | $215,000 | $172 | 28 |
Match score weights: distance 35% · size 25% · config 20% · recency 20%. Top-matched comps best support the ARV.
Projected returns pro-forma
-3.0% appreciation · 5.44% rent growth · sell at horizon
- IRR
- -16.5%
- Equity multiple
- 0.40×
- Total profit
- $-34,778
- Equity at exit
- $30,864
- IRR
- -4.3%
- Equity multiple
- 0.69×
- Total profit
- $-18,116
- Equity at exit
- $17,898
Cash invested: $57,960 (down + closing). Projections, not guarantees.
Landlord ↔ Tenant lean methodology
- Overall (STATE)
- 55 Moderately Landlord-Leaning
- State Virginia
- 55 Moderately Landlord-Leaning · D+2
- County
- — inherits STATE
- City
- — inherits STATE
ZIP-level market 23669
- Rents YoY
- 5.4%
- Active inventory
- 232
- Price-to-rent
- 9.7×
Monthly cashflow live
- Estimated rent
- $1,783 high interval (Pro) →
- Mortgage (P&I)
- −$1,086
- Tax from tax record
- −$197 /mo · $2,369/yr
- Insurance
- −$86
- HOA
- −$130
- Vacancy / Maint / Mgmt
- −$374
- Net cashflow
- $-91
Break-even live
UW: 25.0% down · 7.5% · 30yr · 1.5% tax · 5.0% vac · 8.0% maint · 8.0% mgmt
Financing live
Cash to close
- Down payment
- $51,750
- Closing costs
- $6,210
- Reserves months
- —
- Total cash needed
- —
Loan-product check · same deal, 3 products live
Conventional
25% down · 7.5% · 30yr
- Down + closing
- —
- Monthly P&I
- —
- Monthly cashflow
- —
- DSCR
- —
- Eligible?
- —
Personal DTI + credit; lowest rate.
DSCR
20% down · 8.5% · 30yr
- Down + closing
- —
- Monthly P&I
- —
- Monthly cashflow
- —
- DSCR
- —
- Eligible?
- —
No personal income docs; deal must DSCR.
Hard money
10% down · 12.0% · 12mo
- Down + closing
- —
- Monthly P&I
- —
- Monthly cashflow
- —
- DSCR
- —
- Eligible?
- —
Short-term bridge; refi at stabilization.
Rent comps 26 comps
| Address | Beds | Baths | Sqft | Rent | $/sqft | DOM | Units | Dist |
|---|---|---|---|---|---|---|---|---|
| 17 S Gawain Way Hampton, VA | 3.0 | 1.5 | 1460 | $1,895 | $1.30 | 2d | 1 | 0.06mi |
| 31 Saxony Pl Hampton, VA | 3.0 | 2.5 | 1315 | $1,645 | $1.25 | 17d | 1 | 0.09mi |
| 8 Rip Rap Rd Hampton, VA | 2.0 | 1.0 | 1000 | $1,200 | $1.20 | 21d | 1 | 0.18mi |
| 19 Bernard Ave Hampton, VA | 2.0 | 1.0 | 906 | $995 | $1.10 | 21d | 1 | 0.22mi |
| 1105 Easterly Ave Hampton, VA | 3.0 | 1.5 | 1204 | $1,800 | $1.50 | 14d | 1 | 0.28mi |
| 28 Monroe Dr Hampton, VA | 3.0 | 1.0 | 1110 | $1,600 | $1.44 | 43d | 1 | 0.33mi |
| 100 Spanish Trl Hampton, VA | 1.0–2.0 | 1.0–1.5 | 812 | $1,450 | $1.79 | 1d | 12 | 0.35mi |
| 212 Dockside Dr Unit B Hampton, VA | 2.0 | 2.0 | 1253 | $1,795 | $1.43 | 43d | 1 | 0.50mi |
| 24 Cavalier Rd Hampton, VA | 3.0 | 2.0 | 1014 | $1,850 | $1.82 | 3d | 1 | 0.58mi |
| 450 Cedar Dr Hampton, VA | 3.0 | 1.0 | 912 | $1,500 | $1.64 | 11d | 1 | 0.67mi |
| 109 Peachtree Ln Hampton, VA | 3.0 | 2.0 | 984 | $1,795 | $1.82 | 14d | 1 | 0.75mi |
| 323 Roane Dr Hampton, VA | 3.0 | 1.0 | 974 | $1,495 | $1.53 | 3d | 1 | 0.84mi |
| 234 Washington St Hampton, VA | 2.0 | 1.0 | 1111 | $2,000 | $1.80 | 10d | 1 | 0.84mi |
| 19 Magnolia Pl Hampton, VA | 3.0 | 1.5 | 1405 | $2,100 | $1.49 | 14d | 1 | 0.89mi |
| 709 E Pembroke Ave Unit B Hampton, VA | 2.0 | 1.5 | 1664 | $1,349 | $0.81 | 23d | 1 | 0.90mi |
| 305 Old Point Ave Hampton, VA | 3.0 | 1.0 | 1186 | $1,750 | $1.48 | 43d | 1 | 1.02mi |
| 13 W Lamington Rd Hampton, VA | 3.0 | 1.5 | 1415 | $2,050 | $1.45 | 43d | 1 | 1.19mi |
| 13 Beverly St Hampton, VA | 3.0 | 1.0 | 1050 | $1,800 | $1.71 | 4d | 1 | 1.25mi |
| 18 Colonies Lndg Hampton, VA | 3.0 | 2.5 | 1540 | $2,000 | $1.30 | 4d | 1 | 1.26mi |
| 2 Abbott Dr Hampton, VA | 1.0–3.0 | 1.0–3.5 | 1187 | $2,891 | $2.43 | 1d | 18 | 1.29mi |
| 448 Chapel St Hampton, VA | 3.0 | 2.0 | 1425 | $1,850 | $1.30 | 2d | 1 | 1.29mi |
| 901 W Queen St Hampton, VA | 2.0–3.0 | 1.5–2.5 | 1096 | $1,600 | $1.46 | 43d | 1 | 1.35mi |
| 626 Chapel St Hampton, VA | 4.0 | 2.0 | 1470 | $1,900 | $1.29 | 12d | 1 | 1.43mi |
| 12 Clemwood Pkwy Hampton, VA | 3.0 | 2.0 | 1200 | $1,745 | $1.45 | 23d | 1 | 1.46mi |
| 607 Lee St Hampton, VA | 3.0 | 1.5 | 1404 | $2,150 | $1.53 | 43d | 1 | 1.47mi |
| 1802 Moger Dr Hampton, VA | 3.0 | 1.0 | 900 | $1,700 | $1.89 | 12d | 1 | 1.50mi |
HOA detail
- Monthly dues
- $130 · $1,560/yr
- Likely covers
- security
Listing history 11 events
-
2026-06-18days on market $207,000 Active 16 DOM
-
2026-06-17days on market $207,000 Active 15 DOM
-
2026-06-16days on market $207,000 Active 14 DOM
-
2026-06-15days on market $207,000 Active 13 DOM
-
2026-06-13days on market $207,000 Active 11 DOM
-
2026-06-13days on market $207,000 Active 10 DOM
-
2026-06-09days on market $207,000 Active 7 DOM
-
2026-06-08days on market $207,000 Active 6 DOM
-
2026-06-07days on market $207,000 Active 5 DOM
-
2026-06-02remarks 468-char remark
-
2026-06-02$207,000 Active 1 DOM
ⓘ Source: listings_history table (triggers on properties + properties_extension) + one-shot
backfill from property_details.listing_events for pre-trigger history.
Tax reassessment forecast VA · Resets to sale price
- Current annual tax
- $2,369 · $197/mo
- Projected year-2 tax
- $2,369 · $197/mo
- Expected delta
- $0/yr ($0/mo · 0.0%)
ⓘ Screening estimate from a state-policy table — verify with the county assessor before closing.
Climate risk First Street
- Flood 6/10 Major FEMA zone X (shaded) · 57% chance over 30 yrs
- Wildfire 1/10 Low
- Heat 9/10 Extreme 7 d/yr ≥104°F today · 16 d/yr by 30 yrs out
- Wind 8/10 Severe 80% chance of damaging wind over 30 yrs
- Air quality 2/10 Low 2 unhealthy d/yr today · 2 by 30 yrs out
Nearby sold comps map
Loading sold comps map…
Walkable amenities ~0.75 mi
Loading nearby amenities…
Taxation est. · year 1
- Rental income
- $21,392
- − Mortgage interest
- −$11,595
- − Property taxes
- −$2,369
- − Insurance
- −$1,035
- − Repairs & maintenance
- −$1,711
- − Management
- −$1,711
- − HOA
- −$1,560
- − Depreciation
- −$6,022
- Taxable loss
- −$4,611
- Est. tax savings @ 24.0%
- +$1,107
- After-tax cash flow
- $16/yr
For passive investors: Depreciation is non-cash, so a rental often shows a tax loss while cash-flowing — sheltering income. Rental losses are passive: they offset passive income freely, and up to $25,000/yr can offset ordinary (W-2) income if you actively participate and your MAGI is under $100k (phasing out to $0 by $150k); unused losses carry forward. On sale, claimed depreciation is recaptured at up to 25%, and gains may owe capital-gains tax (a 1031 exchange can defer both). Figures are a year-1 estimate at your 24.0% rate — not tax advice; consult a CPA.
Schools (NCES district)
- District
- Hampton City Public School District
- NCES district ID
- 5101800
- Math proficiency
- 60% ▼ -21.00%
- Reading proficiency
- 70% ▼ -4.00%
- Median HH income
- $50,089
- Composite
- 55.19/100
- National rank
- #1272
- State rank
- #40 of 131 in VA
Livability — Hampton
- Score
- 75/100
- State rank
- #133
- US rank
- #4302
Category grades
Schools grade is shown separately in the Schools card above.
Census & demographics
- Census place
- Hampton, VA
- County
- Hampton City · 132,421 people
- City population
- 132,421
- Metro
- Virginia Beach-Norfolk-Newport News, VA-NC
- Population (ZIP)
- 39,884
- Household income
- $71,222
- Rent vs Own
- Severe rent burden
- 2130.0
Population outlook (Hampton County) Hauer SSP2
- Today (2025)
- 134,055 people
- By 2030
- 131,753 · -1.7%
- By 2040
- 125,017 · -6.7%
- By 2050
- 116,825 · -12.9%
- By 2075
- 97,033 · -27.6%
- By 2100
- 76,188 · -43.2%
Race, ethnicity, and origin ACS 2023
- Neighborhood character
- Diverse neighborhood (Simpson 0.63)
- Race & ethnicity
- Black 46% White 39% Two or more races 9% Hispanic / Latino 6% Asian 2%
- Hispanic origin (detail)
- Mexican 1% Puerto Rican 2%
- Common ancestry
- Slovak 2% Italian 1% Romanian 1%
- Foreign-born
- 4% · Canada
- Languages at home
- 95% English-only · Spanish 3% Other Asian/Pacific 1%
Political lean MEDSL · Hampton
- 2024 margin
- Solid D (+39.9) · D 69.2% · R 29.4% · Other 1.4%
- 2008→2024 swing
- +1.0pp no change · 2008: 38.9pp · 2024: 39.9pp
- All cycles
- 2024: D+39.9 2020: D+42.2 2016: D+37.8 2012: D+45.4 2008: D+38.9
Not yet ingested
- Civics
- —
Market trends
- HPI YoY
- ▼ -150.40%
- Current HPI
- 276.4636
- Rent YoY
- ▲ 5.44%
- Metro
- Virginia Beach-Norfolk-Newport News, VA-NC
- State GDP YoY
- ▲ 2.40%
- F500 in state
- 50
Industry mix (Fortune 500 HQ in VA)
| Industry | F500 HQs | Revenue |
|---|---|---|
| Aerospace / Defense | 4 | $236B |
|
||
| Technology / Defense | 3 | $32B |
|
||
| Financial Services | 2 | $176B |
|
||
| Utilities | 2 | $27B |
|
||
| Insurance | 2 | $25B |
|
||
| Technology | 2 | $15B |
|
||
Price history
+211.5% since first listed4 events — show timeline
- 2026-06-02 Listed $207,000 REINMLS
- 2026-04-17 Listing Removed — REINMLS
- 2026-02-06 Listed $215,000 REINMLS
- 1987-05-01 Sold (Public Records) $66,450 Public Records
Property tax history
+10.2%/yrLatest (2025): $2,369 · +11.3% YoY. Source: county tax records.
Cash-flow waterfall
monthlySold comps — $/sqft
last 12 mo · ≤1 miLoading sold comps…