15343 S I-20 Serv Rd W L08 · Hallsville, TX
Flood risk 1/10 · Minimal
- FEMA flood zone
- X (unshaded)
- Chance of flooding over 30 yrs
- 0.0%
- Est. flood insurance / yr
- $507 – $1,088
Fire risk 5/10 · Moderate
- Est. fire insurance / yr
- $1,222 – $2,270
Heat risk 7/10 · Major
- Hot days now (above 110°F)
- 7 days/yr
- Hot days in 30 yrs
- 24 days/yr
Wind risk 6/10 · Moderate
- Chance of severe wind over 30 yrs
- 59.0%
Air-quality risk 2/10 · Minimal
- Unhealthy air days now
- 1 days/yr
- Unhealthy air days in 30 yrs
- 2 days/yr
Risk factors via First Street. Map © Google.
Why this score? — see what drove the F grade
The composite is a weighted blend of 9 inputs, each scored 0–100. Each bar is that input's sub-score; the figure is the points it added to the 100-point composite (weight × sub-score).
- Cash flow +9.5/30.0
- ARV discount +7.5/15.0
- Livability +3.8/5.0
- Schools +3.1/10.0
- 1% rule +2.9/10.0
- DSCR +2.7/10.0
- Rent growth +2.5/5.0
- Condition / age +2.5/5.0
- Appreciation +0.0/10.0
$199,900
🖨 Deal sheet (PDF) 📄 Offer letter ✓ Due diligence
Listing remarks
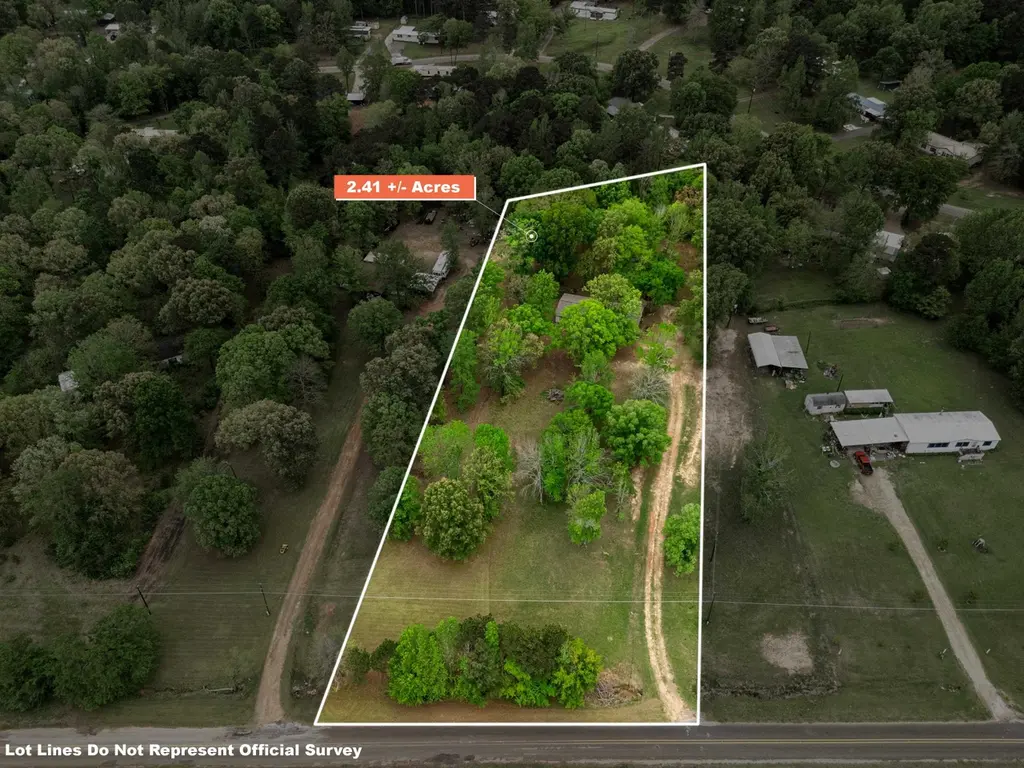
Escape to your own private sanctuary without sacrificing the convenience of the city. Nestled on a stunning 2.41 acre wooded lot, this spacious 4 bedroom, 3 bath home offers the perfect blend of rural tranquility and modern accessibility. The heart of the home features an expansive open concept living area, anchored by a cozy wood burning fireplace and sleek, updated flooring. The gourmet inspired kitchen boasts an oversized breakfast bar, & formal dining space, making it a dream for entertaining. Retreat to the private primary suite, featuring a generous walk in closet and a spa like bath. With three additional large bedrooms and two full baths, there is ample space for family or gues
Key facts
- 2.41 acre wooded lot
- Formal dining space
- 2.41 acre lot
Tags
Property features AI
Exterior
- Utilities: Public water
- Home design: Single-story; Manufactured home; Residential property
- Construction: Composition roof
- Exterior features: Level lot
Interior
- Bathrooms: 3 full bathrooms
- Heating & cooling: Central heating; Electric heating; Central air conditioning
- Interior features: Breakfast bar; Wood-burning fireplace (1)
- Laundry & utility: Electric water heater
Neighborhood map
What this means for you Summary
Snapshot
- This is a 4-bed/3.0-bath land listed at $200k.
Deal economics
- At list price, monthly cash flow is $-139 ($-2k/yr) — negative.
- To cash-flow at today's rent, offer at most $180k (10.1% below list).
- To meet the 1% rule (rent ≥ 1% of price), the offer needs to be $157k (21.3% below list).
- Recommended offer: $157k (21.3% below list) — sets the bar for 1% rule.
Location & tenants
- Location reads 76/100 on livability (#117 in TX, #3,765 nationally) — a middle-class / working-renter tenant base. Strengths: crime A+, cost of living A+, housing A+; Watch: amenities F, commute F.
- Hallsville ISD (town): math 30% / reading 40% proficiency, ranked #490 of 826 in TX (top 59%) — families likely to look elsewhere, expect single-tenant / working-renter base with shorter leases.
- Zoned schools: Hallsville H S (math 66% / reading 70%, grade B, #150 of 1,632 statewide, top 10%, 1,456 students, 40% FRL) — zoned schools at 40% FRL track the district average.
- Zoned-school proficiency averages 68% at this address vs 35% district-wide (+33 pts) — the actual schools serving this property are materially stronger than the Hallsville ISD average implies; a family-tenant draw the district grade alone would hide.
- Market conditions: 143 active listings in the ZIP; 85 units permitted in Harrison County in 2024 (15 in 5+ unit buildings).
- This rent runs 36% of the median local income ($52k/yr) — at the standard rent-burdened threshold; future hikes will face affordability resistance.
Forward outlook
- Local home prices are declining (-3.0%/yr); year-one equity from $1k of loan paydown is wiped out by about $6k of value loss. Plan a longer hold.
Negotiation context
- It's been on market 49 days — a 3% lower offer ($194k) is reasonable based on typical stale-listing flexibility.
- 2 sale attempts since 2y ago with the ask held roughly flat each time — persistent listings suggest the price (not the market) is what's stuck; bring a comps-based counter.
Risks & watch-outs
- Climate carrying-cost: major wind risk, 59% chance of damaging wind over 30y; moderate wildfire risk; extreme-heat days projected 7→24/yr by 2055 (HVAC capex compounding) — expect insurance premiums to compound above CPI over the hold.
Questions for the listing agent
- What do current leases actually rent for vs. the listed asking? Can we see a recent rent roll and the last 12 months of T-12 income?
- It's been on market 49 days. Have you received any prior offers? Is the seller open to a 21% concession, seller financing, or rate buy-down credit?
- Is there a deadline driving the sale (1031 exchange, divorce, estate, relocation)? That informs how much negotiation room exists.
- Schools are B-rated — typically a magnet for longer-tenancy family renters. What's the average tenant stay here, and is there a school-zone premium baked into asking?
- The area grade is low — what's the realistic commute time and amenity access for the typical tenant pool here? Any planned neighborhood developments (good or bad) we should know about?
- What's the average days-on-market for RENTAL listings here right now (not sales)? A rising rental-DOM trend means longer vacancies and softer asking-rent achievability than the comps imply.
- What's the recent tenant-quality profile in this submarket — average credit score on applications, eviction rate, late-payment / NSF rate, and stable-employment percentage? A property-management company in the area should have these aggregated.
- How much new for-sale + rental construction is in the pipeline within 1–3 miles? Heavy new supply typically softens prices + rents 12–24 months out; constrained supply supports both.
Investment metrics
- 1% rule
- 0.79% ✗
- Cap rate
- 5.46%
- Cash-on-cash
- -2.99%
- DSCR
- 0.87
- GRM
- 10.6
CMA / ARV
No comps found within radius.
Projected returns pro-forma
-3.0% appreciation · 3.0% rent growth · sell at horizon
- IRR
- -21.3%
- Equity multiple
- 0.26×
- Total profit
- $-41,248
- Equity at exit
- $29,806
- IRR
- -14.8%
- Equity multiple
- 0.16×
- Total profit
- $-47,255
- Equity at exit
- $17,284
Cash invested: $55,972 (down + closing). Projections, not guarantees.
Landlord ↔ Tenant lean methodology
- Overall (STATE)
- 87 Strongly Landlord-Friendly
- State Texas
- 87 Strongly Landlord-Friendly · R+5
- County
- — inherits STATE
- City
- — inherits STATE
ZIP-level market 75602
- Home prices YoY
- -17.5%
- Active inventory
- 143
- Price-to-rent
- 10.6×
Monthly cashflow live
- Estimated rent
- $1,572 medium interval (Pro) →
- Mortgage (P&I)
- −$1,048
- Tax est. 1.5%
- −$250 /mo · $2,998/yr
- Insurance
- −$83
- HOA
- −$0
- Vacancy / Maint / Mgmt
- −$330
- Net cashflow
- $-139
Break-even live
Sensitivity live
| Price | -10% $-1 | -5% $-70 | +0% $-139 | +5% $-208 | +10% $-278 |
|---|---|---|---|---|---|
| Rent | -10% $-264 | -5% $-202 | +0% $-139 | +5% $-77 | +10% $-15 |
| Rate | -1.0pp $-39 | -0.5pp $-89 | base $-139 | +0.5pp $-191 | +1.0pp $-244 |
UW: 25.0% down · 7.5% · 30yr · 1.5% tax · 5.0% vac · 8.0% maint · 8.0% mgmt
Financing live
Cash to close
- Down payment
- $49,975
- Closing costs
- $5,997
- Reserves months
- —
- Total cash needed
- —
Loan-product check · same deal, 3 products live
Conventional
25% down · 7.5% · 30yr
- Down + closing
- —
- Monthly P&I
- —
- Monthly cashflow
- —
- DSCR
- —
- Eligible?
- —
Personal DTI + credit; lowest rate.
DSCR
20% down · 8.5% · 30yr
- Down + closing
- —
- Monthly P&I
- —
- Monthly cashflow
- —
- DSCR
- —
- Eligible?
- —
No personal income docs; deal must DSCR.
Hard money
10% down · 12.0% · 12mo
- Down + closing
- —
- Monthly P&I
- —
- Monthly cashflow
- —
- DSCR
- —
- Eligible?
- —
Short-term bridge; refi at stabilization.
Listing history 20 events
-
2026-06-19days on market $199,900 Active 49 DOM
-
2026-06-18days on market $199,900 Active 48 DOM
-
2026-06-17days on market $199,900 Active 47 DOM
-
2026-06-16days on market $199,900 Active 46 DOM
-
2026-06-15days on market $199,900 Active 45 DOM
-
2026-06-14days on market $199,900 Active 43 DOM
-
2026-06-13days on market $199,900 Active 42 DOM
-
2026-06-10days on market $199,900 Active 40 DOM
-
2026-06-09days on market $199,900 Active 39 DOM
-
2026-06-08days on market $199,900 Active 38 DOM
-
2026-06-07days on market $199,900 Active 37 DOM
-
2026-06-05days on market $199,900 Active 34 DOM
-
2026-06-02days on market $199,900 Active 32 DOM
-
2026-06-01days on market $199,900 Active 31 DOM
-
2026-05-31days on market $199,900 Active 30 DOM
-
2026-05-30days on market $199,900 Active 29 DOM
-
2026-05-01$199,900 Active 858-char remark
-
2024-08-05price $120,000
-
2024-07-11price $149,900
-
2024-06-06$199,900 Active
ⓘ Source: listings_history table (triggers on properties + properties_extension) + one-shot
backfill from property_details.listing_events for pre-trigger history.
Climate risk First Street
- Flood 1/10 Low FEMA zone X (unshaded) · 0% chance over 30 yrs
- Wildfire 5/10 Major
- Heat 7/10 Severe 7 d/yr ≥110°F today · 24 d/yr by 30 yrs out
- Wind 6/10 Major 59% chance of damaging wind over 30 yrs
- Air quality 2/10 Low 1 unhealthy d/yr today · 2 by 30 yrs out
Nearby sold comps map
Loading sold comps map…
Walkable amenities ~0.75 mi
Loading nearby amenities…
Taxation est. · year 1
- Rental income
- $18,867
- − Mortgage interest
- −$11,198
- − Property taxes
- −$2,998
- − Insurance
- −$1,000
- − Repairs & maintenance
- −$1,509
- − Management
- −$1,509
- − Depreciation
- −$5,815
- Taxable loss
- −$5,163
- Est. tax savings @ 24.0%
- +$1,239
- After-tax cash flow
- $-434/yr
For passive investors: Depreciation is non-cash, so a rental often shows a tax loss while cash-flowing — sheltering income. Rental losses are passive: they offset passive income freely, and up to $25,000/yr can offset ordinary (W-2) income if you actively participate and your MAGI is under $100k (phasing out to $0 by $150k); unused losses carry forward. On sale, claimed depreciation is recaptured at up to 25%, and gains may owe capital-gains tax (a 1031 exchange can defer both). Figures are a year-1 estimate at your 24.0% rate — not tax advice; consult a CPA.
Schools (NCES district)
- District
- Hallsville ISD
- NCES district ID
- 4822170
- Math proficiency
- 30% ▼ -2.00%
- Reading proficiency
- 40% ▲ 2.00%
- Median HH income
- $57,770
- Composite
- 31.05/100
- National rank
- #6081
- State rank
- #490 of 826 in TX
Livability — Hallsville
- Score
- 76/100
- State rank
- #117
- US rank
- #3765
Category grades
Schools grade is shown separately in the Schools card above.
Census & demographics
- County
- Gregg County · 128,826 people
- Metro
- Longview, TX
- Population (ZIP)
- 20,671
- Household income
- $52,330
- Rent vs Own
- Severe rent burden
- 724.0
Population outlook (Harrison County) Hauer SSP2
- Today (2025)
- 68,691 people
- By 2030
- 69,317 · +0.9%
- By 2040
- 69,973 · +1.9%
- By 2050
- 70,090 · +2.0%
- By 2075
- 70,607 · +2.8%
- By 2100
- 67,546 · -1.7%
Race, ethnicity, and origin ACS 2023
- Neighborhood character
- Diverse neighborhood (Simpson 0.68)
- Race & ethnicity
- Hispanic / Latino 39% White 30% Black 28% Two or more races 28% Asian 1%
- Hispanic origin (detail)
- Mexican 37%
- Common ancestry
- Italian 1% Serbian 1%
- Foreign-born
- 18% · Canada, Vietnam
- Languages at home
- 64% English-only · Spanish 35% Other Indo-European 1%
Political lean MEDSL · Harrison
- 2024 margin
- Solid R (+50.6) · D 24.4% · R 75.0%
- 2008→2024 swing
- -19.2pp toward R · 2008: -31.4pp · 2024: -50.6pp
- All cycles
- 2024: R+50.6 2020: R+45.6 2016: R+43.9 2012: R+34.6 2008: R+31.4
Not yet ingested
- Civics
- —
Market trends
- HPI YoY
- ▼ -46.34%
- Current HPI
- 218.2988
- Rent YoY
- —
- Metro
- Longview, TX
- State GDP YoY
- ▲ 3.95%
- F500 in state
- 110
Industry mix (Fortune 500 HQ in TX)
| Industry | F500 HQs | Revenue |
|---|---|---|
| Energy | 16 | $1,198B |
|
||
| Technology | 5 | $198B |
|
||
| Engineering / Construction | 4 | $72B |
|
||
| Energy Services | 3 | $60B |
|
||
| Utilities | 3 | $41B |
|
||
| Healthcare | 2 | $330B |
|
||
Price history
+0.0% since first listed4 events — show timeline
- 2026-05-01 Listed $199,900 LAAR
- 2024-08-05 Price Changed $120,000 LAAR
- 2024-07-11 Price Changed $149,900 LAAR
- 2024-06-06 Listed $199,900 LAAR
Cash-flow waterfall
monthlySold comps — $/sqft
last 12 mo · ≤1 miLoading sold comps…