352 E Innis Ave #350 · Columbus, OH
Flood risk No data
- FEMA flood zone
- —
- Chance of flooding over 30 yrs
- —
- Est. flood insurance / yr
- —
Fire risk No data
- Est. fire insurance / yr
- —
Heat risk No data
- Hot days now (above threshold)
- —
- Hot days in 30 yrs
- —
Wind risk No data
- Chance of severe wind over 30 yrs
- —
Air-quality risk No data
- Unhealthy air days now
- —
- Unhealthy air days in 30 yrs
- —
Risk factors via First Street. Map © Google.
Why this score? — see what drove the B- grade
The composite is a weighted blend of 9 inputs, each scored 0–100. Each bar is that input's sub-score; the figure is the points it added to the 100-point composite (weight × sub-score).
- Cash flow +30.0/30.0
- 1% rule +10.0/10.0
- DSCR +10.0/10.0
- ARV discount +7.5/15.0
- Livability +4.0/5.0
- Rent growth +3.1/5.0
- Schools +1.7/10.0
- Condition / age +1.0/5.0
- Appreciation +0.0/10.0
$100,000
🖨 Deal sheet (PDF) 📄 Offer letter ✓ Due diligence
Listing remarks
Investor special! This property offers high comparable sales around the area. Multi-family with the ability to be re-zoned as a single family home.
Key facts
- 3,920 sq ft lot
- Built 1900
- Listed 39 days
Property features AI
Finance
- Financial info: Annual taxes reported (2024)
Exterior
- Utilities: Public water; Public sewer
- Home design: Single family residence; Duplex structure; Two levels; Built in 1900; No shared/common walls
- Construction: Built in 1900
- Exterior features: Other foundation
Interior
- Bathrooms: Two full bathrooms
- Interior features: Full basement; 2 full bathrooms; Total living area approximately 2,611
Neighborhood map
What this means for you Summary
Snapshot
- This is a 4-bed/2.0-bath single-family listed at $100k. Condition is rated poor.
Deal economics
- At list price, monthly cash flow is $1k ($17k/yr) — positive.
- The deal already cash-flows at list — no discount required.
- Meets the 1% rule at list price ($3k rent vs $100k).
- Recommended offer: $97k (3.0% below list) — sets the bar for market timing.
- Cap rate 23.5% vs local median 3.8% in Columbus — top-decile yield for the area; either an underpriced asset or a hidden risk that comps aren't pricing in. Stress-test before assuming the spread holds.
Location & tenants
- Location reads 81/100 on livability (#97 in OH, #1,491 nationally) — a professional / high-income tenant draw. Strengths: commute A+, cost of living A+, housing A+; Watch: employment C-, crime F.
- Columbus City School District (urban): math 15% / reading 26% proficiency, ranked #626 of 656 in OH (top 95%) — low school quality limits family demand, transient renter base, plan for 1-2y turnover; 72% free/reduced lunch — lower-income household profile, screen leases tightly.
- Zoned schools: Indianola Informal K-8 School (math 43% / reading 58%, grade D+, #896 of 1,584 statewide, top 57%, 684 students, 0% FRL); Arts Impact Middle School (Aims) (math 17% / reading 25%, grade F, #608 of 654 statewide, top 93%, 532 students, 0% FRL); South High School (math 10% / reading 26%, grade F, #687 of 781 statewide, top 88%, 903 students, 0% FRL) — zoned schools average 0% FRL vs 72% district-wide (72 pts lower); this property's tenant base skews higher-income than the district average.
- Market conditions: Rents rising (+2.3%/yr); 198 active listings in the ZIP; 6 comparable units currently listed for rent nearby; rentals at typical pace (median 26d on market — plan ~3-4 weeks tenant-placement turnaround); 8,139 units permitted in Franklin County in 2024 (5,940 in 5+ unit buildings).
- At $2,687/mo this rent would consume 51% of the median local household income ($63k/yr) (locally 1679% of renters already pay >50% of income on rent) — very limited rent-growth headroom before tenants either downsize or default.
Forward outlook
- Local home prices are declining (-3.0%/yr); year-one equity from $691 of loan paydown is wiped out by about $3k of value loss. Plan a longer hold.
- Franklin County population projected at +34% by 2050 — long-run rental-demand tailwind backs the buy-and-hold thesis.
- At projected returns (-3.0% appreciation + 2.3% rent growth), your $28k cash investment doubles in ~2 years — after that, you're playing with house money.
Negotiation context
- It's been on market 40 days — a 3% lower offer ($97k) is reasonable based on typical stale-listing flexibility.
Risks & watch-outs
- Watch-outs: built in 1900 — expect roof / HVAC / electrical / plumbing capex.
Questions for the listing agent
- It's been on market 40 days. Have you received any prior offers? Is the seller open to a 3% concession, seller financing, or rate buy-down credit?
- Have any recent inspections been done? Can we get a copy of the seller's disclosures and any deferred-maintenance estimates?
- Built in 1900 — when were the roof, HVAC, electrical panel, plumbing, and water heater last replaced?
- Is there a deadline driving the sale (1031 exchange, divorce, estate, relocation)? That informs how much negotiation room exists.
- Crime grade is F in this area — have there been break-ins, vandalism, or insurance claims at this property in the last 3 years? What carrier currently insures it and at what premium?
- What's the average days-on-market for RENTAL listings here right now (not sales)? A rising rental-DOM trend means longer vacancies and softer asking-rent achievability than the comps imply.
- What's the recent tenant-quality profile in this submarket — average credit score on applications, eviction rate, late-payment / NSF rate, and stable-employment percentage? A property-management company in the area should have these aggregated.
- How much new for-sale + rental construction is in the pipeline within 1–3 miles? Heavy new supply typically softens prices + rents 12–24 months out; constrained supply supports both.
Investment metrics
- 1% rule
- 2.69% ✓
- Cap rate
- 23.48%
- Cash-on-cash
- 61.37%
- DSCR
- 3.73
- GRM
- 3.1
CMA / ARV
- ARV (median comp)
- $424,149
- List price
- $100,000
- Delta
- -76.42%
- Verdict
- UNDERPRICED
- Comps
- 20 within 1.0 mi
Show comp detail 9 sales within ~0.75 mi
| Address | Dist | Beds/Ba | Sqft | Sold | Price | $/sf | Match |
|---|---|---|---|---|---|---|---|
| 380 E Markison Ave | 0.37mi | 4/3.5 | 2,695 (+3%) | 4mo | $651,000 | $242 | 68 |
| 453 Stambaugh Ave | 0.55mi | 4/3.0 | 2,548 (-2%) | 4mo | $272,500 | $107 | 63 |
| 230 E Morrill Ave | 0.29mi | 4/3.0 | 2,477 (-5%) | 13mo | $480,000 | $194 | 63 |
| 160 E Moler St | 0.70mi | 4/2.5 | 2,536 (-3%) | 12mo | $725,000 | $286 | 51 |
| 1477 S 4th St | 0.56mi | 4/2.0 | 2,422 (-7%) | 14mo | $370,000 | $153 | 50 |
| 347 E Markison Ave | 0.32mi | 4/2.0 | 2,260 (-13%) | 18mo | $475,000 | $210 | 48 |
| 1616 S 4th St | 0.42mi | 4/3.5 | 2,224 (-15%) | 11mo | $470,000 | $211 | 40 |
| 317 Frebis Ave | 0.65mi | 4/3.5 | 2,460 (-6%) | 21mo | $545,000 | $222 | 37 |
| 304 Hanford St | 0.73mi | 4/2.0 | 2,249 (-14%) | 23mo | $530,000 | $236 | 23 |
Match score weights: distance 35% · size 25% · config 20% · recency 20%. Top-matched comps best support the ARV.
Projected returns pro-forma
-3.0% appreciation · 2.32% rent growth · sell at horizon
- IRR
- 59.5%
- Equity multiple
- 3.61×
- Total profit
- $73,216
- Equity at exit
- $14,910
- IRR
- 64.0%
- Equity multiple
- 7.21×
- Total profit
- $173,970
- Equity at exit
- $8,646
Cash invested: $28,000 (down + closing). Projections, not guarantees.
Landlord ↔ Tenant lean methodology
- Overall (STATE)
- 73 Landlord-Friendly
- State Ohio
- 73 Landlord-Friendly · R+6
- County
- — inherits STATE
- City
- — inherits STATE
ZIP-level market 43207
- Rents YoY
- 2.3%
- Active inventory
- 198
- Price-to-rent
- 3.1×
Monthly cashflow live
- Estimated rent
- $2,687 high interval (Pro) →
- Mortgage (P&I)
- −$524
- Tax est. 1.5%
- −$125 /mo · $1,500/yr
- Insurance
- −$42
- HOA
- −$0
- Vacancy / Maint / Mgmt
- −$564
- Net cashflow
- $1,432
Break-even live
Sensitivity live
| Price | -10% $1,501 | -5% $1,467 | +0% $1,432 | +5% $1,397 | +10% $1,363 |
|---|---|---|---|---|---|
| Rent | -10% $1,220 | -5% $1,326 | +0% $1,432 | +5% $1,538 | +10% $1,644 |
| Rate | -1.0pp $1,482 | -0.5pp $1,457 | base $1,432 | +0.5pp $1,406 | +1.0pp $1,380 |
UW: 25.0% down · 7.5% · 30yr · 1.5% tax · 5.0% vac · 8.0% maint · 8.0% mgmt
Financing live
Cash to close
- Down payment
- $25,000
- Closing costs
- $3,000
- Reserves months
- —
- Total cash needed
- —
Loan-product check · same deal, 3 products live
Conventional
25% down · 7.5% · 30yr
- Down + closing
- —
- Monthly P&I
- —
- Monthly cashflow
- —
- DSCR
- —
- Eligible?
- —
Personal DTI + credit; lowest rate.
DSCR
20% down · 8.5% · 30yr
- Down + closing
- —
- Monthly P&I
- —
- Monthly cashflow
- —
- DSCR
- —
- Eligible?
- —
No personal income docs; deal must DSCR.
Hard money
10% down · 12.0% · 12mo
- Down + closing
- —
- Monthly P&I
- —
- Monthly cashflow
- —
- DSCR
- —
- Eligible?
- —
Short-term bridge; refi at stabilization.
Rent comps 6 comps
| Address | Beds | Baths | Sqft | Rent | $/sqft | DOM | Units | Dist |
|---|---|---|---|---|---|---|---|---|
| 357 Frebis Ave #6 Columbus, OH | 3.0 | 3.5 | 2160 | $2,950 | $1.37 | 45d | 1 | 0.65mi |
| 530 Hanford St Unit 1496117P Columbus, OH | 4.0 | 3.0 | 1862 | $7,310 | $3.93 | 4d | 1 | 0.76mi |
| 1187 S High St Columbus, OH | 4.0 | 1.5 | 2790 | $2,500 | $0.90 | 25d | 1 | 0.99mi |
| 316 E Deshler Ave Columbus, OH | 3.0 | 1.5 | 3701 | $2,600 | $0.70 | 25d | 1 | 1.03mi |
| 2089 Lockbourne Rd Columbus, OH | 5.0 | 2.0 | 2534 | $2,800 | $1.10 | 12d | 1 | 1.09mi |
| 895 S Wall St Columbus, OH | 3.0 | 3.5 | 2139 | $4,500 | $2.10 | 4d | 1 | 1.38mi |
Listing history 16 events
-
2026-06-21days on market $100,000 Active 40 DOM
-
2026-06-18days on market $100,000 Active 37 DOM
-
2026-06-17days on market $100,000 Active 36 DOM
-
2026-06-16days on market $100,000 Active 35 DOM
-
2026-06-15days on market $100,000 Active 34 DOM
-
2026-06-13days on market $100,000 Active 32 DOM
-
2026-06-13days on market $100,000 Active 31 DOM
-
2026-06-09days on market $100,000 Active 28 DOM
-
2026-06-08days on market $100,000 Active 27 DOM
-
2026-06-07days on market $100,000 Active 26 DOM
-
2026-06-05pricedays on market $100,000 Active 23 DOM
-
2026-06-03days on market $125,000 Active 22 DOM
-
2026-06-02days on market $125,000 Active 21 DOM
-
2026-06-01days on market $125,000 Active 20 DOM
-
2026-05-31days on market $125,000 Active 19 DOM
-
2026-05-12$125,000 Active 147-char remark
ⓘ Source: listings_history table (triggers on properties + properties_extension) + one-shot
backfill from property_details.listing_events for pre-trigger history.
Nearby sold comps map
Loading sold comps map…
Walkable amenities ~0.75 mi
Loading nearby amenities…
Taxation est. · year 1
- Rental income
- $32,250
- − Mortgage interest
- −$5,602
- − Property taxes
- −$1,500
- − Insurance
- −$500
- − Repairs & maintenance
- −$2,580
- − Management
- −$2,580
- − Depreciation
- −$2,909
- Taxable income
- $16,579
- Est. tax owed @ 24.0%
- −$3,979
- After-tax cash flow
- $13,205/yr
For passive investors: Depreciation is non-cash, so a rental often shows a tax loss while cash-flowing — sheltering income. Rental losses are passive: they offset passive income freely, and up to $25,000/yr can offset ordinary (W-2) income if you actively participate and your MAGI is under $100k (phasing out to $0 by $150k); unused losses carry forward. On sale, claimed depreciation is recaptured at up to 25%, and gains may owe capital-gains tax (a 1031 exchange can defer both). Figures are a year-1 estimate at your 24.0% rate — not tax advice; consult a CPA.
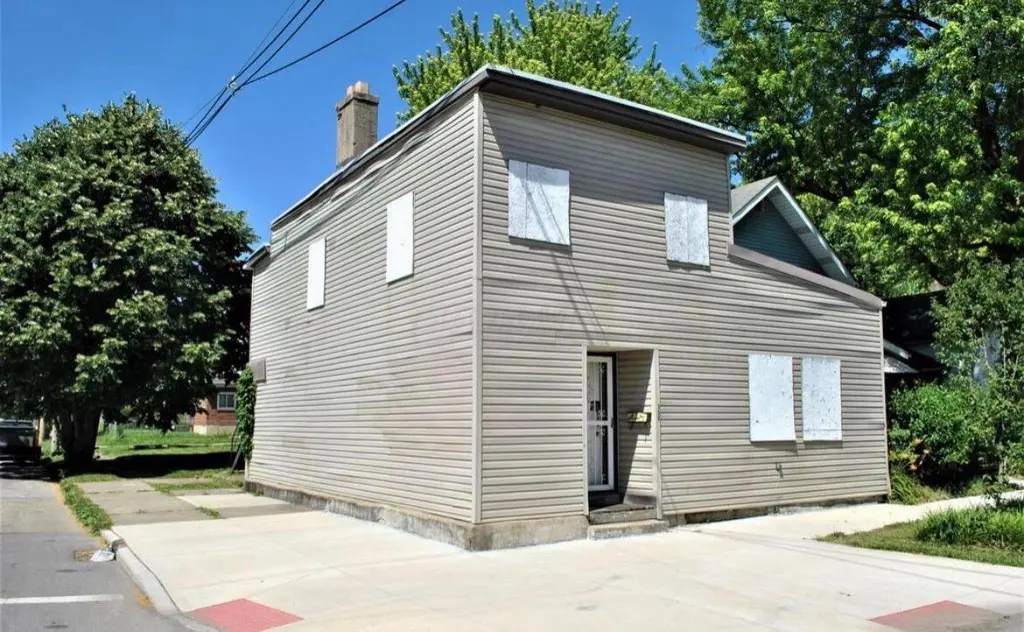
Condition & rehab AI · 2 photos
This property requires extensive repairs and stabilization, including exterior siding, roof, foundation, and landscaping. Significant investment is needed to make it move-in ready.
Repairs flagged
- Major exterior siding — Severe peeling and damage
- Major roof — Visible damage
- Major foundation — Exposed and in poor condition
- Major landscaping — Minimal and overgrown
Value-add opportunities
- Both repair and replace exterior siding — Improves both resale and rental value
- Both repair and replace roof — Improves both resale and rental value
- Both repair and stabilize foundation — Improves both resale and rental value
- Both landscaping and curb appeal — Improves both resale and rental value
Renovation cost estimate screening
| Repair item | Severity | Est. cost |
|---|---|---|
| exterior siding · Severe peeling and damage | Major | $15,000–50,000 |
| roof · Visible damage | Major | $15,000–50,000 |
| foundation · Exposed and in poor condition | Major | $15,000–50,000 |
| landscaping · Minimal and overgrown | Major | $15,000–50,000 |
| Total estimated repair cost · 4 items | $60,000–200,000 |
Value-add ROI direction
- Both repair and replace exterior siding — Improves both resale and rental value ↑
- Both repair and replace roof — Improves both resale and rental value ↑
- Both repair and stabilize foundation — Improves both resale and rental value ↑
- Both landscaping and curb appeal — Improves both resale and rental value ↑
ⓘ Cost ranges are severity-bucket heuristics (US national rule-of-thumb). Get contractor quotes + a written scope before underwriting a rehab budget.
Schools (NCES district)
- District
- Columbus City School District
- NCES district ID
- 3904380
- Math proficiency
- 15% ▼ -17.00%
- Reading proficiency
- 26% ▼ -12.00%
- Median HH income
- $38,483
- Composite
- 17.19/100
- National rank
- #9105
- State rank
- #626 of 656 in OH
Livability — Columbus
- Score
- 81/100
- State rank
- #97
- US rank
- #1491
Category grades
Schools grade is shown separately in the Schools card above.
Census & demographics
- Census place
- Columbus, OH
- County
- Franklin County · 1,351,780 people
- City population
- 612,189
- Metro
- Columbus, OH
- Population (ZIP)
- 47,272
- Household income
- $63,310
- Rent vs Own
- Severe rent burden
- 1679.0
Population outlook (Franklin County) Hauer SSP2
- Today (2025)
- 1,456,139 people
- By 2030
- 1,556,890 · +6.9%
- By 2040
- 1,757,349 · +20.7%
- By 2050
- 1,950,539 · +34.0%
- By 2075
- 2,376,171 · +63.2%
- By 2100
- 2,636,796 · +81.1%
Race, ethnicity, and origin ACS 2023
- Neighborhood character
- Diverse neighborhood (Simpson 0.57)
- Race & ethnicity
- White 59% Black 28% Two or more races 7% Hispanic / Latino 5% Asian 1%
- Hispanic origin (detail)
- Mexican 3%
- Common ancestry
- Italian 2% Romanian 2% Slovak 1%
- Foreign-born
- 4% · Canada
- Languages at home
- 95% English-only · Spanish 3% Other Indo-European 1%
Political lean MEDSL · Franklin
- 2024 margin
- Strong D (+28.4) · D 63.7% · R 35.3% · Other 1.0%
- 2008→2024 swing
- +7.7pp toward D · 2008: 20.7pp · 2024: 28.4pp
- All cycles
- 2024: D+28.4 2020: D+31.4 2016: D+25.9 2012: D+21.7 2008: D+20.7
Not yet ingested
- Civics
- —
Market trends
- HPI YoY
- ▼ -244.33%
- Current HPI
- 268.3028
- Rent YoY
- ▲ 2.32%
- Metro
- Columbus, OH
- State GDP YoY
- ▲ 1.98%
- F500 in state
- 48
Industry mix (Fortune 500 HQ in OH)
| Industry | F500 HQs | Revenue |
|---|---|---|
| Insurance | 3 | $145B |
|
||
| Industrial Machinery | 3 | $49B |
|
||
| Financial Services | 3 | $24B |
|
||
| Consumer Goods | 2 | $93B |
|
||
| Aerospace / Defense | 2 | $47B |
|
||
| Utilities | 2 | $33B |
|
||
Price history
-20.0% since first listed2 events — show timeline
- 2026-06-03 Price Changed $100,000 CBRMLS
- 2026-05-12 Listed $125,000 CBRMLS
Cash-flow waterfall
monthlySold comps — $/sqft
last 12 mo · ≤1 miLoading sold comps…