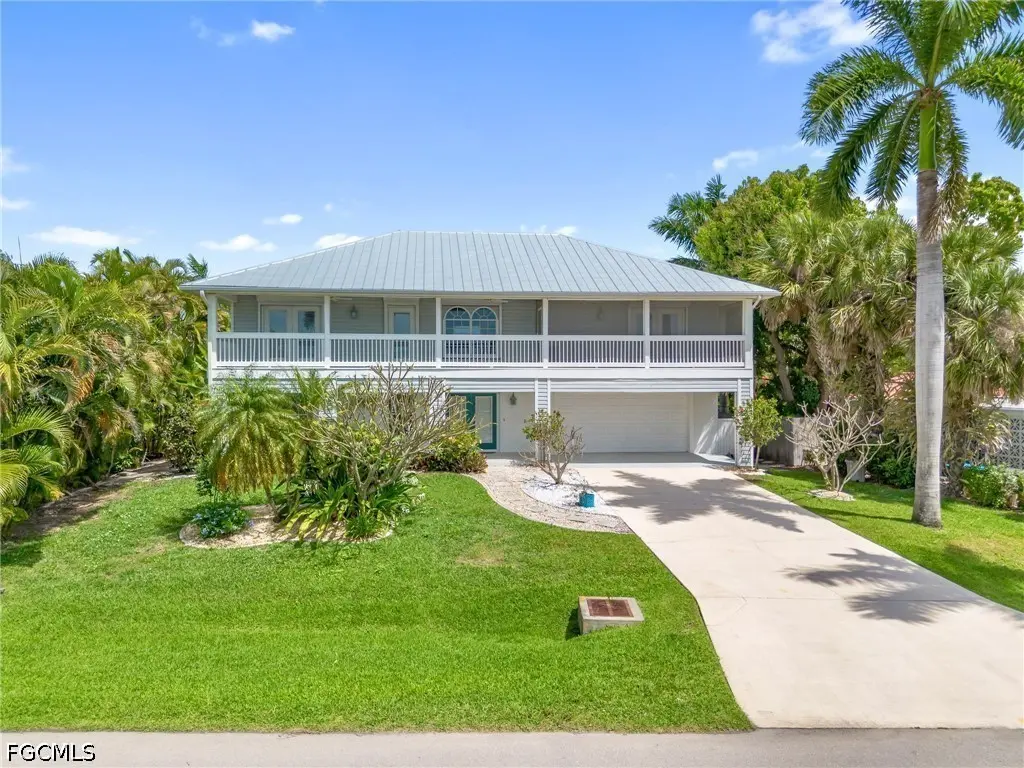
647 Coral Dr · Cape Coral, FL
Flood risk 8/10 · Major
- FEMA flood zone
- AE
- Chance of flooding over 30 yrs
- 0.99%
- Est. flood insurance / yr
- $1,737 – $8,500
Fire risk 1/10 · Minimal
- Est. fire insurance / yr
- $947 – $1,759
Heat risk 10/10 · Severe
- Hot days now (above 107°F)
- 7 days/yr
- Hot days in 30 yrs
- 29 days/yr
Wind risk 10/10 · Severe
- Chance of severe wind over 30 yrs
- 99.0%
Air-quality risk 2/10 · Minimal
- Unhealthy air days now
- 1 days/yr
- Unhealthy air days in 30 yrs
- 1 days/yr
Risk factors via First Street. Map © Google.
Why this score? — see what drove the C grade
The composite is a weighted blend of 9 inputs, each scored 0–100. Each bar is that input's sub-score; the figure is the points it added to the 100-point composite (weight × sub-score).
- Cash flow +25.0/30.0
- DSCR +8.1/10.0
- ARV discount +7.5/15.0
- 1% rule +5.8/10.0
- Schools +4.1/10.0
- Livability +3.9/5.0
- Condition / age +2.5/5.0
- Rent growth +1.1/5.0
- Appreciation +0.0/10.0
$474,000
🖨 Deal sheet 📄 Offer letter ✓ Due diligence
Listing remarks MLS
HIGHLY DESIREABLE CORAL DRIVE IN THE PRESTIGEOUS YACHT CLUB AREA!MILES OF BREATHTAKING VIEWS OF THE CALOOSAHATCHEE RIVER on a street lined w/ ROYAL PALMS!GAZE OUT FROM YOUR 8' X 56' 2nd FLOOR DECK, SCREENED DECK, MASTER BED, FAMILY RM OR GUEST ROOM. ENJOY THE SURISE, SUNSET OR THE GLITTERING MOONLIT RIVER. HUGE!VERY PRIVATE TROPICAL POOL, LANAI. THIS HOME HAS CHARACTER AND OPEN SPACE WITH 3800 Sq. Ft. UNDER TRUSS & 5176 TOTAL Sq. Ft. A MILLION DOLLAR FEELING & NEIGHBORHOOD WITHOUT PAYING RIVER FRONT PROPERTY, TAXES OR INSURANCE. THE UPSTAIRS FAMILY ROOM IS SO HUGE THAT YOU CAN EASILY CONVERT A PORTION OF IT INTO A 4TH BEDROOM. ADDITIONAL FEATURES INCLUDE BOSE STEREO SYS. THROUGHOUT, ELECTRIC ROLL OUT CANOPY, DUAL WATER, BUILT IN MURPHY BED WITH OFFICE. THIS NEWER HOME HAS A 9.8 FT ELEVATION, HIP ROOF, MIAMI CODE HURRICANE PANELS & STRUCTUALLY FORTIFIED WHICH ALLOWS LOW HOMEOWNERS INSURANCE. INSPECTED BY MY SAFE FLORIDA HOMES. ALL ASSESSMENTS PAID. HOME WARRANTY. CREATIVE FINANCING FOR EU MEMBERS.
Key facts
- New metal roof
- Serene river views
- New water heater
Tags
Property features AI
Finance
- Financial info: Pets allowed
- HOA & community: No association fee listed
Exterior
- Parking: Attached 2-car garage; Driveway; Paved parking; Garage door opener
- Security: Smoke detectors
- Utilities: Public water (assessment paid); Public sewer (assessment paid); Cable available; High-speed internet available
- Home design: 2-story home; Entry level: 1; Faces north; Resale property
- Construction: Built with block, concrete, wood frame, and vinyl siding; Metal roof; In-ground concrete pool with screen enclosure; Pool is heated with electric heat and includes pool equipment
- Exterior features: Screened lanai/porch; Porch; Sprinkler/Irrigation system (municipal, automatic); Shutters (electric and manual); South exposure; Rectangular lot; Publicly maintained road
Interior
- Kitchen: Electric cooktop; Self-cleaning oven; Microwave; Dishwasher; Refrigerator
- Bedrooms: Primary suite on upper level; Den
- Flooring: Carpet; Tile
- Bathrooms: 2 full bathrooms; 1 half bathroom
- Heating & cooling: Central heating (electric); Central air; Ceiling fans
- Interior features: High ceilings; Family/Dining room; Living/Dining room; Bathtub; Separate shower; Dual sinks; Unfurnished; Single-hung and sliding windows
- Laundry & utility: Washer and dryer inside
Neighborhood map
What this means for you Summary
Snapshot
- This is a 3-bed/3.0-bath single-family listed at $474k.
Deal economics
- At list price, monthly cash flow is $604 ($7k/yr) — positive.
- The deal already cash-flows at list — no discount required.
- Meets the 1% rule at list price ($5k rent vs $474k).
- Recommended offer: $460k (3.0% below list) — sets the bar for market timing.
- Cap rate 8.9% vs local median 3.1% in Cape Coral — top-decile yield for the area; either an underpriced asset or a hidden risk that comps aren't pricing in. Stress-test before assuming the spread holds.
Location & tenants
- Location reads 77/100 on livability (#208 in FL, #3,098 nationally) — a middle-class / working-renter tenant base. Strengths: housing A+, health & safety A+, amenities B+; Watch: commute F.
- Lee (suburban): math 47% / reading 50% proficiency, ranked #42 of 73 in FL (top 58%) — families likely to look elsewhere, expect single-tenant / working-renter base with shorter leases.
- Market conditions: Rents falling (-5.5%/yr); 820 active listings in the ZIP; 12 comparable units currently listed for rent nearby; rentals at typical pace (median 24d on market — plan ~3-4 weeks tenant-placement turnaround); 15,411 units permitted in Lee County in 2024 (4,686 in 5+ unit buildings).
- At $5,118/mo this rent would consume 86% of the median local household income ($71k/yr) (locally 1182% of renters already pay >50% of income on rent) — very limited rent-growth headroom before tenants either downsize or default.
Forward outlook
- Local home prices are declining (-3.0%/yr); year-one equity from $3k of loan paydown is wiped out by about $14k of value loss. Plan a longer hold.
- Lee County population projected at +44% by 2050 — long-run rental-demand tailwind backs the buy-and-hold thesis.
Negotiation context
- It's been on market 34 days — a 3% lower offer ($460k) is reasonable based on typical stale-listing flexibility.
- Current owner paid $395k; 20% above their basis — modest negotiation headroom, anchor on the comps not their cost.
Risks & watch-outs
- Watch-outs: flood insurance adds $427/mo.
- Climate carrying-cost: in FEMA flood zone AE (mandatory federal flood insurance); severe wind risk, 99% chance of damaging wind over 30y; extreme-heat days projected 7→29/yr by 2055 (HVAC capex compounding) — expect insurance premiums to compound above CPI over the hold.
Questions for the listing agent
- It's been on market 34 days. Have you received any prior offers? Is the seller open to a 3% concession, seller financing, or rate buy-down credit?
- What's the actual annual flood-insurance premium (NFIP or private), and is the property in a SFHA with mandatory coverage?
- Is there a deadline driving the sale (1031 exchange, divorce, estate, relocation)? That informs how much negotiation room exists.
- Schools are B-rated — typically a magnet for longer-tenancy family renters. What's the average tenant stay here, and is there a school-zone premium baked into asking?
- What's the average days-on-market for RENTAL listings here right now (not sales)? A rising rental-DOM trend means longer vacancies and softer asking-rent achievability than the comps imply.
- What's the recent tenant-quality profile in this submarket — average credit score on applications, eviction rate, late-payment / NSF rate, and stable-employment percentage? A property-management company in the area should have these aggregated.
- How much new for-sale + rental construction is in the pipeline within 1–3 miles? Heavy new supply typically softens prices + rents 12–24 months out; constrained supply supports both.
Investment metrics
- 1% rule
- 1.08% ✓
- Cap rate
- 8.90%
- Cash-on-cash
- 9.32%
- DSCR
- 1.41
- GRM
- 7.7
CMA / ARV
- ARV (on-the-fly)
- $1,245,412
- Comps found
- 4
Show comp detail 4 sales within ~0.75 mi
| Address | Dist | Beds/Ba | Sqft | Sold | Price | $/sf | Match |
|---|---|---|---|---|---|---|---|
| 5342 Del Monte Ct | 0.28mi | 3/2.5 | 2,233 (-5%) | 11mo | $1,189,000 | $532 | 68 |
| 5338 Del Monte Ct | 0.29mi | 3/3.0 | 2,622 (+12%) | 2mo | $1,475,000 | $563 | 65 |
| 441 Bayshore Dr | 0.52mi | 3/2.0 | 2,098 (-10%) | 5mo | $540,000 | $257 | 50 |
| 5718 Driftwood Pkwy | 0.46mi | 4/2.0 (+1) | 2,076 (-11%) | 17mo | $900,000 | $434 | 36 |
Match score weights: distance 35% · size 25% · config 20% · recency 20%. Top-matched comps best support the ARV.
Projected returns pro-forma
-3.0% appreciation · 0.0% rent growth · sell at horizon
- IRR
- -11.4%
- Equity multiple
- 0.60×
- Total profit
- $-53,151
- Equity at exit
- $70,675
- IRR
- -7.5%
- Equity multiple
- 0.59×
- Total profit
- $-53,976
- Equity at exit
- $40,983
Cash invested: $132,720 (down + closing). Projections, not guarantees.
Landlord ↔ Tenant lean methodology
- Overall (STATE)
- 87 Strongly Landlord-Friendly
- State Florida
- 87 Strongly Landlord-Friendly · R+3
- County
- — inherits STATE
- City
- — inherits STATE
ZIP-level market 33904
- Rents YoY
- -5.5%
- Active inventory
- 820
- Price-to-rent
- 7.7×
Monthly cashflow live
- Estimated rent
- $5,118 high interval (Pro) →
- Mortgage (P&I)
- −$2,486
- Tax from tax record
- −$329 /mo · $3,948/yr
- Insurance
- −$198
- Flood insurance flood zone
- −$427 /mo · $5,118/yr
- HOA
- −$0
- Vacancy / Maint / Mgmt
- −$1,075
- Net cashflow
- $604
Break-even live
UW: 25.0% down · 7.5% · 30yr · 1.5% tax · 5.0% vac · 8.0% maint · 8.0% mgmt
Financing live
Cash to close
- Down payment
- $118,500
- Closing costs
- $14,220
- Reserves months
- —
- Total cash needed
- —
Loan-product check · same deal, 3 products live
Conventional
25% down · 7.5% · 30yr
- Down + closing
- —
- Monthly P&I
- —
- Monthly cashflow
- —
- DSCR
- —
- Eligible?
- —
Personal DTI + credit; lowest rate.
DSCR
20% down · 8.5% · 30yr
- Down + closing
- —
- Monthly P&I
- —
- Monthly cashflow
- —
- DSCR
- —
- Eligible?
- —
No personal income docs; deal must DSCR.
Hard money
10% down · 12.0% · 12mo
- Down + closing
- —
- Monthly P&I
- —
- Monthly cashflow
- —
- DSCR
- —
- Eligible?
- —
Short-term bridge; refi at stabilization.
Rent comps 12 comps
| Address | Beds | Baths | Sqft | Rent | $/sqft | DOM | Units | Dist |
|---|---|---|---|---|---|---|---|---|
| 5240 Tower Dr Cape Coral, FL | 4.0 | 2.5 | 2337 | $8,380 | $3.59 | 24d | 1 | 0.60mi |
| 5211 Pocatella Ct Cape Coral, FL | 4.0 | 3.0 | 2322 | $4,500 | $1.94 | 24d | 1 | 0.71mi |
| 1424 Windsor Ct Cape Coral, FL | 3.0 | 2.0 | 1957 | $7,500 | $3.83 | 24d | 1 | 0.92mi |
| 134 SW 57th Ter Cape Coral, FL | 3.0 | 2.0 | 1951 | $5,000 | $2.56 | 24d | 1 | 1.07mi |
| 309 Tarpon Dr Unit A Cape Coral, FL | 3.0 | 2.0 | 2628 | $1,650 | $0.63 | 24d | 1 | 1.07mi |
| 129 SW 54th Ter Cape Coral, FL | 4.0 | 3.0 | 2490 | $5,000 | $2.01 | 14d | 1 | 1.09mi |
| 712 SE 47th St Unit Left Side Cape Coral, FL | 2.0 | 1.0 | 1740 | $1,800 | $1.03 | 14d | 1 | 1.27mi |
| 14815 Laguna Dr #103 Fort Myers, FL | 3.0 | 3.0 | 1857 | $4,100 | $2.21 | 3d | 1 | 1.37mi |
| 11620 Court of Palms #403 Fort Myers, FL | 3.0 | 2.5 | 2510 | $10,000 | $3.98 | 3d | 1 | 1.37mi |
| 11600 Court of Palms #506 Fort Myers, FL | 2.0 | 3.0 | 2550 | $2,799 | $1.10 | 3d | 1 | 1.37mi |
| 11600 Court of Palms #506 Fort Myers, FL | 2.0 | 3.0 | 2550 | $2,799 | $1.10 | 24d | 1 | 1.37mi |
| 14819 Laguna Dr #501 Fort Myers, FL | 3.0 | 2.5 | 1857 | $5,000 | $2.69 | 19d | 1 | 1.44mi |
Listing history 7 events
-
2026-05-08status Pending
-
2026-04-27price $474,000
-
2026-04-04$485,000 Active
-
2008-03-05soldstatus $395,000
-
2008-03-03soldstatus $395,000 1029-char remark
Show marketing remark (1029 chars)
HIGHLY DESIREABLE CORAL DRIVE IN THE PRESTIGEOUS YACHT CLUB AREA!MILES OF BREATHTAKING VIEWS OF THE CALOOSAHATCHEE RIVER on a street lined w/ ROYAL PALMS!GAZE OUT FROM YOUR 8' X 56' 2nd FLOOR DECK, SCREENED DECK, MASTER BED, FAMILY RM OR GUEST ROOM. ENJOY THE SURISE, SUNSET OR THE GLITTERING MOONLIT RIVER. HUGE!VERY PRIVATE TROPICAL POOL, LANAI. THIS HOME HAS CHARACTER AND OPEN SPACE WITH 3800 Sq. Ft. UNDER TRUSS & 5176 TOTAL Sq. Ft. A MILLION DOLLAR FEELING & NEIGHBORHOOD WITHOUT PAYING RIVER FRONT PROPERTY, TAXES OR INSURANCE. THE UPSTAIRS FAMILY ROOM IS SO HUGE THAT YOU CAN EASILY CONVERT A PORTION OF IT INTO A 4TH BEDROOM. ADDITIONAL FEATURES INCLUDE BOSE STEREO SYS. THROUGHOUT, ELECTRIC ROLL OUT CANOPY, DUAL WATER, BUILT IN MURPHY BED WITH OFFICE. THIS NEWER HOME HAS A 9.8 FT ELEVATION, HIP ROOF, MIAMI CODE HURRICANE PANELS & STRUCTUALLY FORTIFIED WHICH ALLOWS LOW HOMEOWNERS INSURANCE. INSPECTED BY MY SAFE FLORIDA HOMES. ALL ASSESSMENTS PAID. HOME WARRANTY. CREATIVE FINANCING FOR EU MEMBERS.
-
2008-02-12price $427,000 1029-char remark
Show marketing remark (1029 chars)
HIGHLY DESIREABLE CORAL DRIVE IN THE PRESTIGEOUS YACHT CLUB AREA!MILES OF BREATHTAKING VIEWS OF THE CALOOSAHATCHEE RIVER on a street lined w/ ROYAL PALMS!GAZE OUT FROM YOUR 8' X 56' 2nd FLOOR DECK, SCREENED DECK, MASTER BED, FAMILY RM OR GUEST ROOM. ENJOY THE SURISE, SUNSET OR THE GLITTERING MOONLIT RIVER. HUGE!VERY PRIVATE TROPICAL POOL, LANAI. THIS HOME HAS CHARACTER AND OPEN SPACE WITH 3800 Sq. Ft. UNDER TRUSS & 5176 TOTAL Sq. Ft. A MILLION DOLLAR FEELING & NEIGHBORHOOD WITHOUT PAYING RIVER FRONT PROPERTY, TAXES OR INSURANCE. THE UPSTAIRS FAMILY ROOM IS SO HUGE THAT YOU CAN EASILY CONVERT A PORTION OF IT INTO A 4TH BEDROOM. ADDITIONAL FEATURES INCLUDE BOSE STEREO SYS. THROUGHOUT, ELECTRIC ROLL OUT CANOPY, DUAL WATER, BUILT IN MURPHY BED WITH OFFICE. THIS NEWER HOME HAS A 9.8 FT ELEVATION, HIP ROOF, MIAMI CODE HURRICANE PANELS & STRUCTUALLY FORTIFIED WHICH ALLOWS LOW HOMEOWNERS INSURANCE. INSPECTED BY MY SAFE FLORIDA HOMES. ALL ASSESSMENTS PAID. HOME WARRANTY. CREATIVE FINANCING FOR EU MEMBERS.
-
2004-11-08soldstatus $342,000
ⓘ Source: listings_history table (triggers on properties + properties_extension) + one-shot
backfill from property_details.listing_events for pre-trigger history.
Tax reassessment forecast FL · Resets to sale price
- Current annual tax
- $3,948 · $329/mo
- Projected year-2 tax
- $3,948 · $329/mo
- Expected delta
- $0/yr ($0/mo · 0.0%)
ⓘ Screening estimate from a state-policy table — verify with the county assessor before closing.
Climate risk First Street
- Flood 8/10 Severe FEMA zone AE · 99% chance over 30 yrs
- Wildfire 1/10 Low
- Heat 10/10 Extreme 7 d/yr ≥107°F today · 29 d/yr by 30 yrs out
- Wind 10/10 Extreme 99% chance of damaging wind over 30 yrs
- Air quality 2/10 Low 1 unhealthy d/yr today · 1 by 30 yrs out
Nearby sold comps map
Loading sold comps map…
Walkable amenities ~0.75 mi
Loading nearby amenities…
Taxation est. · year 1
- Rental income
- $61,411
- − Mortgage interest
- −$26,551
- − Property taxes
- −$3,948
- − Insurance
- −$7,489
- − Repairs & maintenance
- −$4,913
- − Management
- −$4,913
- − Depreciation
- −$13,789
- Taxable loss
- −$192
- Est. tax savings @ 24.0%
- +$46
- After-tax cash flow
- $7,296/yr
For passive investors: Depreciation is non-cash, so a rental often shows a tax loss while cash-flowing — sheltering income. Rental losses are passive: they offset passive income freely, and up to $25,000/yr can offset ordinary (W-2) income if you actively participate and your MAGI is under $100k (phasing out to $0 by $150k); unused losses carry forward. On sale, claimed depreciation is recaptured at up to 25%, and gains may owe capital-gains tax (a 1031 exchange can defer both). Figures are a year-1 estimate at your 24.0% rate — not tax advice; consult a CPA.
Schools (NCES district)
- District
- Lee
- NCES district ID
- 1201080
- Math proficiency
- 47% ▼ -11.00%
- Reading proficiency
- 50% ▼ -4.00%
- Median HH income
- $49,518
- Composite
- 41.49/100
- National rank
- #3458
- State rank
- #42 of 73 in FL
Livability — Cape Coral
- Score
- 77/100
- State rank
- #208
- US rank
- #3098
Category grades
Schools grade is shown separately in the Schools card above.
Census & demographics
- Census place
- Cape Coral, FL
- County
- Lee County · 788,662 people
- City population
- 217,388
- Metro
- Cape Coral-Fort Myers, FL
- Population (ZIP)
- 33,599
- Household income
- $71,190
- Rent vs Own
- Severe rent burden
- 1182.0
Population outlook (Lee County) Hauer SSP2
- Today (2025)
- 871,946 people
- By 2030
- 955,468 · +9.6%
- By 2040
- 1,113,587 · +27.7%
- By 2050
- 1,256,891 · +44.1%
- By 2075
- 1,560,270 · +78.9%
- By 2100
- 1,726,848 · +98.0%
Race, ethnicity, and origin ACS 2023
- Neighborhood character
- Predominantly White (76%)
- Race & ethnicity
- White 76% Hispanic / Latino 16% Two or more races 11% Black 3% Asian 2%
- Hispanic origin (detail)
- Mexican 2% Puerto Rican 2% Cuban 9%
- Common ancestry
- Romanian 4% Lithuanian 2% Slovak 2%
- Foreign-born
- 14% · Canada, China, Jamaica
- Languages at home
- 82% English-only · Spanish 13% Other Indo-European 1% Chinese 1%
Political lean MEDSL · Lee
- 2024 margin
- Strong R (+28.4) · D 35.5% · R 63.9%
- 2008→2024 swing
- -18.0pp toward R · 2008: -10.4pp · 2024: -28.4pp
- All cycles
- 2024: R+28.4 2020: R+19.2 2016: R+20.4 2012: R+16.6 2008: R+10.4
Not yet ingested
- Civics
- —
Market trends
- HPI YoY
- ▼ -190.05%
- Current HPI
- 266.3458
- Rent YoY
- ▼ -5.48%
- Metro
- Cape Coral-Fort Myers, FL
- State GDP YoY
- ▲ 3.28%
- F500 in state
- 36
Industry mix (Fortune 500 HQ in FL)
| Industry | F500 HQs | Revenue |
|---|---|---|
| Industrial Technology | 2 | $29B |
|
||
| Insurance | 2 | $17B |
|
||
| Retail | 1 | $60B |
|
||
| Technology Distribution | 1 | $58B |
|
||
| Homebuilding | 1 | $35B |
|
||
| Technology Manufacturing | 1 | $35B |
|
||
Price history
+38.6% since first listed7 events — show timeline
- 2026-05-08 Pending — FORTMLS
- 2026-04-27 Price Changed $474,000 FORTMLS
- 2026-04-04 Listed $485,000 FORTMLS
- 2008-03-05 Sold (Public Records) $395,000 Public Records
- 2008-03-03 Sold (MLS) $395,000 FORTMLS
- 2008-02-12 Price Changed $427,000 FORTMLS
- 2004-11-08 Sold (Public Records) $342,000 Public Records
Property tax history
+1.4%/yrLatest (2025): $3,948 · +6.0% YoY. Source: county tax records.
Cash-flow waterfall
monthlySold comps — $/sqft
last 12 mo · ≤1 miLoading sold comps…