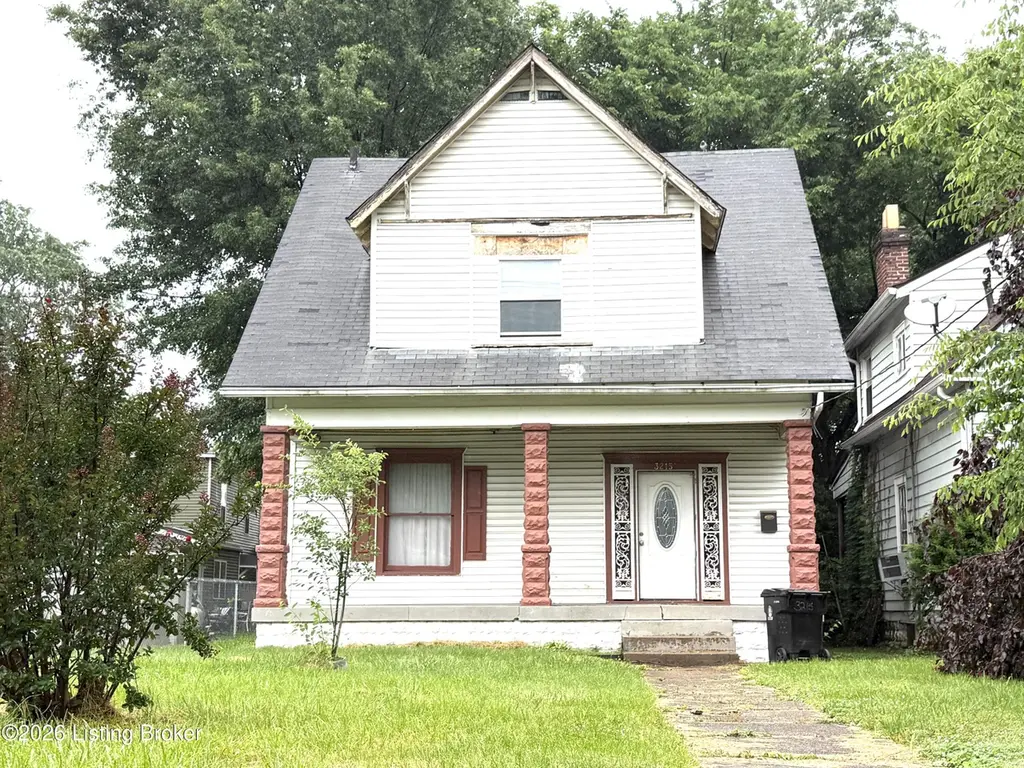
3215 Grand Ave · Louisville, KY
Flood risk 1/10 · Minimal
- FEMA flood zone
- X (shaded)
- Chance of flooding over 30 yrs
- 0.0%
- Est. flood insurance / yr
- $473 – $860
Fire risk 1/10 · Minimal
- Est. fire insurance / yr
- $839 – $1,559
Heat risk 5/10 · Moderate
- Hot days now (above 105°F)
- 7 days/yr
- Hot days in 30 yrs
- 20 days/yr
Wind risk 2/10 · Minimal
- Chance of severe wind over 30 yrs
- 1.0%
Air-quality risk 2/10 · Minimal
- Unhealthy air days now
- 1 days/yr
- Unhealthy air days in 30 yrs
- 3 days/yr
Risk factors via First Street. Map © Google.
Why this score? — see what drove the B+ grade
The composite is a weighted blend of 9 inputs, each scored 0–100. Each bar is that input's sub-score; the figure is the points it added to the 100-point composite (weight × sub-score).
- Cash flow +30.0/30.0
- ARV discount +15.0/15.0
- 1% rule +10.0/10.0
- DSCR +10.0/10.0
- Rent growth +3.7/5.0
- Livability +3.2/5.0
- Condition / age +2.5/5.0
- Schools +2.3/10.0
- Appreciation +0.0/10.0
$79,900
🖨 Deal sheet 📄 Offer letter ✓ Due diligence
Listing remarks
Opportunity awaits in the heart of Louisville! Located on the same block as the childhood home of legendary boxer Muhammad Ali, this property offers incredible potential for investors, renovators, or first-time buyers looking to build equity. Solid potential throughout, the home is ready for someone to bring their vision to life.
Key facts
- 8,400 sq ft lot
- Parking
- Built 1920
Property features AI
Finance
- Other: Lot is cleared; Partial chain-link fencing; Lot dimensions approximately 35 x 240
- HOA & community: No association fee
Exterior
- Parking: Driveway
- Utilities: Electricity connected
- Home design: Single family residence; Traditional style; Two stories
- Construction: Built in 1920; Vinyl siding exterior; Shingle roof; Unfinished below-grade area
- Exterior features: No additional exterior features listed
Interior
- Kitchen: Kitchen on the first floor; Dining area adjacent to the kitchen
- Bedrooms: Three bedrooms located on the second floor
- Bathrooms: One full bathroom on the second floor
- Heating & cooling: Heating present; Central air conditioning (one HVAC unit)
- Interior features: Seven rooms total; Two closets; Foyer on the first floor; Living room on the first floor; Dining room on the first floor; Basement (unfinished)
- Laundry & utility: No first-floor laundry
Neighborhood map
What this means for you Summary
Snapshot
- This is a 3-bed/1.0-bath single-family listed at $80k.
Deal economics
- At list price, monthly cash flow is $462 ($6k/yr) — positive.
- The deal already cash-flows at list — no discount required.
- Meets the 1% rule at list price ($1k rent vs $80k).
- Recommended offer: $79k (1.5% below list) — sets the bar for market timing.
- Cap rate 13.2% vs local median 5.0% in Louisville — top-decile yield for the area; either an underpriced asset or a hidden risk that comps aren't pricing in. Stress-test before assuming the spread holds.
Location & tenants
- Location reads 63/100 on livability (#333 in KY) — a middle-class / working-renter tenant base. Strengths: cost of living A+, housing A+; Watch: employment C-, health & safety D+, schools D-.
- Jefferson County (urban): math 19% / reading 35% proficiency, ranked #121 of 165 in KY (top 73%) — low school quality limits family demand, transient renter base, plan for 1-2y turnover.
- Market conditions: Rents rising fast (+4.9%/yr); 140 active listings in the ZIP; 40 comparable units currently listed for rent nearby; rentals at typical pace (median 24d on market — plan ~3-4 weeks tenant-placement turnaround); lower-income renter base — watch delinquency; 2,836 units permitted in Jefferson County in 2024 (1,558 in 5+ unit buildings).
- At $1,239/mo this rent would consume 47% of the median local household income ($32k/yr) (locally 1483% of renters already pay >50% of income on rent) — very limited rent-growth headroom before tenants either downsize or default.
Forward outlook
- Local home prices are declining (-3.0%/yr); year-one equity from $552 of loan paydown is wiped out by about $2k of value loss. Plan a longer hold.
- Jefferson County population projected at +13% by 2050 — modest demand growth; plan on rents tracking national, not racing it.
- At projected returns (-3.0% appreciation + 4.9% rent growth), your $22k cash investment doubles in ~5 years — after that, you're playing with house money.
Negotiation context
- It's been on market 27 days — a 2% lower offer ($79k) is reasonable based on typical stale-listing flexibility.
Risks & watch-outs
- Watch-outs: built in 1920 — expect roof / HVAC / electrical / plumbing capex.
- Climate carrying-cost: extreme-heat days projected 7→20/yr by 2055 (HVAC capex compounding) — expect insurance premiums to compound above CPI over the hold.
Questions for the listing agent
- Built in 1920 — when were the roof, HVAC, electrical panel, plumbing, and water heater last replaced?
- Is there a deadline driving the sale (1031 exchange, divorce, estate, relocation)? That informs how much negotiation room exists.
- Schools are D-rated, which usually means shorter tenancies and higher turnover. Who's the typical renter profile here, and what's been the actual vacancy rate?
- Crime grade is F in this area — have there been break-ins, vandalism, or insurance claims at this property in the last 3 years? What carrier currently insures it and at what premium?
- What's the average days-on-market for RENTAL listings here right now (not sales)? A rising rental-DOM trend means longer vacancies and softer asking-rent achievability than the comps imply.
- What's the recent tenant-quality profile in this submarket — average credit score on applications, eviction rate, late-payment / NSF rate, and stable-employment percentage? A property-management company in the area should have these aggregated.
- How much new for-sale + rental construction is in the pipeline within 1–3 miles? Heavy new supply typically softens prices + rents 12–24 months out; constrained supply supports both.
Investment metrics
- 1% rule
- 1.55% ✓
- Cap rate
- 13.23%
- Cash-on-cash
- 24.79%
- DSCR
- 2.10
- GRM
- 5.4
CMA / ARV
- ARV (on-the-fly)
- $103,584
- Comps found
- 12
Show comp detail 12 sales within ~0.75 mi
| Address | Dist | Beds/Ba | Sqft | Sold | Price | $/sf | Match |
|---|---|---|---|---|---|---|---|
| 3322 W Kentucky St | 0.18mi | 3/1.0 | 1,296 (+4%) | 2mo | $85,000 | $66 | 83 |
| 3322 Virginia Ave | 0.26mi | 3/1.0 | 1,198 (-4%) | 8mo | $180,000 | $150 | 75 |
| 3212 W Kentucky St | 0.16mi | 2/1.5 (-1) | 1,104 (-12%) | 2mo | $45,000 | $41 | 65 |
| 802 Sutcliffe Ave | 0.50mi | 2/1.0 (-1) | 1,162 (-7%) | 4mo | $110,000 | $95 | 57 |
| 3507 Regatta Way | 0.42mi | 4/2.5 (+1) | 1,303 (+4%) | 6mo | $172,000 | $132 | 57 |
| 1331 S 28th St | 0.57mi | 3/1.5 | 1,152 (-8%) | 6mo | $60,000 | $52 | 54 |
| 865 S 26th St | 0.69mi | 3/1.0 | 1,371 (+10%) | 3mo | $51,999 | $38 | 49 |
| 1419 S 28th St | 0.69mi | 4/2.0 (+1) | 1,203 (-4%) | 6mo | $100,000 | $83 | 48 |
| 1412 Beech St | 0.55mi | 2/1.5 (-1) | 1,127 (-10%) | 4mo | $90,000 | $80 | 47 |
| 1415 S 28th St | 0.68mi | 3/2.0 | 1,384 (+11%) | 2mo | $190,000 | $137 | 45 |
| 722 S 37th St | 0.59mi | 2/1.0 (-1) | 1,092 (-12%) | 4mo | $46,000 | $42 | 43 |
| 1504 Weaver Ct | 0.72mi | 4/2.0 (+1) | 1,104 (-12%) | 5mo | $105,000 | $95 | 34 |
Match score weights: distance 35% · size 25% · config 20% · recency 20%. Top-matched comps best support the ARV.
Projected returns pro-forma
-3.0% appreciation · 4.87% rent growth · sell at horizon
- IRR
- 20.2%
- Equity multiple
- 1.84×
- Total profit
- $18,856
- Equity at exit
- $11,913
- IRR
- 29.6%
- Equity multiple
- 3.88×
- Total profit
- $64,431
- Equity at exit
- $6,908
Cash invested: $22,372 (down + closing). Projections, not guarantees.
Landlord ↔ Tenant lean methodology
- Overall (STATE)
- 83 Strongly Landlord-Friendly
- State Kentucky
- 83 Strongly Landlord-Friendly · R+16
- County
- — inherits STATE
- City
- — inherits STATE
ZIP-level market 40211
- Home prices YoY
- -33.4%
- Rents YoY
- 4.9%
- Active inventory
- 140
- Price-to-rent
- 5.4×
Monthly cashflow live
- Estimated rent
- $1,239 high interval (Pro) →
- Mortgage (P&I)
- −$419
- Tax from tax record
- −$65 /mo · $775/yr
- Insurance
- −$33
- HOA
- −$0
- Vacancy / Maint / Mgmt
- −$260
- Net cashflow
- $462
Break-even live
UW: 25.0% down · 7.5% · 30yr · 1.5% tax · 5.0% vac · 8.0% maint · 8.0% mgmt
Financing live
Cash to close
- Down payment
- $19,975
- Closing costs
- $2,397
- Reserves months
- —
- Total cash needed
- —
Loan-product check · same deal, 3 products live
Conventional
25% down · 7.5% · 30yr
- Down + closing
- —
- Monthly P&I
- —
- Monthly cashflow
- —
- DSCR
- —
- Eligible?
- —
Personal DTI + credit; lowest rate.
DSCR
20% down · 8.5% · 30yr
- Down + closing
- —
- Monthly P&I
- —
- Monthly cashflow
- —
- DSCR
- —
- Eligible?
- —
No personal income docs; deal must DSCR.
Hard money
10% down · 12.0% · 12mo
- Down + closing
- —
- Monthly P&I
- —
- Monthly cashflow
- —
- DSCR
- —
- Eligible?
- —
Short-term bridge; refi at stabilization.
Rent comps 40 comps
| Address | Beds | Baths | Sqft | Rent | $/sqft | DOM | Units | Dist |
|---|---|---|---|---|---|---|---|---|
| 1115 S 32nd St Louisville, KY | 3.0 | 1.0 | 1393 | $1,275 | $0.92 | 21d | 1 | 0.09mi |
| 1115 S 32nd St Louisville, KY | 3.0 | 1.0 | 1393 | $1,275 | $0.92 | 23d | 1 | 0.09mi |
| 3122 W Kentucky St Louisville, KY | 3.0 | 1.0 | 1030 | $1,150 | $1.12 | 23d | 1 | 0.17mi |
| 3215 Virginia Ave Louisville, KY | 3.0 | 1.0 | 975 | $924 | $0.95 | 23d | 1 | 0.21mi |
| 1145 Louis Coleman Jr Dr Louisville, KY | 2.0 | 1.0 | 913 | $875 | $0.96 | 23d | 1 | 0.22mi |
| 2912 Greenwood Ave Louisville, KY | 3.0 | 2.0 | 1362 | $1,150 | $0.84 | 16d | 1 | 0.28mi |
| 3514 Grand Ave Louisville, KY | 3.0 | 1.5 | 1450 | $1,295 | $0.89 | 21d | 1 | 0.28mi |
| 832 Hazel St Louisville, KY | 2.0 | 1.0 | 720 | $1,095 | $1.52 | 3d | 1 | 0.29mi |
| 2825 Greenwood Ave #2 Louisville, KY | 2.0 | 1.0 | 1300 | $995 | $0.77 | 23d | 1 | 0.34mi |
| 2825 Greenwood Ave #4 Louisville, KY | 3.0 | 1.0 | 1440 | $1,250 | $0.87 | 23d | 1 | 0.34mi |
| 2821 Greenwood Ave #1 Louisville, KY | 3.0 | 1.0 | 1113 | $1,300 | $1.17 | 23d | 1 | 0.35mi |
| 814 S 33rd St Louisville, KY | 3.0 | 1.0 | 1104 | $1,350 | $1.22 | 3d | 1 | 0.37mi |
| 2913 Dumesnil St Apt 3 Louisville, KY | 3.0 | 1.0 | 1112 | $740 | $0.67 | 10d | 1 | 0.41mi |
| 803 S 35th St Louisville, KY | 3.0 | 1.0 | 1486 | $1,350 | $0.91 | 23d | 1 | 0.43mi |
| 737 S 33rd St Louisville, KY | 4.0 | 1.0 | 1356 | $1,595 | $1.18 | 23d | 1 | 0.45mi |
| 1155 S 28th St Unit 4 Louisville, KY | 4.0 | 2.0 | 1010 | $1,350 | $1.34 | 23d | 1 | 0.45mi |
| 2708 Greenwood Ave Apt 1 Louisville, KY | 3.0 | 1.0 | 1100 | $1,300 | $1.18 | 23d | 1 | 0.48mi |
| 2710 W Kentucky St Apt 2 Louisville, KY | 3.0 | 1.0 | 1015 | $1,300 | $1.28 | 23d | 1 | 0.49mi |
| 2724 Garland Ave Unit 202 Louisville, KY | 2.0 | 1.0 | 950 | $745 | $0.78 | 3d | 1 | 0.50mi |
| 2711 W Kentucky St Louisville, KY | 3.0 | 1.0 | 1155 | $1,100 | $0.95 | 23d | 1 | 0.51mi |
| 2706 Hale Ave Unit 2 Louisville, KY | 2.0 | 1.0 | 900 | $1,250 | $1.39 | 23d | 1 | 0.52mi |
| 2706 Hale Ave Unit 1 Louisville, KY | 3.0 | 1.0 | 1100 | $1,400 | $1.27 | 23d | 1 | 0.52mi |
| 701 Hazel St Unit 3 Louisville, KY | 2.0 | 1.0 | 832 | $800 | $0.96 | 10d | 1 | 0.54mi |
| 3611 Regatta Way Louisville, KY | 3.0 | 1.0 | 1035 | $1,450 | $1.40 | 16d | 1 | 0.55mi |
| 823 S 38th St Louisville, KY | 3.0 | 1.0 | 1100 | $1,195 | $1.09 | 3d | 1 | 0.56mi |
| 2634 Garland Ave Unit B Louisville, KY | 3.0 | 1.0 | 1152 | $895 | $0.78 | 20d | 1 | 0.57mi |
| 2634 Garland Ave Unit A Louisville, KY | 3.0 | 1.0 | 1152 | $940 | $0.82 | 23d | 1 | 0.57mi |
| 1418 Beech St Unit 2 Louisville, KY | 2.0 | 1.0 | 1000 | $980 | $0.98 | 21d | 1 | 0.58mi |
| 1339 S 28th St Unit 3 Louisville, KY | 3.0 | 1.0 | 1125 | $1,175 | $1.04 | 20d | 1 | 0.59mi |
| 2614 Virginia Ave Louisville, KY | 2.0 | 1.0 | 975 | $925 | $0.95 | 23d | 1 | 0.62mi |
| 666 Eastlawn Ave Louisville, KY | 2.0 | 1.0 | 936 | $895 | $0.96 | 16d | 1 | 0.63mi |
| 1439 Beech St Apt 1 Louisville, KY | 3.0 | 1.5 | 1000 | $820 | $0.82 | 23d | 1 | 0.63mi |
| 729 S 39th St Unit 1 Louisville, KY | 2.0 | 1.0 | 800 | $800 | $1.00 | 23d | 1 | 0.69mi |
| 833 S 41st St Louisville, KY | 3.0 | 2.0 | 786 | $1,250 | $1.59 | 23d | 1 | 0.75mi |
| 2416 Garland Ave Louisville, KY | 3.0 | 2.0 | 1172 | $1,600 | $1.37 | 23d | 1 | 0.76mi |
| 652 S 37th St #9 Louisville, KY | 3.0 | 1.0 | 1070 | $1,095 | $1.02 | 23d | 1 | 0.77mi |
| 2733 Chase Ct Louisville, KY | 2.0 | 1.0 | 900 | $900 | $1.00 | 16d | 1 | 0.77mi |
| 836 S 41st St Louisville, KY | 3.0 | 1.0 | 1300 | $1,300 | $1.00 | 19d | 1 | 0.78mi |
| 648 S 37th St #3 Louisville, KY | 2.0 | 1.0 | 807 | $850 | $1.05 | 23d | 1 | 0.79mi |
| 714 S 40th St #2 Louisville, KY | 3.0 | 1.0 | 1000 | $1,250 | $1.25 | 23d | 1 | 0.80mi |
Listing history 14 events
-
2026-06-18days on market $79,900 Active 27 DOM
-
2026-06-17days on market $79,900 Active 26 DOM
-
2026-06-16days on market $79,900 Active 25 DOM
-
2026-06-15days on market $79,900 Active 24 DOM
-
2026-06-13pricedays on market $79,900 Active 22 DOM
-
2026-06-10days on market $94,500 Active 19 DOM
-
2026-06-09days on market $94,500 Active 18 DOM
-
2026-06-08days on market $94,500 Active 17 DOM
-
2026-06-07days on market $94,500 Active 16 DOM
-
2026-06-03days on market $94,500 Active 12 DOM
-
2026-06-02pricedays on market $94,500 Active 11 DOM
-
2026-06-01days on market $99,900 Active 10 DOM
-
2026-05-31days on market $99,900 Active 9 DOM
-
2026-05-22$99,900 Active
ⓘ Source: listings_history table (triggers on properties + properties_extension) + one-shot
backfill from property_details.listing_events for pre-trigger history.
Tax reassessment forecast KY · Resets to sale price
- Current annual tax
- $775 · $65/mo
- Projected year-2 tax
- $775 · $65/mo
- Expected delta
- $0/yr ($0/mo · 0.0%)
ⓘ Screening estimate from a state-policy table — verify with the county assessor before closing.
Climate risk First Street
- Flood 1/10 Low FEMA zone X (shaded) · 0% chance over 30 yrs
- Wildfire 1/10 Low
- Heat 5/10 Major 7 d/yr ≥105°F today · 20 d/yr by 30 yrs out
- Wind 2/10 Low 100% chance of damaging wind over 30 yrs
- Air quality 2/10 Low 1 unhealthy d/yr today · 3 by 30 yrs out
Nearby sold comps map
Loading sold comps map…
Walkable amenities ~0.75 mi
Loading nearby amenities…
Taxation est. · year 1
- Rental income
- $14,870
- − Mortgage interest
- −$4,476
- − Property taxes
- −$775
- − Insurance
- −$400
- − Repairs & maintenance
- −$1,190
- − Management
- −$1,190
- − Depreciation
- −$2,324
- Taxable income
- $4,517
- Est. tax owed @ 24.0%
- −$1,084
- After-tax cash flow
- $4,461/yr
For passive investors: Depreciation is non-cash, so a rental often shows a tax loss while cash-flowing — sheltering income. Rental losses are passive: they offset passive income freely, and up to $25,000/yr can offset ordinary (W-2) income if you actively participate and your MAGI is under $100k (phasing out to $0 by $150k); unused losses carry forward. On sale, claimed depreciation is recaptured at up to 25%, and gains may owe capital-gains tax (a 1031 exchange can defer both). Figures are a year-1 estimate at your 24.0% rate — not tax advice; consult a CPA.
Schools (NCES district)
- District
- Jefferson County
- NCES district ID
- 2102990
- Math proficiency
- 19% ▼ -17.00%
- Reading proficiency
- 35% ▼ -11.00%
- Median HH income
- $47,885
- Composite
- 23.45/100
- National rank
- #7884
- State rank
- #121 of 165 in KY
Livability — Louisville
- Score
- 63/100
- State rank
- #333
- US rank
- #15887
Category grades
Schools grade is shown separately in the Schools card above.
Census & demographics
- Census place
- Louisville, KY
- County
- Jefferson County · 790,184 people
- City population
- 769,292
- Metro
- Louisville/Jefferson County, KY-IN
- Population (ZIP)
- 20,407
- Household income
- $31,749
- Rent vs Own
- Severe rent burden
- 1483.0
Population outlook (Jefferson County) Hauer SSP2
- Today (2025)
- 823,112 people
- By 2030
- 849,343 · +3.2%
- By 2040
- 895,696 · +8.8%
- By 2050
- 933,630 · +13.4%
- By 2075
- 1,028,262 · +24.9%
- By 2100
- 1,072,675 · +30.3%
Race, ethnicity, and origin ACS 2023
- Neighborhood character
- Predominantly Black (90%)
- Race & ethnicity
- Black 90% White 5% Two or more races 4% Hispanic / Latino 1%
- Common ancestry
- Italian 1%
- Foreign-born
- 1% · Canada
- Languages at home
- 98% English-only · Spanish 1%
Political lean MEDSL · Jefferson
- 2024 margin
- D (+16.6) · D 57.4% · R 40.9% · Other 1.7%
- 2008→2024 swing
- +4.5pp toward D · 2008: 12.0pp · 2024: 16.6pp
- All cycles
- 2024: D+16.6 2020: D+20.1 2016: D+13.3 2012: D+11.1 2008: D+12.0
Not yet ingested
- Civics
- —
Market trends
- HPI YoY
- ▼ -88.22%
- Current HPI
- 176.337
- Rent YoY
- ▲ 4.87%
- Metro
- Louisville/Jefferson County, KY-IN
- State GDP YoY
- ▲ 1.81%
- F500 in state
- 4
Industry mix (Fortune 500 HQ in KY)
| Industry | F500 HQs | Revenue |
|---|---|---|
| Healthcare | 1 | $118B |
|
||
| Food / Beverage | 1 | $7B |
|
||
Price history
1 event — show timeline
- 2026-05-22 Listed $99,900 Metro Search MLS
Property tax history
+6.5%/yrLatest (2025): $775 · -1.9% YoY. Source: county tax records.
Cash-flow waterfall
monthlySold comps — $/sqft
last 12 mo · ≤1 miLoading sold comps…