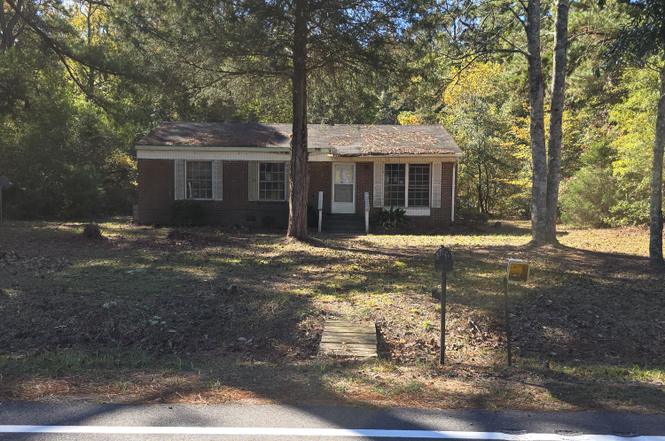
1090 Salters Town Rd · East Sumter, SC
Flood risk 1/10 · Minimal
- FEMA flood zone
- X (unshaded)
- Chance of flooding over 30 yrs
- 0.0%
- Est. flood insurance / yr
- $507 – $1,088
Fire risk 6/10 · Moderate
- Est. fire insurance / yr
- $783 – $1,453
Heat risk 6/10 · Moderate
- Hot days now (above 107°F)
- 7 days/yr
- Hot days in 30 yrs
- 16 days/yr
Wind risk 8/10 · Major
- Chance of severe wind over 30 yrs
- 80.0%
Air-quality risk 2/10 · Minimal
- Unhealthy air days now
- 2 days/yr
- Unhealthy air days in 30 yrs
- 2 days/yr
Risk factors via First Street. Map © Google.
Why this score? — see what drove the B grade
The composite is a weighted blend of 9 inputs, each scored 0–100. Each bar is that input's sub-score; the figure is the points it added to the 100-point composite (weight × sub-score).
- Cash flow +30.0/30.0
- ARV discount +15.0/15.0
- DSCR +10.0/10.0
- 1% rule +8.8/10.0
- Livability +2.8/5.0
- Rent growth +2.5/5.0
- Condition / age +2.5/5.0
- Schools +1.9/10.0
- Appreciation +0.0/10.0
$79,900
🖨 Deal sheet (PDF) 📄 Offer letter ✓ Due diligence
Listing remarks
If Peace and Quiet Is What You Desire, Look No Further! This Charming 3 Bedroom, 1 Bath Brick Home Is Situated on a 1 Acre Lot For $82,900. This Property Offers the Perfect Balance of Privacy and Convenience. Located Just Minutes from Highway 378, Providing Easy Access to Interstate 95, The DMV, Schools, Shopping, And Houses of Worship. Enjoy Country Living at Its Best, Giving You Unlimited Possibilities to Add Your Personal Touch and Make It Truly Your Own. This Rural Gem Won't Last Long Schedule Your Showing Today and Discover the Potential Waiting for You! This Home Is Being Sold As-Is, Where-Is.
Key facts
- 1 acre lot
- 1 acre lot
- Built 1970
Tags
Property features AI
Exterior
- Utilities: Public water available; Other water source; Septic tank; Sewer available; Electricity available; Cable available
- Home design: Single-family house; One story; Residential property; Has view
- Construction: Brick construction
- Exterior features: Shingle roof; Shed(s); Other outbuilding
Interior
- Kitchen: Range; Refrigerator; Exhaust fan
- Flooring: Carpet; Vinyl; Other
- Bathrooms: 1 full bathroom
- Heating & cooling: Heat pump for heating; Heat pump for cooling
- Interior features: Exhaust fan; Range; Refrigerator
Neighborhood map
What this means for you Summary
Snapshot
- This is a 3-bed/1.0-bath single-family listed at $80k.
Deal economics
- At list price, monthly cash flow is $329 ($4k/yr) — positive.
- The deal already cash-flows at list — no discount required.
- Meets the 1% rule at list price ($1k rent vs $80k).
- Recommended offer: $70k (12.0% below list) — sets the bar for market timing.
Location & tenants
- Location reads 56/100 on livability (#287 in SC) — a working-class tenant base; expect higher turnover. Strengths: cost of living A+, crime B+; Watch: amenities F, commute F, employment F.
- Sumter 01 (urban): math 18% / reading 28% proficiency, ranked #64 of 80 in SC (top 80%) — low school quality limits family demand, transient renter base, plan for 1-2y turnover; 64% free/reduced lunch — lower-income household profile, screen leases tightly.
- Zoned schools: Lemira Elementary (math 8% / reading 12%, grade F, #587 of 597 statewide, top 99%, 402 students, 100% FRL); Chestnut Oaks Middle (math 3% / reading 17%, grade F, #221 of 229 statewide, top 97%, 396 students, 100% FRL); Sumter High School (math 22% / reading 67%, grade F, #166 of 196 statewide, top 87%, 2,289 students, 100% FRL) — zoned schools average 100% FRL vs 64% district-wide (36 pts higher); higher-poverty schools than district average — tighter screening recommended.
- Market conditions: 216 active listings in the ZIP; 386 units permitted in Sumter County in 2024 (0 in 5+ unit buildings).
Forward outlook
- Local home prices are declining (-3.0%/yr); year-one equity from $552 of loan paydown is wiped out by about $2k of value loss. Plan a longer hold.
- Sumter County population projected at -14% by 2050 — secular population decline; favor cash flow + early exit over multi-decade hold.
- At projected returns (-3.0% appreciation + 3.0% rent growth), your $22k cash investment doubles in ~7 years — after that, you're playing with house money.
Negotiation context
- It's been on market 215 days — a 12% lower offer ($70k) is reasonable based on typical stale-listing flexibility.
- 3 sale attempts with the ask held roughly flat each time — persistent listings suggest the price (not the market) is what's stuck; bring a comps-based counter.
Risks & watch-outs
- Climate carrying-cost: severe wind risk, 80% chance of damaging wind over 30y; major wildfire risk; extreme-heat days projected 7→16/yr by 2055 (HVAC capex compounding) — expect insurance premiums to compound above CPI over the hold.
Questions for the listing agent
- It's been on market 215 days. Have you received any prior offers? Is the seller open to a 12% concession, seller financing, or rate buy-down credit?
- Built in 1970 — when were the roof, HVAC, electrical panel, plumbing, and water heater last replaced?
- Why hasn't it sold? Are there any deal-killer items the seller is aware of (foundation, flood, title, zoning, code violations)?
- Is there a deadline driving the sale (1031 exchange, divorce, estate, relocation)? That informs how much negotiation room exists.
- Schools are F-rated, which usually means shorter tenancies and higher turnover. Who's the typical renter profile here, and what's been the actual vacancy rate?
- What's the average days-on-market for RENTAL listings here right now (not sales)? A rising rental-DOM trend means longer vacancies and softer asking-rent achievability than the comps imply.
- What's the recent tenant-quality profile in this submarket — average credit score on applications, eviction rate, late-payment / NSF rate, and stable-employment percentage? A property-management company in the area should have these aggregated.
- How much new for-sale + rental construction is in the pipeline within 1–3 miles? Heavy new supply typically softens prices + rents 12–24 months out; constrained supply supports both.
Investment metrics
- 1% rule
- 1.38% ✓
- Cap rate
- 11.24%
- Cash-on-cash
- 17.67%
- DSCR
- 1.79
- GRM
- 6.1
CMA / ARV
- ARV (on-the-fly)
- $137,550
- Comps found
- 2
Show comp detail 2 sales within ~0.75 mi
| Address | Dist | Beds/Ba | Sqft | Sold | Price | $/sf | Match |
|---|---|---|---|---|---|---|---|
| 1435 Salterstown Rd | 0.65mi | 4/1.0 (+1) | 1,115 (+6%) | 6mo | $72,000 | $65 | 49 |
| 576 Harriett Rd | 0.56mi | 3/1.0 | 956 (-9%) | 17mo | $124,900 | $131 | 45 |
Match score weights: distance 35% · size 25% · config 20% · recency 20%. Top-matched comps best support the ARV.
Projected returns pro-forma
-3.0% appreciation · 3.0% rent growth · sell at horizon
- IRR
- 9.1%
- Equity multiple
- 1.36×
- Total profit
- $8,043
- Equity at exit
- $11,913
- IRR
- 18.3%
- Equity multiple
- 2.52×
- Total profit
- $34,056
- Equity at exit
- $6,908
Cash invested: $22,372 (down + closing). Projections, not guarantees.
Landlord ↔ Tenant lean methodology
- Overall (STATE)
- 90 Strongly Landlord-Friendly
- State South Carolina
- 90 Strongly Landlord-Friendly · R+6
- County
- — inherits STATE
- City
- — inherits STATE
ZIP-level market 29153
- Active inventory
- 216
- Price-to-rent
- 6.1×
Monthly cashflow live
- Estimated rent
- $1,100 medium interval (Pro) →
- Mortgage (P&I)
- −$419
- Tax from tax record
- −$87 /mo · $1,050/yr
- Insurance
- −$33
- HOA
- −$0
- Vacancy / Maint / Mgmt
- −$231
- Net cashflow
- $329
Break-even live
Sensitivity live
| Price | -10% $375 | -5% $352 | +0% $329 | +5% $307 | +10% $284 |
|---|---|---|---|---|---|
| Rent | -10% $242 | -5% $286 | +0% $329 | +5% $373 | +10% $416 |
| Rate | -1.0pp $370 | -0.5pp $350 | base $329 | +0.5pp $309 | +1.0pp $288 |
UW: 25.0% down · 7.5% · 30yr · 1.5% tax · 5.0% vac · 8.0% maint · 8.0% mgmt
Financing live
Cash to close
- Down payment
- $19,975
- Closing costs
- $2,397
- Reserves months
- —
- Total cash needed
- —
Loan-product check · same deal, 3 products live
Conventional
25% down · 7.5% · 30yr
- Down + closing
- —
- Monthly P&I
- —
- Monthly cashflow
- —
- DSCR
- —
- Eligible?
- —
Personal DTI + credit; lowest rate.
DSCR
20% down · 8.5% · 30yr
- Down + closing
- —
- Monthly P&I
- —
- Monthly cashflow
- —
- DSCR
- —
- Eligible?
- —
No personal income docs; deal must DSCR.
Hard money
10% down · 12.0% · 12mo
- Down + closing
- —
- Monthly P&I
- —
- Monthly cashflow
- —
- DSCR
- —
- Eligible?
- —
Short-term bridge; refi at stabilization.
Listing history 20 events
-
2026-06-19days on market $79,900 Active 215 DOM
-
2026-06-18days on market $79,900 Active 214 DOM
-
2026-06-17days on market $79,900 Active 213 DOM
-
2026-06-16days on market $79,900 Active 212 DOM
-
2026-06-15days on market $79,900 Active 211 DOM
-
2026-06-14days on market $79,900 Active 209 DOM
-
2026-06-13days on market $79,900 Active 208 DOM
-
2026-06-10days on market $79,900 Active 206 DOM
-
2026-06-09days on market $79,900 Active 205 DOM
-
2026-06-08days on market $79,900 Active 204 DOM
-
2026-06-07days on market $79,900 Active 203 DOM
-
2026-06-02days on market $79,900 Active 198 DOM
-
2026-06-01days on market $79,900 Active 197 DOM
-
2026-05-31days on market $79,900 Active 196 DOM
-
2026-05-30days on market $79,900 Active 195 DOM
-
2026-02-16price $79,900
-
2026-01-07price $82,900
-
2025-11-14$83,500 Active
-
2025-05-23$94,900 Active
-
2025-04-04$99,900 Active
ⓘ Source: listings_history table (triggers on properties + properties_extension) + one-shot
backfill from property_details.listing_events for pre-trigger history.
Tax reassessment forecast SC · Resets to sale price
- Current annual tax
- $1,050 · $87/mo
- Projected year-2 tax
- $1,050 · $87/mo
- Expected delta
- $0/yr ($0/mo · 0.0%)
ⓘ Screening estimate from a state-policy table — verify with the county assessor before closing.
Climate risk First Street
- Flood 1/10 Low FEMA zone X (unshaded) · 0% chance over 30 yrs
- Wildfire 6/10 Major
- Heat 6/10 Major 7 d/yr ≥107°F today · 16 d/yr by 30 yrs out
- Wind 8/10 Severe 80% chance of damaging wind over 30 yrs
- Air quality 2/10 Low 2 unhealthy d/yr today · 2 by 30 yrs out
Nearby sold comps map
Loading sold comps map…
Walkable amenities ~0.75 mi
Loading nearby amenities…
Taxation est. · year 1
- Rental income
- $13,203
- − Mortgage interest
- −$4,476
- − Property taxes
- −$1,050
- − Insurance
- −$400
- − Repairs & maintenance
- −$1,056
- − Management
- −$1,056
- − Depreciation
- −$2,324
- Taxable income
- $2,841
- Est. tax owed @ 24.0%
- −$682
- After-tax cash flow
- $3,271/yr
For passive investors: Depreciation is non-cash, so a rental often shows a tax loss while cash-flowing — sheltering income. Rental losses are passive: they offset passive income freely, and up to $25,000/yr can offset ordinary (W-2) income if you actively participate and your MAGI is under $100k (phasing out to $0 by $150k); unused losses carry forward. On sale, claimed depreciation is recaptured at up to 25%, and gains may owe capital-gains tax (a 1031 exchange can defer both). Figures are a year-1 estimate at your 24.0% rate — not tax advice; consult a CPA.
Schools (NCES district)
- District
- Sumter 01
- NCES district ID
- 4503902
- Math proficiency
- 18% ▼ -13.00%
- Reading proficiency
- 28% ▼ -6.00%
- Median HH income
- $40,423
- Composite
- 19.45/100
- National rank
- #8775
- State rank
- #64 of 80 in SC
Livability — East Sumter
- Score
- 56/100
- State rank
- #287
- US rank
- #22456
Category grades
Schools grade is shown separately in the Schools card above.
Census & demographics
- Population (ZIP)
- 15,101
Population outlook (Sumter County) Hauer SSP2
- Today (2025)
- 104,585 people
- By 2030
- 102,282 · -2.2%
- By 2040
- 96,258 · -8.0%
- By 2050
- 89,592 · -14.3%
- By 2075
- 74,715 · -28.6%
- By 2100
- 60,235 · -42.4%
Race, ethnicity, and origin ACS 2023
- Neighborhood character
- Majority Black (57%)
- Race & ethnicity
- Black 57% White 35% Hispanic / Latino 3% Two or more races 3% Asian 2%
- Common ancestry
- Slovak 1% Serbian 1% Scotch-Irish 1%
- Foreign-born
- 2% · Canada, Vietnam
- Languages at home
- 94% English-only · Spanish 4% Vietnamese 1%
Political lean MEDSL · Sumter
- 2024 margin
- Toss-up / Even · D 51.9% · R 47.0% · Other 1.2%
- 2008→2024 swing
- -10.6pp toward R · 2008: 15.4pp · 2024: 4.9pp
- All cycles
- 2024: D+4.9 2020: D+13.0 2016: D+12.0 2012: D+17.5 2008: D+15.4
Not yet ingested
- Civics
- —
Market trends
- HPI YoY
- ▼ -110.70%
- Current HPI
- 128.7395
- Rent YoY
- —
- Metro
- —
- State GDP YoY
- ▲ 4.51%
- F500 in state
- 2
Industry mix (Fortune 500 HQ in SC)
| Industry | F500 HQs | Revenue |
|---|---|---|
| Packaging | 1 | $7B |
|
||
Price history
-20.0% since first listed5 events — show timeline
- 2026-02-16 Price Changed $79,900 SBOR
- 2026-01-07 Price Changed $82,900 SBOR
- 2025-11-14 Listed $83,500 SBOR
- 2025-05-23 Listed $94,900 SBOR
- 2025-04-04 Listed $99,900 SBOR
Property tax history
+29.7%/yrLatest (2025): $1,050 · +1.0% YoY. Source: county tax records.
Cash-flow waterfall
monthlySold comps — $/sqft
last 12 mo · ≤1 miLoading sold comps…