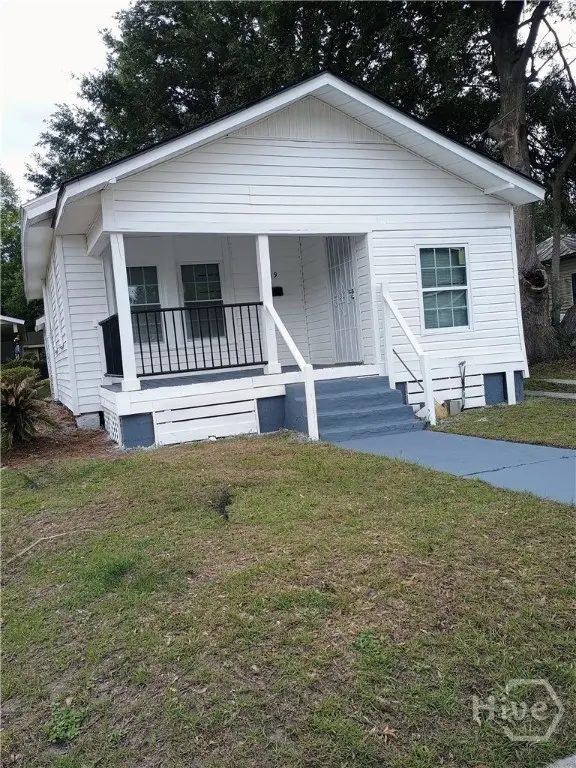
1809 Georgia Ave · Savannah, GA
Flood risk 1/10 · Minimal
- FEMA flood zone
- X (unshaded)
- Chance of flooding over 30 yrs
- 0.0%
- Est. flood insurance / yr
- $507 – $1,088
Fire risk 3/10 · Minor
- Est. fire insurance / yr
- $963 – $1,789
Heat risk 10/10 · Severe
- Hot days now (above 107°F)
- 7 days/yr
- Hot days in 30 yrs
- 18 days/yr
Wind risk 9/10 · Severe
- Chance of severe wind over 30 yrs
- 99.0%
Air-quality risk 2/10 · Minimal
- Unhealthy air days now
- 2 days/yr
- Unhealthy air days in 30 yrs
- 2 days/yr
Risk factors via First Street. Map © Google.
Why this score? — see what drove the C+ grade
The composite is a weighted blend of 9 inputs, each scored 0–100. Each bar is that input's sub-score; the figure is the points it added to the 100-point composite (weight × sub-score).
- Cash flow +21.3/30.0
- ARV discount +15.0/15.0
- DSCR +6.8/10.0
- 1% rule +5.4/10.0
- Livability +4.3/5.0
- Rent growth +3.4/5.0
- Condition / age +2.5/5.0
- Schools +2.0/10.0
- Appreciation +0.0/10.0
$154,500
🖨 Deal sheet (PDF) 📄 Offer letter ✓ Due diligence
Listing remarks
Great 2 Bedroom 1 Bath Bungalow home is minutes from Downtown Savannah, the Islands, and the Beach, quick access to the Truman Parkway, providing easy travel to schools, shopping, dining, and entertainment throughout Savannah. With this location the property makes an excellent primary residence or investment opportunity.
Key facts
- Bungalow home
- 4,356 sq ft lot
- Built 1939
Tags
Property features AI
Finance
- Other: Zoned R6
- HOA & community: Sidewalks
Exterior
- Parking: Off-street parking
- Utilities: Public water; Public sewer; 220V electric; Cable available
- Home design: Single-family residence; One story
- Construction: Vinyl siding
- Exterior features: Front porch; Back yard; City lot; Interior lot; Private lot; Asphalt road access; Publicly maintained road
Interior
- Kitchen: Refrigerator
- Bathrooms: One full bathroom
- Heating & cooling: Central heating (electric); Central air conditioning (electric)
- Interior features: Ceiling fans
- Laundry & utility: Washer hookup; Other laundry connection
Neighborhood map
What this means for you Summary
Snapshot
- This is a 2-bed/1.0-bath single-family listed at $154k.
Deal economics
- At list price, monthly cash flow is $225 ($3k/yr) — positive.
- The deal already cash-flows at list — no discount required.
- Meets the 1% rule at list price ($2k rent vs $154k).
- Recommended offer: $150k (3.0% below list) — sets the bar for market timing.
- Cap rate 8.0% vs local median 4.0% in Savannah — top-decile yield for the area; either an underpriced asset or a hidden risk that comps aren't pricing in. Stress-test before assuming the spread holds.
Location & tenants
- Location reads 86/100 on livability (#1 in GA, #397 nationally) — a professional / high-income tenant draw. Strengths: crime A+, amenities A+, commute A+; Watch: employment D, schools F.
- Savannah-Chatham County (urban): math 20% / reading 26% proficiency, ranked #134 of 174 in GA (top 77%) — low school quality limits family demand, transient renter base, plan for 1-2y turnover.
- Market conditions: Rents rising (+3.6%/yr); 228 active listings in the ZIP; 40 comparable units currently listed for rent nearby; rentals lingering (median 46d on market — plan ~5-8 weeks vacancy on turnover, expect pricing pressure); 55% of comp listings sitting > 30 days — soft ceiling on asking rent; 2,694 units permitted in Chatham County in 2024 (973 in 5+ unit buildings).
- This rent runs 36% of the median local income ($53k/yr) — at the standard rent-burdened threshold; future hikes will face affordability resistance.
Forward outlook
- Local home prices are declining (-3.0%/yr); year-one equity from $1k of loan paydown is wiped out by about $5k of value loss. Plan a longer hold.
- Chatham County population projected at +33% by 2050 — long-run rental-demand tailwind backs the buy-and-hold thesis.
Negotiation context
- It's been on market 39 days — a 3% lower offer ($150k) is reasonable based on typical stale-listing flexibility.
- 2 sale attempts since 16y ago; this cycle's ask has dropped $30k (16%) from the opening price — seller is motivated, your offer sets the floor, not the list.
- Current owner paid $80k; list at $154k implies a 93% gain — meaningful room to come down on a strong offer.
Risks & watch-outs
- Watch-outs: built in 1939 — expect roof / HVAC / electrical / plumbing capex.
- Climate carrying-cost: severe wind risk, 99% chance of damaging wind over 30y; extreme-heat days projected 7→18/yr by 2055 (HVAC capex compounding) — expect insurance premiums to compound above CPI over the hold.
Questions for the listing agent
- It's been on market 39 days. Have you received any prior offers? Is the seller open to a 3% concession, seller financing, or rate buy-down credit?
- Built in 1939 — when were the roof, HVAC, electrical panel, plumbing, and water heater last replaced?
- Is there a deadline driving the sale (1031 exchange, divorce, estate, relocation)? That informs how much negotiation room exists.
- Schools are F-rated, which usually means shorter tenancies and higher turnover. Who's the typical renter profile here, and what's been the actual vacancy rate?
- What's the average days-on-market for RENTAL listings here right now (not sales)? A rising rental-DOM trend means longer vacancies and softer asking-rent achievability than the comps imply.
- What's the recent tenant-quality profile in this submarket — average credit score on applications, eviction rate, late-payment / NSF rate, and stable-employment percentage? A property-management company in the area should have these aggregated.
- How much new for-sale + rental construction is in the pipeline within 1–3 miles? Heavy new supply typically softens prices + rents 12–24 months out; constrained supply supports both.
Investment metrics
- 1% rule
- 1.04% ✓
- Cap rate
- 8.04%
- Cash-on-cash
- 6.24%
- DSCR
- 1.28
- GRM
- 8.0
CMA / ARV
- ARV (median comp)
- $250,189
- List price
- $154,500
- Delta
- -38.25%
- Verdict
- UNDERPRICED
- Comps
- 20 within 1.0 mi
Show comp detail 12 sales within ~0.75 mi
| Address | Dist | Beds/Ba | Sqft | Sold | Price | $/sf | Match |
|---|---|---|---|---|---|---|---|
| 2412 New York Ave | 0.30mi | 3/1.0 (+1) | 866 (-2%) | 2mo | $251,150 | $290 | 76 |
| 2411 Alabama Ave | 0.24mi | 2/1.0 | 820 (-7%) | 4mo | $216,000 | $263 | 74 |
| 1918 Delaware Ave | 0.14mi | 2/1.0 | 952 (+8%) | 10mo | $280,000 | $294 | 73 |
| 2409 E 37th St | 0.25mi | 2/1.0 | 948 (+7%) | 7mo | $298,000 | $314 | 71 |
| 2017 Vermont Ave | 0.34mi | 3/2.0 (+1) | 904 (+2%) | 2mo | $230,000 | $254 | 70 |
| 2229 E Gwinnett St | 0.54mi | 2/1.0 | 912 (+3%) | 8mo | $219,900 | $241 | 63 |
| 2151 Mississippi Ave | 0.39mi | 2/1.0 | 984 (+11%) | 2mo | $235,500 | $239 | 62 |
| 2018 Bolling St | 0.62mi | 2/1.0 | 914 (+3%) | 6mo | $120,000 | $131 | 61 |
| 2026 California Ave | 0.51mi | 3/1.0 (+1) | 880 (-1%) | 13mo | $280,000 | $318 | 60 |
| 2220 E 38th St | 0.24mi | 3/1.5 (+1) | 978 (+10%) | 8mo | $317,500 | $325 | 57 |
| 2303 E 42nd St | 0.47mi | 2/1.0 | 756 (-15%) | 6mo | $235,000 | $311 | 49 |
| 2231 E Gwinnett St | 0.54mi | 3/2.0 (+1) | 996 (+12%) | 3mo | $238,256 | $239 | 43 |
Match score weights: distance 35% · size 25% · config 20% · recency 20%. Top-matched comps best support the ARV.
Projected returns pro-forma
-3.0% appreciation · 3.62% rent growth · sell at horizon
- IRR
- -6.0%
- Equity multiple
- 0.78×
- Total profit
- $-9,688
- Equity at exit
- $23,036
- IRR
- 4.4%
- Equity multiple
- 1.33×
- Total profit
- $14,254
- Equity at exit
- $13,358
Cash invested: $43,260 (down + closing). Projections, not guarantees.
Landlord ↔ Tenant lean methodology
- Overall (STATE)
- 90 Strongly Landlord-Friendly
- State Georgia
- 90 Strongly Landlord-Friendly · R+3
- County
- — inherits STATE
- City
- — inherits STATE
ZIP-level market 31404
- Rents YoY
- 3.6%
- Active inventory
- 228
- Price-to-rent
- 8.0×
Monthly cashflow live
- Estimated rent
- $1,609 high interval (Pro) →
- Mortgage (P&I)
- −$810
- Tax from tax record
- −$172 /mo · $2,059/yr
- Insurance
- −$64
- HOA
- −$0
- Vacancy / Maint / Mgmt
- −$338
- Net cashflow
- $225
Break-even live
Sensitivity live
| Price | -10% $312 | -5% $269 | +0% $225 | +5% $181 | +10% $137 |
|---|---|---|---|---|---|
| Rent | -10% $98 | -5% $161 | +0% $225 | +5% $289 | +10% $352 |
| Rate | -1.0pp $303 | -0.5pp $264 | base $225 | +0.5pp $185 | +1.0pp $144 |
UW: 25.0% down · 7.5% · 30yr · 1.5% tax · 5.0% vac · 8.0% maint · 8.0% mgmt
Financing live
Cash to close
- Down payment
- $38,625
- Closing costs
- $4,635
- Reserves months
- —
- Total cash needed
- —
Loan-product check · same deal, 3 products live
Conventional
25% down · 7.5% · 30yr
- Down + closing
- —
- Monthly P&I
- —
- Monthly cashflow
- —
- DSCR
- —
- Eligible?
- —
Personal DTI + credit; lowest rate.
DSCR
20% down · 8.5% · 30yr
- Down + closing
- —
- Monthly P&I
- —
- Monthly cashflow
- —
- DSCR
- —
- Eligible?
- —
No personal income docs; deal must DSCR.
Hard money
10% down · 12.0% · 12mo
- Down + closing
- —
- Monthly P&I
- —
- Monthly cashflow
- —
- DSCR
- —
- Eligible?
- —
Short-term bridge; refi at stabilization.
Rent comps 40 comps
| Address | Beds | Baths | Sqft | Rent | $/sqft | DOM | Units | Dist |
|---|---|---|---|---|---|---|---|---|
| 37 Altman Cir Savannah, GA | 2.0 | 2.0 | 879 | $1,750 | $1.99 | 45d | 1 | 0.06mi |
| 2141 New York Ave Unit A Savannah, GA | 2.0 | 1.0 | 765 | $1,750 | $2.29 | 45d | 1 | 0.30mi |
| 2010 Vermont Ave Savannah, GA | 2.0 | 1.0 | 892 | $1,690 | $1.89 | 45d | 1 | 0.35mi |
| 2328 E 41st St Savannah, GA | 2.0 | 1.0 | 1072 | $1,700 | $1.59 | 45d | 1 | 0.39mi |
| 2201 Mississippi Ave Savannah, GA | 2.0 | 1.0 | 1005 | $1,595 | $1.59 | 45d | 1 | 0.40mi |
| 1110 New Jersey Ave Savannah, GA | 2.0 | 1.0 | 714 | $1,500 | $2.10 | 45d | 1 | 0.41mi |
| 2220 E Victory Dr #24 Savannah, GA | 2.0 | 1.5 | 1102 | $1,700 | $1.54 | 25d | 1 | 0.52mi |
| 2323 Downing Ave Savannah, GA | 2.0–3.0 | 1.5–2.0 | 1014 | $1,299 | $1.28 | 16d | 14 | 0.60mi |
| 1901 Kingstown Dr Savannah, GA | 1.0 | 1.0 | 615 | $1,150 | $1.87 | 45d | 1 | 0.62mi |
| 1812 E 39th St Savannah, GA | 1.0 | 1.0 | 629 | $1,150 | $1.83 | 25d | 1 | 0.75mi |
| 2102 Auburn St Savannah, GA | 3.0 | 1.0 | 828 | $1,795 | $2.17 | 45d | 1 | 0.86mi |
| 1800 E 38th St Savannah, GA | 2.0 | 1.0 | 846 | $1,338 | $1.58 | 45d | 1 | 0.93mi |
| 1611 E Henry St Unit 1/2 A Savannah, GA | 2.0 | 2.0 | 688 | $1,300 | $1.89 | 25d | 1 | 0.93mi |
| 2611 Dogwood Ave Savannah, GA | 2.0 | 1.0 | 822 | $1,700 | $2.07 | 25d | 1 | 0.96mi |
| 2612 Dogwood Ave Savannah, GA | 1.0–3.0 | 1.0–2.0 | 1020 | $1,522 | $1.49 | 16d | 11 | 0.98mi |
| 2002 E 51st St Unit Labs Savannah, GA | 3.0 | 1.0 | 1044 | $1,680 | $1.61 | 45d | 1 | 1.03mi |
| 2840 Wicklow St Savannah, GA | 1.0–3.0 | 1.0–2.0 | 1071 | $2,370 | $2.21 | 16d | 50 | 1.03mi |
| 1904 E 51st St Unit 1 Savannah, GA | 1.0 | 1.0 | 600 | $1,000 | $1.67 | 16d | 1 | 1.08mi |
| 3608 Duane Ct Savannah, GA | 2.0 | 1.0 | 975 | $1,095 | $1.12 | 25d | 1 | 1.10mi |
| 3608 Duane Ct Unit C Savannah, GA | 2.0 | 1.0 | 975 | $1,095 | $1.12 | 45d | 1 | 1.10mi |
| 2800 Capital St Savannah, GA | 1.0–3.0 | 1.0 | 980 | $1,412 | $1.44 | 45d | 1 | 1.14mi |
| 1401 E 33rd St Savannah, GA | 3.0 | 1.0 | 960 | $1,650 | $1.72 | 45d | 1 | 1.19mi |
| 3650 Duane Ct Apt A Savannah, GA | 2.0 | 1.0 | 850 | $1,150 | $1.35 | 25d | 1 | 1.22mi |
| 1418 E 42nd St Unit 1 Savannah, GA | 1.0 | 1.0 | 800 | $1,100 | $1.38 | 45d | 1 | 1.22mi |
| 1418 E 42nd St Unit 2 Savannah, GA | 1.0 | 1.0 | 800 | $1,100 | $1.38 | 25d | 1 | 1.22mi |
| 1418 E 42nd St Unit 4 Savannah, GA | 1.0 | 1.0 | 900 | $1,250 | $1.39 | 25d | 1 | 1.22mi |
| 1326 E 38th St Savannah, GA | 2.0 | 1.0 | 800 | $1,600 | $2.00 | 16d | 1 | 1.25mi |
| 1317 E 38th St Savannah, GA | 1.0 | 1.0 | 750 | $2,000 | $2.67 | 45d | 1 | 1.26mi |
| 3222 Bee Rd Savannah, GA | 2.0 | 1.0 | 900 | $1,195 | $1.33 | 16d | 1 | 1.27mi |
| 1315 E Anderson St Unit 1315 Savannah, GA | 2.0 | 2.0 | 859 | $1,500 | $1.75 | 45d | 1 | 1.29mi |
| 1305 E 32nd St Savannah, GA | 2.0 | 1.0 | 832 | $2,400 | $2.88 | 16d | 1 | 1.30mi |
| 1303 E 33rd St Savannah, GA | 2.0 | 1.0 | 561 | $1,150 | $2.05 | 16d | 1 | 1.30mi |
| 16 Helmken St Savannah, GA | 3.0 | 1.0 | 924 | $1,850 | $2.00 | 16d | 1 | 1.36mi |
| 1224 E 38th St Savannah, GA | 2.0 | 1.0 | 798 | $1,550 | $1.94 | 45d | 1 | 1.37mi |
| 1506 E 50th St Savannah, GA | 1.0 | 1.0 | 600 | $1,700 | $2.83 | 45d | 1 | 1.38mi |
| 1226 E Henry St Unit B Savannah, GA | 2.0 | 1.0 | 882 | $1,300 | $1.47 | 45d | 1 | 1.39mi |
| 2217 Beech St Savannah, GA | 2.0 | 1.0 | 959 | $1,850 | $1.93 | 25d | 1 | 1.41mi |
| 1226 E Victory Dr Apt 4 Savannah, GA | 2.0 | 1.0 | 950 | $1,675 | $1.76 | 45d | 1 | 1.41mi |
| 2211 Beech St Savannah, GA | 2.0 | 1.0 | 800 | $1,595 | $1.99 | 45d | 1 | 1.41mi |
| 1205 E 38th St Savannah, GA | 2.0 | 1.0 | 1000 | $1,595 | $1.59 | 45d | 1 | 1.42mi |
Listing history 23 events
-
2026-06-21pricedays on market $154,500 Active 39 DOM
-
2026-06-18days on market $158,500 Active 36 DOM
-
2026-06-17days on market $158,500 Active 35 DOM
-
2026-06-16days on market $158,500 Active 34 DOM
-
2026-06-15pricedays on market $158,500 Active 33 DOM
-
2026-06-14days on market $159,500 Active 31 DOM
-
2026-06-13pricedays on market $159,500 Active 30 DOM
-
2026-06-10days on market $163,500 Active 28 DOM
-
2026-06-09days on market $163,500 Active 27 DOM
-
2026-06-08days on market $163,500 Active 26 DOM
-
2026-06-07pricedays on market $163,500 Active 25 DOM
-
2026-06-05pricedays on market $164,500 Active 22 DOM
-
2026-06-03days on market $165,500 Active 21 DOM
-
2026-06-03price $165,500 Active 20 DOM
-
2026-06-02pricedays on market $166,500 Active 20 DOM
-
2026-06-01days on market $167,500 Active 19 DOM
-
2026-05-31days on market $167,500 Active 18 DOM
-
2026-05-30days on market $167,500 Active 17 DOM
-
2026-05-18price $179,000 322-char remark
-
2026-05-12$184,000 Active 322-char remark
-
2026-03-31soldstatus $80,000
-
2010-09-12historical
-
2010-03-13$48,900
ⓘ Source: listings_history table (triggers on properties + properties_extension) + one-shot
backfill from property_details.listing_events for pre-trigger history.
Tax reassessment forecast GA · Resets to sale price
- Current annual tax
- $2,059 · $172/mo
- Projected year-2 tax
- $2,059 · $172/mo
- Expected delta
- $0/yr ($0/mo · 0.0%)
ⓘ Screening estimate from a state-policy table — verify with the county assessor before closing.
Climate risk First Street
- Flood 1/10 Low FEMA zone X (unshaded) · 0% chance over 30 yrs
- Wildfire 3/10 Moderate
- Heat 10/10 Extreme 7 d/yr ≥107°F today · 18 d/yr by 30 yrs out
- Wind 9/10 Extreme 99% chance of damaging wind over 30 yrs
- Air quality 2/10 Low 2 unhealthy d/yr today · 2 by 30 yrs out
Nearby sold comps map
Loading sold comps map…
Walkable amenities ~0.75 mi
Loading nearby amenities…
Taxation est. · year 1
- Rental income
- $19,308
- − Mortgage interest
- −$8,654
- − Property taxes
- −$2,059
- − Insurance
- −$772
- − Repairs & maintenance
- −$1,545
- − Management
- −$1,545
- − Depreciation
- −$4,495
- Taxable income
- $238
- Est. tax owed @ 24.0%
- −$57
- After-tax cash flow
- $2,642/yr
For passive investors: Depreciation is non-cash, so a rental often shows a tax loss while cash-flowing — sheltering income. Rental losses are passive: they offset passive income freely, and up to $25,000/yr can offset ordinary (W-2) income if you actively participate and your MAGI is under $100k (phasing out to $0 by $150k); unused losses carry forward. On sale, claimed depreciation is recaptured at up to 25%, and gains may owe capital-gains tax (a 1031 exchange can defer both). Figures are a year-1 estimate at your 24.0% rate — not tax advice; consult a CPA.
Schools (NCES district)
- District
- Savannah-Chatham County
- NCES district ID
- 1301020
- Math proficiency
- 20% ▼ -11.00%
- Reading proficiency
- 26% ▼ -5.00%
- Median HH income
- $47,443
- Composite
- 20.14/100
- National rank
- #8639
- State rank
- #134 of 174 in GA
Livability — Savannah
- Score
- 86/100
- State rank
- #1
- US rank
- #397
Category grades
Schools grade is shown separately in the Schools card above.
Census & demographics
- Census place
- Savannah, GA
- County
- Chatham County · 271,602 people
- City population
- 216,564
- Metro
- Savannah, GA
- Population (ZIP)
- 30,062
- Household income
- $53,303
- Rent vs Own
- Severe rent burden
- 1649.0
Population outlook (Chatham County) Hauer SSP2
- Today (2025)
- 332,584 people
- By 2030
- 355,508 · +6.9%
- By 2040
- 400,030 · +20.3%
- By 2050
- 443,019 · +33.2%
- By 2075
- 534,579 · +60.7%
- By 2100
- 583,863 · +75.6%
Race, ethnicity, and origin ACS 2023
- Neighborhood character
- Majority Black (60%)
- Race & ethnicity
- Black 60% White 33% Two or more races 4% Hispanic / Latino 3% Asian 1%
- Common ancestry
- Romanian 2% Lithuanian 1% Slovak 1%
- Foreign-born
- 4% · Canada, Vietnam
- Languages at home
- 93% English-only · Spanish 3% Other Asian/Pacific 1% French/Haitian/Cajun 1%
Political lean MEDSL · Chatham
- 2024 margin
- D (+18.0) · D 58.6% · R 40.6%
- 2008→2024 swing
- +3.6pp toward D · 2008: 14.4pp · 2024: 18.0pp
- All cycles
- 2024: D+18.0 2020: D+18.8 2016: D+14.5 2012: D+12.0 2008: D+14.4
Not yet ingested
- Civics
- —
Market trends
- HPI YoY
- ▼ -187.86%
- Current HPI
- 310.0764
- Rent YoY
- ▲ 3.62%
- Metro
- Savannah, GA
- State GDP YoY
- ▲ 2.66%
- F500 in state
- 28
Industry mix (Fortune 500 HQ in GA)
| Industry | F500 HQs | Revenue |
|---|---|---|
| Paper / Packaging | 2 | $29B |
|
||
| Retail | 1 | $160B |
|
||
| Transportation / Logistics | 1 | $91B |
|
||
| Airlines | 1 | $62B |
|
||
| Consumer Goods | 1 | $47B |
|
||
| Utilities | 1 | $25B |
|
||
Price history
+224.1% since first listed16 events — show timeline
- 2026-06-14 Price Changed $158,500 Hive MLS
- 2026-06-12 Price Changed $159,500 Hive MLS
- 2026-06-10 Price Changed $162,500 Hive MLS
- 2026-06-06 Price Changed $163,500 Hive MLS
- 2026-06-04 Price Changed $164,500 Hive MLS
- 2026-06-02 Price Changed $165,500 Hive MLS
- 2026-06-01 Price Changed $166,500 Hive MLS
- 2026-05-28 Price Changed $167,500 Hive MLS
- 2026-05-27 Price Changed $168,500 Hive MLS
- 2026-05-25 Price Changed $169,500 Hive MLS
- 2026-05-20 Price Changed $174,500 Hive MLS
- 2026-05-18 Price Changed $179,000 Hive MLS
- 2026-05-12 Listed $184,000 Hive MLS
- 2026-03-31 Sold (Public Records) $80,000 Public Records
- 2010-09-12 Listing Removed — Hive MLS
- 2010-03-13 Listed $48,900 Hive MLS
Property tax history
+18.0%/yrLatest (2025): $2,059 · +137.0% YoY. Source: county tax records.
Cash-flow waterfall
monthlySold comps — $/sqft
last 12 mo · ≤1 miLoading sold comps…