 🏷️ Likely Rental
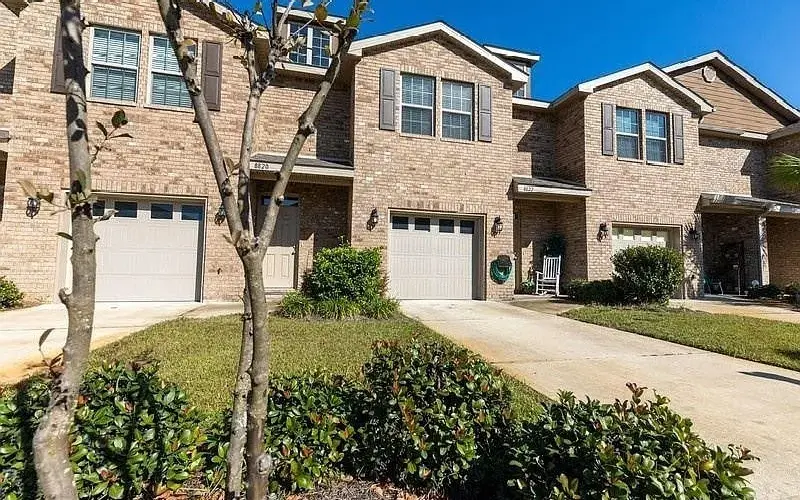
8822 Little Cormorant Ln · Navarre, FL
Flood risk 1/10 · Minimal
- FEMA flood zone
- X (unshaded)
- Chance of flooding over 30 yrs
- 0.0%
- Est. flood insurance / yr
- $507 – $1,088
Fire risk 3/10 · Minor
- Est. fire insurance / yr
- $947 – $1,759
Heat risk 10/10 · Severe
- Hot days now (above 104°F)
- 7 days/yr
- Hot days in 30 yrs
- 23 days/yr
Wind risk 9/10 · Severe
- Chance of severe wind over 30 yrs
- 99.0%
Air-quality risk 2/10 · Minimal
- Unhealthy air days now
- 1 days/yr
- Unhealthy air days in 30 yrs
- 1 days/yr
Risk factors via First Street. Map © Google.
Why this score? — see what drove the D+ grade
The composite is a weighted blend of 9 inputs, each scored 0–100. Each bar is that input's sub-score; the figure is the points it added to the 100-point composite (weight × sub-score).
- Cash flow +15.0/30.0
- ARV discount +7.5/15.0
- Schools +5.3/10.0
- 1% rule +5.0/10.0
- DSCR +5.0/10.0
- Livability +3.5/5.0
- Rent growth +3.2/5.0
- Condition / age +2.5/5.0
- Appreciation +0.0/10.0
$5,000
🖨 Deal sheet (PDF) 📄 Offer letter ✓ Due diligence
Listing remarks MLS
Reserve Pointe, a beautiful townhome community. This unit was built in 2016, has granite counter tops, a breakfast bar, and lots of cabinets. The clever layout provides a spacious feeling! Enjoy sunny days at the pool, or watch kids play at the nicely maintained play ground. There are sidewalks for a stroll through the neighborhood. If you are looking for easy living you found the right place, your HOA fees pay for all the ground keeping and Recreational Facility. Minutes to Navarre's bright white beaches, restaurants and shopping. Navarre is conveniently located between Pensacola and Fort Walton Beach. Book a showing today!
Key facts
- Garage
- Built 2016
- Listed 7 days
Property features AI
Exterior
- Parking: Detached or attached garage not specified, includes 1 garage space
- Home design: Residential property; 2-story home
- Exterior features: Lot in residential zoning
Interior
- Bathrooms: 3 full bathrooms
- Interior features: Directions available to the property
Neighborhood map
What this means for you Summary
Snapshot
- This is a 3-bed/3.0-bath single-family listed at $5k.
Deal economics
- At list price, monthly cash flow is $2k ($20k/yr) — positive.
- The deal already cash-flows at list — no discount required.
- Meets the 1% rule at list price ($2k rent vs $5k).
- Cap rate 404.5% vs local median 4.1% in Navarre — top-decile yield for the area; either an underpriced asset or a hidden risk that comps aren't pricing in. Stress-test before assuming the spread holds.
Location & tenants
- Location reads 70/100 on livability (#435 in FL) — a middle-class / working-renter tenant base. Strengths: housing A+, employment A, crime A-; Watch: health & safety C-, amenities F, commute F.
- Santa Rosa (suburban): math 63% / reading 60% proficiency, ranked #8 of 73 in FL (top 11%) — acceptable for families but not a draw, mixed tenant base, ~2y average lease.
- Zoned schools: Holley-Navarre Primary (771 students, 41% FRL); Holley-Navarre Middle School (math 71% / reading 63%, grade A-, #80 of 571 statewide, top 14%, 830 students, 42% FRL); Navarre High School (math 49% / reading 58%, grade C-, #146 of 667 statewide, top 22%, 2,406 students, 30% FRL) — zoned schools at 38% FRL track the district average.
- Market conditions: Rents rising (+2.7%/yr); 769 active listings in the ZIP; 20 comparable units currently listed for rent nearby; rentals at typical pace (median 25d on market — plan ~3-4 weeks tenant-placement turnaround); solid renter incomes; 1,983 units permitted in Santa Rosa County in 2024 (128 in 5+ unit buildings).
Forward outlook
- Local home prices are declining (-3.0%/yr); year-one equity from $35 of loan paydown is wiped out by about $150 of value loss. Plan a longer hold.
- Santa Rosa County population projected at +31% by 2050 — long-run rental-demand tailwind backs the buy-and-hold thesis.
- At projected returns (-3.0% appreciation + 2.7% rent growth), your $1k cash investment doubles in ~1 year — after that, you're playing with house money.
Negotiation context
- Only 7 days on market — expect competitive offers; lowballing is unlikely to land.
- 3 sale attempts since 7y ago with the ask held roughly flat each time — persistent listings suggest the price (not the market) is what's stuck; bring a comps-based counter.
Risks & watch-outs
- Climate carrying-cost: severe wind risk, 99% chance of damaging wind over 30y; extreme-heat days projected 7→23/yr by 2055 (HVAC capex compounding) — expect insurance premiums to compound above CPI over the hold.
Questions for the listing agent
- Is there a deadline driving the sale (1031 exchange, divorce, estate, relocation)? That informs how much negotiation room exists.
- Schools are A-rated — typically a magnet for longer-tenancy family renters. What's the average tenant stay here, and is there a school-zone premium baked into asking?
- The area grade is low — what's the realistic commute time and amenity access for the typical tenant pool here? Any planned neighborhood developments (good or bad) we should know about?
- What's the average days-on-market for RENTAL listings here right now (not sales)? A rising rental-DOM trend means longer vacancies and softer asking-rent achievability than the comps imply.
- What's the recent tenant-quality profile in this submarket — average credit score on applications, eviction rate, late-payment / NSF rate, and stable-employment percentage? A property-management company in the area should have these aggregated.
- How much new for-sale + rental construction is in the pipeline within 1–3 miles? Heavy new supply typically softens prices + rents 12–24 months out; constrained supply supports both.
Investment metrics
- 1% rule
- 42.88% ✓
- Cap rate
- 404.48%
- Cash-on-cash
- 1422.10%
- DSCR
- 64.28
- GRM
- 0.2
CMA / ARV
- ARV (on-the-fly)
- $339,888
- Comps found
- 12
Show comp detail 12 sales within ~0.75 mi
| Address | Dist | Beds/Ba | Sqft | Sold | Price | $/sf | Match |
|---|---|---|---|---|---|---|---|
| 8727 El Paseo St | 0.25mi | 3/2.0 | 1,582 (+2%) | 3mo | $346,000 | $219 | 78 |
| 8920 Quail Roost Dr Dr | 0.40mi | 3/2.0 | 1,475 (-5%) | 4mo | $345,000 | $234 | 66 |
| 8956 Timber Ln | 0.39mi | 3/2.0 | 1,548 (-0%) | 15mo | $325,000 | $210 | 65 |
| 8724 Laredo St | 0.23mi | 3/2.0 | 1,368 (-12%) | 2mo | $350,000 | $256 | 64 |
| 8219 Branston Dr Dr | 0.30mi | 3/2.0 | 1,647 (+6%) | 13mo | $345,000 | $209 | 61 |
| 8908 Cutter Ct | 0.45mi | 3/2.0 | 1,505 (-3%) | 12mo | $355,000 | $236 | 60 |
| 9028 Quail Roost Dr | 0.63mi | 3/2.0 | 1,614 (+4%) | 1mo | $379,900 | $235 | 60 |
| 8723 Estrada St | 0.37mi | 3/2.0 | 1,406 (-9%) | 7mo | $349,900 | $249 | 57 |
| 8611 Wilburn Cv | 0.61mi | 3/2.0 | 1,590 (+2%) | 9mo | $297,500 | $187 | 56 |
| 8544 Laredo St | 0.66mi | 3/2.0 | 1,614 (+4%) | 5mo | $301,840 | $187 | 55 |
| 2107 Ortega St | 0.12mi | 4/2.0 (+1) | 1,783 (+15%) | 10mo | $370,000 | $208 | 52 |
| 2133 Ainsdale Ct | 0.25mi | 4/2.0 (+1) | 1,783 (+15%) | 11mo | $355,000 | $199 | 46 |
Match score weights: distance 35% · size 25% · config 20% · recency 20%. Top-matched comps best support the ARV.
Projected returns pro-forma
-3.0% appreciation · 2.74% rent growth · sell at horizon
- IRR
- —
- Equity multiple
- 75.52×
- Total profit
- $104,333
- Equity at exit
- $746
- IRR
- —
- Equity multiple
- 161.55×
- Total profit
- $224,766
- Equity at exit
- $432
Cash invested: $1,400 (down + closing). Projections, not guarantees.
Landlord ↔ Tenant lean methodology
- Overall (STATE)
- 87 Strongly Landlord-Friendly
- State Florida
- 87 Strongly Landlord-Friendly · R+3
- County
- — inherits STATE
- City
- — inherits STATE
ZIP-level market 32566
- Home prices YoY
- -26.2%
- Rents YoY
- 2.7%
- Active inventory
- 769
- Price-to-rent
- 0.2×
Monthly cashflow live
- Estimated rent
- $2,144 high interval (Pro) →
- Mortgage (P&I)
- −$26
- Tax est. 1.5%
- −$6 /mo · $75/yr
- Insurance
- −$2
- HOA
- −$0
- Vacancy / Maint / Mgmt
- −$450
- Net cashflow
- $1,659
Break-even live
Sensitivity live
| Price | -10% $1,663 | -5% $1,661 | +0% $1,659 | +5% $1,657 | +10% $1,656 |
|---|---|---|---|---|---|
| Rent | -10% $1,490 | -5% $1,574 | +0% $1,659 | +5% $1,744 | +10% $1,828 |
| Rate | -1.0pp $1,662 | -0.5pp $1,660 | base $1,659 | +0.5pp $1,658 | +1.0pp $1,657 |
UW: 25.0% down · 7.5% · 30yr · 1.5% tax · 5.0% vac · 8.0% maint · 8.0% mgmt
Financing live
Cash to close
- Down payment
- $1,250
- Closing costs
- $150
- Reserves months
- —
- Total cash needed
- —
Loan-product check · same deal, 3 products live
Conventional
25% down · 7.5% · 30yr
- Down + closing
- —
- Monthly P&I
- —
- Monthly cashflow
- —
- DSCR
- —
- Eligible?
- —
Personal DTI + credit; lowest rate.
DSCR
20% down · 8.5% · 30yr
- Down + closing
- —
- Monthly P&I
- —
- Monthly cashflow
- —
- DSCR
- —
- Eligible?
- —
No personal income docs; deal must DSCR.
Hard money
10% down · 12.0% · 12mo
- Down + closing
- —
- Monthly P&I
- —
- Monthly cashflow
- —
- DSCR
- —
- Eligible?
- —
Short-term bridge; refi at stabilization.
Rent comps 20 comps
| Address | Beds | Baths | Sqft | Rent | $/sqft | DOM | Units | Dist |
|---|---|---|---|---|---|---|---|---|
| 8776 Brown Pelican Cir Navarre, FL | 3.0 | 2.5 | 1551 | $1,900 | $1.23 | 25d | 1 | 0.03mi |
| 8733 Brown Pelican Cir Navarre, FL | 3.0 | 2.5 | 1500 | $1,950 | $1.30 | 15d | 1 | 0.06mi |
| 8733 Brown Pelican Cir Navarre, FL | 3.0 | 2.5 | 1551 | $1,950 | $1.26 | 25d | 1 | 0.06mi |
| 8740 Brown Pelican Cir Navarre, FL | 3.0 | 2.5 | 1742 | $1,850 | $1.06 | 23d | 1 | 0.07mi |
| 2121 Wilsons Plover Cir Navarre, FL | 3.0 | 2.0 | 1544 | $2,000 | $1.30 | 25d | 1 | 0.15mi |
| 8958 Ellen Ct Navarre, FL | 3.0 | 2.0 | 1627 | $2,250 | $1.38 | 15d | 1 | 0.35mi |
| 8657 El Paseo St Navarre, FL | 3.0 | 2.0 | 1908 | $2,210 | $1.16 | 23d | 1 | 0.42mi |
| 2345 Ortega St Navarre, FL | 3.0 | 2.0 | 1527 | $2,200 | $1.44 | 15d | 1 | 0.61mi |
| 2345 Ortega St Navarre, FL | 3.0 | 2.0 | 1527 | $2,200 | $1.44 | 25d | 1 | 0.61mi |
| 8524 Laredo St Navarre, FL | 3.0 | 2.0 | 1279 | $1,900 | $1.49 | 15d | 1 | 0.71mi |
| 8524 Laredo St Navarre, FL | 3.0 | 2.0 | 1279 | $1,900 | $1.49 | 25d | 1 | 0.71mi |
| 1921 Luneta St Navarre, FL | 3.0 | 2.0 | 1481 | $2,100 | $1.42 | 25d | 1 | 0.82mi |
| 1925 Esplanade St Unit F Navarre, FL | 2.0 | 1.0 | 1100 | $1,400 | $1.27 | 25d | 1 | 0.97mi |
| 8802 Pebble Brook Dr Navarre, FL | 3.0 | 2.0 | 1300 | $2,200 | $1.69 | 15d | 1 | 1.08mi |
| 8934 E River Dr Navarre, FL | 4.0 | 2.0 | 1989 | $2,500 | $1.26 | 25d | 1 | 1.08mi |
| 1900 Elevate Ave Navarre, FL | 1.0–3.0 | 1.0–2.0 | 999 | $2,798 | $2.80 | 15d | 17 | 1.32mi |
| 8244 Torres St Navarre, FL | 4.0 | 2.0 | 1692 | $2,150 | $1.27 | 25d | 1 | 1.43mi |
| 8249 Escola St Navarre, FL | 4.0 | 2.0 | 2095 | $2,690 | $1.28 | 25d | 1 | 1.45mi |
| 2225 Prytania Cir Navarre, FL | 3.0 | 2.0 | 1529 | $2,150 | $1.41 | 25d | 1 | 1.46mi |
| 2225 Prytania Cir Navarre, FL | 3.0 | 2.0 | 1529 | $2,150 | $1.41 | 15d | 1 | 1.46mi |
Listing history 6 events
-
2026-06-15days on market $5,000 Active 7 DOM
-
2026-06-14days on market $5,000 Active 5 DOM
-
2026-06-13days on market $5,000 Active 4 DOM
-
2026-06-10days on market $5,000 Active 2 DOM
-
2026-06-09remarks 307-char remark
-
2026-06-09$5,000 Active 1 DOM
ⓘ Source: listings_history table (triggers on properties + properties_extension) + one-shot
backfill from property_details.listing_events for pre-trigger history.
Climate risk First Street
- Flood 1/10 Low FEMA zone X (unshaded) · 0% chance over 30 yrs
- Wildfire 3/10 Moderate
- Heat 10/10 Extreme 7 d/yr ≥104°F today · 23 d/yr by 30 yrs out
- Wind 9/10 Extreme 99% chance of damaging wind over 30 yrs
- Air quality 2/10 Low 1 unhealthy d/yr today · 1 by 30 yrs out
Nearby sold comps map
Loading sold comps map…
Walkable amenities ~0.75 mi
Loading nearby amenities…
Taxation est. · year 1
- Rental income
- $25,727
- − Mortgage interest
- −$280
- − Property taxes
- −$75
- − Insurance
- −$25
- − Repairs & maintenance
- −$2,058
- − Management
- −$2,058
- − Depreciation
- −$145
- Taxable income
- $21,085
- Est. tax owed @ 24.0%
- −$5,060
- After-tax cash flow
- $14,849/yr
For passive investors: Depreciation is non-cash, so a rental often shows a tax loss while cash-flowing — sheltering income. Rental losses are passive: they offset passive income freely, and up to $25,000/yr can offset ordinary (W-2) income if you actively participate and your MAGI is under $100k (phasing out to $0 by $150k); unused losses carry forward. On sale, claimed depreciation is recaptured at up to 25%, and gains may owe capital-gains tax (a 1031 exchange can defer both). Figures are a year-1 estimate at your 24.0% rate — not tax advice; consult a CPA.
Schools (NCES district)
- District
- Santa Rosa
- NCES district ID
- 1201650
- Math proficiency
- 63% ▼ -6.00%
- Reading proficiency
- 60% ▼ -5.00%
- Median HH income
- $58,161
- Composite
- 53.12/100
- National rank
- #1511
- State rank
- #8 of 73 in FL
Livability — Navarre
- Score
- 70/100
- State rank
- #435
- US rank
- #7790
Category grades
Schools grade is shown separately in the Schools card above.
Census & demographics
- Census place
- Navarre, FL
- County
- Santa Rosa County · 194,764 people
- City population
- 43,883
- Metro
- Pensacola-Ferry Pass-Brent, FL
- Population (ZIP)
- 43,883
- Household income
- $105,551
- Rent vs Own
- Severe rent burden
- 608.0
Population outlook (Santa Rosa County) Hauer SSP2
- Today (2025)
- 195,978 people
- By 2030
- 209,782 · +7.0%
- By 2040
- 235,293 · +20.1%
- By 2050
- 256,408 · +30.8%
- By 2075
- 298,074 · +52.1%
- By 2100
- 303,216 · +54.7%
Race, ethnicity, and origin ACS 2023
- Neighborhood character
- Predominantly White (75%)
- Race & ethnicity
- White 75% Two or more races 9% Hispanic / Latino 9% Black 6% Asian 3%
- Hispanic origin (detail)
- Mexican 3% Puerto Rican 2%
- Common ancestry
- Scotch-Irish 3% Lithuanian 3% Romanian 2%
- Foreign-born
- 6% · Canada, Jamaica, Vietnam
- Languages at home
- 92% English-only · Spanish 4% German/W. Germanic 1% Tagalog/Filipino 1%
Political lean MEDSL · Santa Rosa
- 2024 margin
- Solid R (+51.0) · D 24.1% · R 75.0%
- 2008→2024 swing
- -3.0pp toward R · 2008: -47.9pp · 2024: -51.0pp
- All cycles
- 2024: R+51.0 2020: R+46.5 2016: R+53.5 2012: R+52.6 2008: R+47.9
Not yet ingested
- Civics
- —
Market trends
- HPI YoY
- ▼ -105.87%
- Current HPI
- 298.6821
- Rent YoY
- ▲ 2.74%
- Metro
- Pensacola-Ferry Pass-Brent, FL
- State GDP YoY
- ▲ 3.28%
- F500 in state
- 36
Industry mix (Fortune 500 HQ in FL)
| Industry | F500 HQs | Revenue |
|---|---|---|
| Industrial Technology | 2 | $29B |
|
||
| Insurance | 2 | $17B |
|
||
| Retail | 1 | $60B |
|
||
| Technology Distribution | 1 | $58B |
|
||
| Homebuilding | 1 | $35B |
|
||
| Technology Manufacturing | 1 | $35B |
|
||
Price history
-97.7% since first listed6 events — show timeline
- 2026-06-08 Listed $5,000 NFMLS
- 2020-04-08 Sold (Public Records) $216,000 Public Records
- 2020-03-27 Sold (MLS) $216,000 NAMLS
- 2020-03-27 Sold (MLS) $216,000 PARMLS
- 2019-11-16 Listed $218,000 PARMLS
- 2019-11-15 Listed $218,000 NAMLS
Property tax history
+24.9%/yrLatest (2025): $2,234 · -19.5% YoY. Source: county tax records.
Cash-flow waterfall
monthlySold comps — $/sqft
last 12 mo · ≤1 miLoading sold comps…