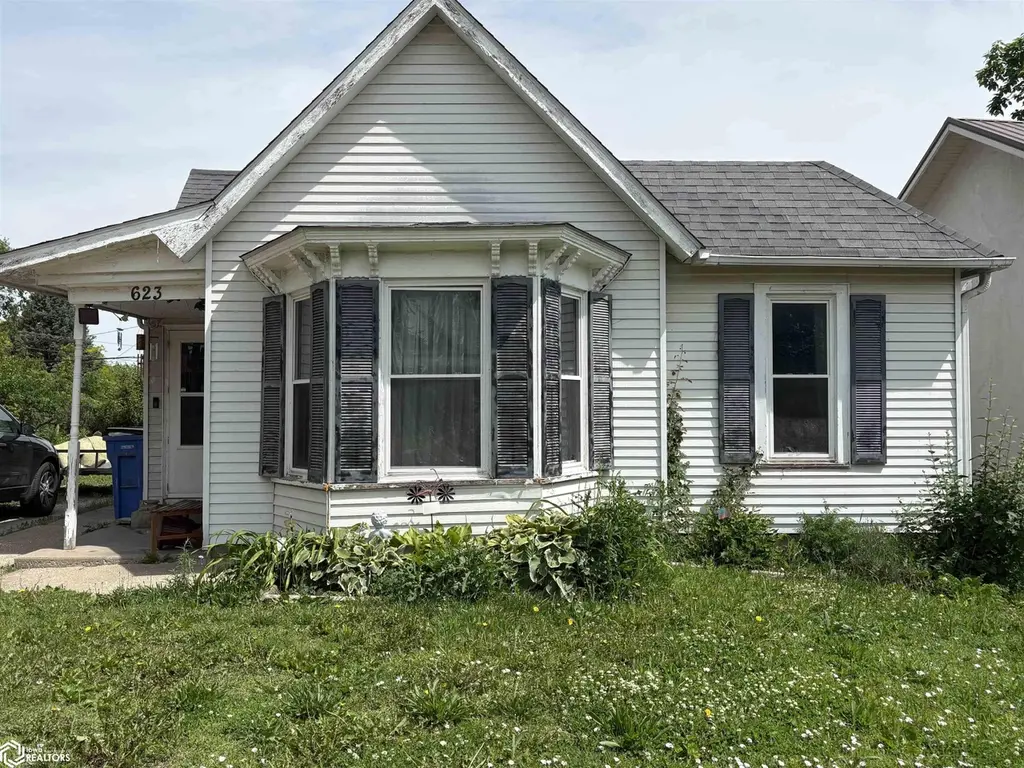
623 E Court Ave · Chariton, IA
Flood risk 1/10 · Minimal
- FEMA flood zone
- X (unshaded)
- Chance of flooding over 30 yrs
- 0.0%
- Est. flood insurance / yr
- $473 – $860
Fire risk 5/10 · Moderate
- Est. fire insurance / yr
- $902 – $1,676
Heat risk 3/10 · Minor
- Hot days now (above 104°F)
- 7 days/yr
- Hot days in 30 yrs
- 15 days/yr
Wind risk 2/10 · Minimal
- Chance of severe wind over 30 yrs
- —
Air-quality risk 2/10 · Minimal
- Unhealthy air days now
- 1 days/yr
- Unhealthy air days in 30 yrs
- 2 days/yr
Risk factors via First Street. Map © Google.
Why this score? — see what drove the B+ grade
The composite is a weighted blend of 9 inputs, each scored 0–100. Each bar is that input's sub-score; the figure is the points it added to the 100-point composite (weight × sub-score).
- Cash flow +30.0/30.0
- ARV discount +15.0/15.0
- DSCR +10.0/10.0
- 1% rule +8.8/10.0
- Schools +5.1/10.0
- Livability +4.0/5.0
- Rent growth +2.5/5.0
- Condition / age +2.5/5.0
- Appreciation +0.0/10.0
$94,750
🖨 Deal sheet (PDF) 📄 Offer letter ✓ Due diligence
Listing remarks
Welcome home to this charming 3-bedroom, 2-bath residence conveniently located in the heart of Chariton! Enjoy being just minutes from the town square, local shopping, restaurants, schools, and the park while still having plenty of space to relax and unwind. Inside, you'll find a comfortable and functional layout with ample living space for family and guests. The walk-out basement provides additional possibilities for storage, recreation, or future finishing to fit your needs. Step outside to a nice sized backyard, perfect for entertaining, gardening, pets, or simply enjoying the outdoors. If you're looking for a home close to the amenities Chariton offers, come check this one out. Schedule
Key facts
- Nice sized backyard
- Walk-out basement
- Local restaurants
Tags
Property features AI
Finance
- Financial info: Annual tax amount listed
Exterior
- Parking: Gravel parking
- Utilities: Public water; Public sewer
- Home design: Single-family residence; Residential property
- Construction: Built with other construction materials
- Exterior features: Public water; Public sewer; Lot size about 0.16 acres
Interior
- Bathrooms: One full bathroom; One three-quarter bathroom
- Interior features: Basement present; Central air conditioning; Forced-air heating
Neighborhood map
What this means for you Summary
Snapshot
- This is a 4-bed/2.0-bath single-family listed at $95k.
Deal economics
- At list price, monthly cash flow is $373 ($4k/yr) — positive.
- The deal already cash-flows at list — no discount required.
- Meets the 1% rule at list price ($1k rent vs $95k).
- Recommended offer: $93k (1.5% below list) — sets the bar for market timing.
- Cap rate 11.0% vs local median 4.1% in Chariton — top-decile yield for the area; either an underpriced asset or a hidden risk that comps aren't pricing in. Stress-test before assuming the spread holds.
Location & tenants
- Location reads 80/100 on livability (#84 in IA, #1,703 nationally) — a professional / high-income tenant draw. Strengths: cost of living A+, housing A+, health & safety A+; Watch: employment C-, amenities F, commute F.
- Chariton Community School District (town): math 57% / reading 65% proficiency, ranked #241 of 289 in IA (top 83%) — acceptable for families but not a draw, mixed tenant base, ~2y average lease.
- Market conditions: 81 active listings in the ZIP; 3 units permitted in Lucas County in 2024 (0 in 5+ unit buildings).
Forward outlook
- Local home prices are declining (-3.0%/yr); year-one equity from $656 of loan paydown is wiped out by about $3k of value loss. Plan a longer hold.
- Lucas County population projected at -23% by 2050 — secular population decline; favor cash flow + early exit over multi-decade hold.
- At projected returns (-3.0% appreciation + 3.0% rent growth), your $27k cash investment doubles in ~8 years — after that, you're playing with house money.
Negotiation context
- It's been on market 22 days — a 2% lower offer ($93k) is reasonable based on typical stale-listing flexibility.
- 2 sale attempts with the ask held roughly flat each time — persistent listings suggest the price (not the market) is what's stuck; bring a comps-based counter.
- Current owner paid $54k; list at $95k implies a 74% gain — meaningful room to come down on a strong offer.
Risks & watch-outs
- Watch-outs: built in 1900 — expect roof / HVAC / electrical / plumbing capex.
- Climate carrying-cost: moderate wildfire risk — expect insurance premiums to compound above CPI over the hold.
Questions for the listing agent
- Built in 1900 — when were the roof, HVAC, electrical panel, plumbing, and water heater last replaced?
- Is there a deadline driving the sale (1031 exchange, divorce, estate, relocation)? That informs how much negotiation room exists.
- Schools are A-rated — typically a magnet for longer-tenancy family renters. What's the average tenant stay here, and is there a school-zone premium baked into asking?
- What's the average days-on-market for RENTAL listings here right now (not sales)? A rising rental-DOM trend means longer vacancies and softer asking-rent achievability than the comps imply.
- What's the recent tenant-quality profile in this submarket — average credit score on applications, eviction rate, late-payment / NSF rate, and stable-employment percentage? A property-management company in the area should have these aggregated.
- How much new for-sale + rental construction is in the pipeline within 1–3 miles? Heavy new supply typically softens prices + rents 12–24 months out; constrained supply supports both.
Investment metrics
- 1% rule
- 1.38% ✓
- Cap rate
- 11.01%
- Cash-on-cash
- 16.85%
- DSCR
- 1.75
- GRM
- 6.0
CMA / ARV
- ARV (on-the-fly)
- $182,058
- Comps found
- 12
Show comp detail 12 sales within ~0.75 mi
| Address | Dist | Beds/Ba | Sqft | Sold | Price | $/sf | Match |
|---|---|---|---|---|---|---|---|
| 505 S 8th St | 0.46mi | 4/2.5 | 1,598 (+0%) | 6mo | $128,800 | $81 | 72 |
| 302 S Grand St | 0.26mi | 3/1.0 (-1) | 1,680 (+5%) | 8mo | $20,000 | $12 | 63 |
| 1219 Braden Ave | 0.49mi | 3/1.0 (-1) | 1,557 (-2%) | 6mo | $175,000 | $112 | 59 |
| 1108 Hillcrest Ct | 0.60mi | 3/2.5 (-1) | 1,580 (-1%) | 7mo | $250,000 | $158 | 57 |
| 1344 Braden Ave | 0.61mi | 3/2.0 (-1) | 1,500 (-6%) | 4mo | $170,000 | $113 | 53 |
| 710 N 6th St | 0.53mi | 3/2.0 (-1) | 1,668 (+4%) | 14mo | $250,000 | $150 | 52 |
| 514 S Main St | 0.47mi | 4/2.0 | 1,831 (+15%) | 3mo | $225,000 | $123 | 51 |
| 456 S 8th Street St | 0.39mi | 4/2.5 | 1,409 (-12%) | 14mo | $160,000 | $114 | 48 |
| 1106 Woodlawn Ave | 0.46mi | 3/3.0 (-1) | 1,456 (-9%) | 15mo | $445,000 | $306 | 42 |
| 1223 Park Ave | 0.73mi | 4/2.0 | 1,780 (+12%) | 12mo | $190,000 | $107 | 37 |
| 1405 Woodlawn Ave | 0.67mi | 3/1.5 (-1) | 1,728 (+8%) | 16mo | $127,000 | $73 | 35 |
| 1303 Braden Ave | 0.55mi | 3/2.5 (-1) | 1,384 (-13%) | 17mo | $290,000 | $210 | 31 |
Match score weights: distance 35% · size 25% · config 20% · recency 20%. Top-matched comps best support the ARV.
Projected returns pro-forma
-3.0% appreciation · 3.0% rent growth · sell at horizon
- IRR
- 8.1%
- Equity multiple
- 1.32×
- Total profit
- $8,397
- Equity at exit
- $14,128
- IRR
- 17.3%
- Equity multiple
- 2.43×
- Total profit
- $37,963
- Equity at exit
- $8,192
Cash invested: $26,530 (down + closing). Projections, not guarantees.
Landlord ↔ Tenant lean methodology
- Overall (STATE)
- 83 Strongly Landlord-Friendly
- State Iowa
- 83 Strongly Landlord-Friendly · R+6
- County
- — inherits STATE
- City
- — inherits STATE
ZIP-level market 50049
- Home prices YoY
- -4.4%
- Active inventory
- 81
- Price-to-rent
- 6.0×
Monthly cashflow live
- Estimated rent
- $1,310 medium interval (Pro) →
- Mortgage (P&I)
- −$497
- Tax from tax record
- −$126 /mo · $1,516/yr
- Insurance
- −$39
- HOA
- −$0
- Vacancy / Maint / Mgmt
- −$275
- Net cashflow
- $373
Break-even live
Sensitivity live
| Price | -10% $426 | -5% $399 | +0% $373 | +5% $346 | +10% $319 |
|---|---|---|---|---|---|
| Rent | -10% $269 | -5% $321 | +0% $373 | +5% $424 | +10% $476 |
| Rate | -1.0pp $420 | -0.5pp $397 | base $373 | +0.5pp $348 | +1.0pp $323 |
UW: 25.0% down · 7.5% · 30yr · 1.5% tax · 5.0% vac · 8.0% maint · 8.0% mgmt
Financing live
Cash to close
- Down payment
- $23,688
- Closing costs
- $2,842
- Reserves months
- —
- Total cash needed
- —
Loan-product check · same deal, 3 products live
Conventional
25% down · 7.5% · 30yr
- Down + closing
- —
- Monthly P&I
- —
- Monthly cashflow
- —
- DSCR
- —
- Eligible?
- —
Personal DTI + credit; lowest rate.
DSCR
20% down · 8.5% · 30yr
- Down + closing
- —
- Monthly P&I
- —
- Monthly cashflow
- —
- DSCR
- —
- Eligible?
- —
No personal income docs; deal must DSCR.
Hard money
10% down · 12.0% · 12mo
- Down + closing
- —
- Monthly P&I
- —
- Monthly cashflow
- —
- DSCR
- —
- Eligible?
- —
Short-term bridge; refi at stabilization.
Listing history 19 events
-
2026-06-21days on market $94,750 Active 22 DOM
-
2026-06-18days on market $94,750 Active 20 DOM
-
2026-06-17days on market $94,750 Active 19 DOM
-
2026-06-16days on market $94,750 Active 18 DOM
-
2026-06-15days on market $94,750 Active 17 DOM
-
2026-06-13days on market $94,750 Active 15 DOM
-
2026-06-12days on market $94,750 Active 14 DOM
-
2026-06-09days on market $94,750 Active 11 DOM
-
2026-06-08days on market $94,750 Active 10 DOM
-
2026-06-07days on market $94,750 Active 9 DOM
-
2026-06-07days on market $94,750 Active 8 DOM
-
2026-06-04days on market $94,750 Active 5 DOM
-
2026-06-02days on market $94,750 Active 4 DOM
-
2026-06-01days on market $94,750 Active 3 DOM
-
2026-05-31days on market $94,750 Active 2 DOM
-
2026-05-28$94,750 Active
-
2025-07-18$94,500 Active
-
2022-11-10soldstatus $54,500
-
2019-12-24soldstatus $54,400
ⓘ Source: listings_history table (triggers on properties + properties_extension) + one-shot
backfill from property_details.listing_events for pre-trigger history.
Tax reassessment forecast IA · Partial reset (capped growth)
- Current annual tax
- $1,516 · $126/mo
- Projected year-2 tax
- $1,516 · $126/mo
- Expected delta
- $0/yr ($0/mo · 0.0%)
ⓘ Screening estimate from a state-policy table — verify with the county assessor before closing.
Climate risk First Street
- Flood 1/10 Low FEMA zone X (unshaded) · 0% chance over 30 yrs
- Wildfire 5/10 Major
- Heat 3/10 Moderate 7 d/yr ≥104°F today · 15 d/yr by 30 yrs out
- Wind 2/10 Low
- Air quality 2/10 Low 1 unhealthy d/yr today · 2 by 30 yrs out
Nearby sold comps map
Loading sold comps map…
Walkable amenities ~0.75 mi
Loading nearby amenities…
Taxation est. · year 1
- Rental income
- $15,725
- − Mortgage interest
- −$5,307
- − Property taxes
- −$1,516
- − Insurance
- −$474
- − Repairs & maintenance
- −$1,258
- − Management
- −$1,258
- − Depreciation
- −$2,756
- Taxable income
- $3,155
- Est. tax owed @ 24.0%
- −$757
- After-tax cash flow
- $3,713/yr
For passive investors: Depreciation is non-cash, so a rental often shows a tax loss while cash-flowing — sheltering income. Rental losses are passive: they offset passive income freely, and up to $25,000/yr can offset ordinary (W-2) income if you actively participate and your MAGI is under $100k (phasing out to $0 by $150k); unused losses carry forward. On sale, claimed depreciation is recaptured at up to 25%, and gains may owe capital-gains tax (a 1031 exchange can defer both). Figures are a year-1 estimate at your 24.0% rate — not tax advice; consult a CPA.
Schools (NCES district)
- District
- Chariton Community School District
- NCES district ID
- 1907050
- Math proficiency
- 57% ▼ -11.00%
- Reading proficiency
- 65% ▼ -6.00%
- Median HH income
- $44,415
- Composite
- 51.35/100
- National rank
- #1738
- State rank
- #241 of 289 in IA
Livability — Chariton
- Score
- 80/100
- State rank
- #84
- US rank
- #1703
Category grades
Schools grade is shown separately in the Schools card above.
Census & demographics
- Census place
- Chariton, IA
- Population (ZIP)
- 6,425
Population outlook (Lucas County) Hauer SSP2
- Today (2025)
- 8,106 people
- By 2030
- 7,755 · -4.3%
- By 2040
- 7,007 · -13.6%
- By 2050
- 6,265 · -22.7%
- By 2075
- 4,926 · -39.2%
- By 2100
- 3,792 · -53.2%
Race, ethnicity, and origin ACS 2023
- Neighborhood character
- Predominantly White (95%)
- Race & ethnicity
- White 95% Two or more races 3% Hispanic / Latino 2% Asian 1%
- Common ancestry
- Iranian 3% Italian 2% Slovak 2%
- Foreign-born
- 2% · Canada
- Languages at home
- 95% English-only · German/W. Germanic 2% Spanish 2% Other Asian/Pacific 1%
Political lean MEDSL · Lucas
- 2024 margin
- Solid R (+48.1) · D 25.2% · R 73.3% · Other 1.5%
- 2008→2024 swing
- -41.4pp toward R · 2008: -6.7pp · 2024: -48.1pp
- All cycles
- 2024: R+48.1 2020: R+43.3 2016: R+38.1 2012: R+6.3 2008: R+6.7
Not yet ingested
- Civics
- —
Market trends
- HPI YoY
- ▼ -10.20%
- Current HPI
- 220.0223
- Rent YoY
- —
- Metro
- —
- State GDP YoY
- ▲ 2.48%
- F500 in state
- 4
Industry mix (Fortune 500 HQ in IA)
| Industry | F500 HQs | Revenue |
|---|---|---|
| Financial Services | 1 | $16B |
|
||
| Retail / Convenience | 1 | $15B |
|
||
Price history
+74.2% since first listed4 events — show timeline
- 2026-05-28 Listed $94,750 IAR
- 2025-07-18 Listed $94,500 IAR
- 2022-11-10 Sold (Public Records) $54,500 Public Records
- 2019-12-24 Sold (Public Records) $54,400 Public Records
Property tax history
+2.3%/yrLatest (2025): $1,516 · +5.7% YoY. Source: county tax records.
Cash-flow waterfall
monthlySold comps — $/sqft
last 12 mo · ≤1 miLoading sold comps…