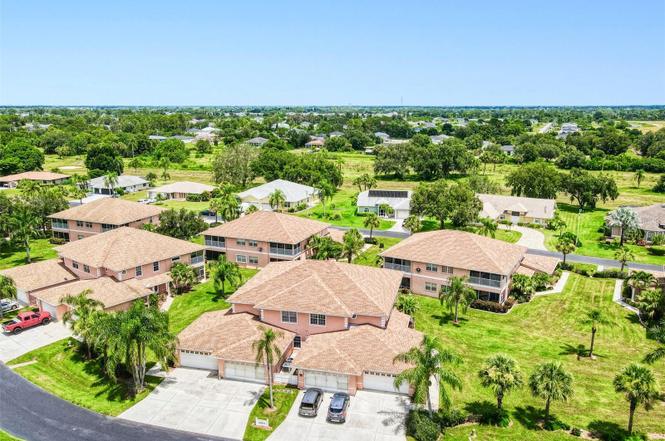
19977 Lake Vista Cir Unit 17D · Lehigh Acres, FL
Flood risk 1/10 · Minimal
- FEMA flood zone
- X (unshaded)
- Chance of flooding over 30 yrs
- 0.0%
- Est. flood insurance / yr
- $507 – $1,088
Fire risk 4/10 · Minor
- Est. fire insurance / yr
- $947 – $1,759
Heat risk 10/10 · Severe
- Hot days now (above 108°F)
- 7 days/yr
- Hot days in 30 yrs
- 30 days/yr
Wind risk 10/10 · Severe
- Chance of severe wind over 30 yrs
- 99.0%
Air-quality risk 2/10 · Minimal
- Unhealthy air days now
- 1 days/yr
- Unhealthy air days in 30 yrs
- 2 days/yr
Risk factors via First Street. Map © Google.
Why this score? — see what drove the D grade
The composite is a weighted blend of 9 inputs, each scored 0–100. Each bar is that input's sub-score; the figure is the points it added to the 100-point composite (weight × sub-score).
- Cash flow +12.1/30.0
- ARV discount +7.5/15.0
- 1% rule +5.3/10.0
- Schools +4.1/10.0
- DSCR +3.6/10.0
- Livability +3.0/5.0
- Condition / age +2.5/5.0
- Rent growth +2.3/5.0
- Appreciation +0.0/10.0
$189,900
🖨 Deal sheet (PDF) 📄 Offer letter ✓ Due diligence
Listing remarks
Back on the Market! You do not want to miss out! Move-In Ready & Meticulously Maintained! Discover the perfect blend of style, comfort, and convenience in this beautifully refreshed 3-bedroom, 2-bathroom coach home with a 2-car garage. Offering over 1,500 square feet of spacious living, this second-floor residence boasts a bright, welcoming entryway and an open floor plan filled with natural light, abundant closet space, and thoughtful design throughout. The heart of the home is the open, airy kitchen—designed to bring everyone together with plenty of counter space, solid wood, soft-close cabinetry, and a layout perfect for entertaining or everyday living. Both bathrooms have be
Key facts
- Open floor plan
- Natural light
- Move in ready
Tags
Property features AI
Finance
- Other: Unfurnished; Association approval required for buyers
- Financial info: Total annual fees listed at $3,080 and total monthly fees about $256.67; Lease restrictions apply
- HOA & community: HOA required; association fees include common area taxes, insurance, maintenance (structure and grounds), management, trash, escrow reserves and private road; Monthly HOA amount approximately $36 (annual association fee $432); Monthly condo fee about $77 (annual condo fees $920); Community features: buyer approval required, golf carts allowed, no truck/RV/motorcycle parking; Pets allowed with breed restrictions; cats and dogs permitted
Exterior
- Parking: Driveway; Attached garage with garage door opener; 2 garage spaces
- Security: Buyer association approval required
- Utilities: Public water; Public sewer; Electricity connected; Cable available and connected; BB/HS internet available; Underground utilities; Sprinkler well; Water connected; Sewer connected
- Home design: Residential condominium; Two stories; Faces southeast; Second-floor unit
- Construction: Block construction; Shingle roof; Slab foundation; Built as part of building 19977/3
- Exterior features: Exterior lighting; Rain gutters; Sliding doors; Irrigation equipment; Landscaped and cleared lot; Paved surfaces
Interior
- Kitchen: Dishwasher; Range; Microwave; Refrigerator; Freezer; Ice maker; Electric water heater; Water softener
- Bedrooms: 3 bedrooms
- Flooring: Laminate flooring; Tile flooring
- Bathrooms: 2 full bathrooms
- Heating & cooling: Electric heating; Exhaust fan; Central air conditioning
- Interior features: Cathedral and vaulted ceilings; High ceilings; Ceiling fans; Crown molding; Open floorplan with kitchen/family room combo; Solid wood cabinets; Thermostat; Walk-in closets; Window treatments
- Laundry & utility: Washer and dryer hookups; Inside laundry on upper level; Electric dryer hookup
Neighborhood map
What this means for you Summary
Snapshot
- This is a 3-bed/2.0-bath condo listed at $190k.
Deal economics
- At list price, monthly cash flow is $-41 ($-492/yr) — negative.
- To cash-flow at today's rent, offer at most $183k (3.8% below list).
- Meets the 1% rule at list price ($2k rent vs $190k).
- Recommended offer: $167k (12.0% below list) — sets the bar for market timing.
- Cap rate 6.0% vs local median 4.7% in Lehigh Acres — meaningfully above typical; check what's discounted (condition, days-on-market, listing class) to confirm the premium yield is real.
Location & tenants
- Location reads 59/100 on livability (#826 in FL) — a working-class tenant base; expect higher turnover. Strengths: cost of living A+, housing A+; Watch: crime C-, employment D+, amenities F.
- Lee (suburban): math 47% / reading 50% proficiency, ranked #42 of 73 in FL (top 58%) — families likely to look elsewhere, expect single-tenant / working-renter base with shorter leases.
- Zoned schools: Mirror Lakes Elementary School (math 48% / reading 45%, grade D-, #1,223 of 2,144 statewide, top 57%, 1,228 students, 68% FRL); Oak Hammock Middle School (math 43% / reading 41%, grade D-, #340 of 571 statewide, top 61%, 1,563 students, 56% FRL); Lehigh Senior High School (math 23% / reading 45%, grade F, #394 of 667 statewide, top 60%, 2,476 students, 57% FRL) — zoned schools at 60% FRL track the district average.
- Market conditions: Rents soft (-0.8%/yr); 644 active listings in the ZIP; 40 comparable units currently listed for rent nearby; rentals at typical pace (median 26d on market — plan ~3-4 weeks tenant-placement turnaround); 15,411 units permitted in Lee County in 2024 (4,686 in 5+ unit buildings).
- At $1,947/mo this rent would consume 45% of the median local household income ($51k/yr) (locally 1027% of renters already pay >50% of income on rent) — very limited rent-growth headroom before tenants either downsize or default.
Forward outlook
- Local home prices are declining (-3.0%/yr); year-one equity from $1k of loan paydown is wiped out by about $6k of value loss. Plan a longer hold.
- Lee County population projected at +44% by 2050 — long-run rental-demand tailwind backs the buy-and-hold thesis.
Negotiation context
- It's been on market 301 days — a 12% lower offer ($167k) is reasonable based on typical stale-listing flexibility.
- 5 sale attempts since 13y ago; this cycle's ask has dropped $30k (14%) from the opening price — seller is motivated, your offer sets the floor, not the list.
Risks & watch-outs
- Climate carrying-cost: severe wind risk, 99% chance of damaging wind over 30y; extreme-heat days projected 7→30/yr by 2055 (HVAC capex compounding) — expect insurance premiums to compound above CPI over the hold.
Questions for the listing agent
- What do current leases actually rent for vs. the listed asking? Can we see a recent rent roll and the last 12 months of T-12 income?
- It's been on market 301 days. Have you received any prior offers? Is the seller open to a 12% concession, seller financing, or rate buy-down credit?
- What does the HOA fee cover, when was the last increase, and are there any pending special assessments or reserve-fund shortfalls?
- Any open or pending special assessments — roof, HVAC, plumbing, elevator, façade? What's the per-unit balance and payoff schedule, and is the seller paying it off at close or rolling it to the buyer?
- Why hasn't it sold? Are there any deal-killer items the seller is aware of (foundation, flood, title, zoning, code violations)?
- Is there a deadline driving the sale (1031 exchange, divorce, estate, relocation)? That informs how much negotiation room exists.
- Schools are D-rated, which usually means shorter tenancies and higher turnover. Who's the typical renter profile here, and what's been the actual vacancy rate?
- The area grade is low — what's the realistic commute time and amenity access for the typical tenant pool here? Any planned neighborhood developments (good or bad) we should know about?
- What's the average days-on-market for RENTAL listings here right now (not sales)? A rising rental-DOM trend means longer vacancies and softer asking-rent achievability than the comps imply.
- What's the recent tenant-quality profile in this submarket — average credit score on applications, eviction rate, late-payment / NSF rate, and stable-employment percentage? A property-management company in the area should have these aggregated.
- How much new apartment / multifamily construction is in the pipeline within 1–3 miles? Heavy new supply (>2% of stock underway) typically softens rents 12–24 months out; light construction supports rent growth.
Investment metrics
- 1% rule
- 1.03% ✓
- Cap rate
- 6.03%
- Cash-on-cash
- -0.93%
- DSCR
- 0.96
- GRM
- 8.1
CMA / ARV
No comps found within radius.
Projected returns pro-forma
-3.0% appreciation · 0.0% rent growth · sell at horizon
- IRR
- -21.9%
- Equity multiple
- 0.27×
- Total profit
- $-38,896
- Equity at exit
- $28,315
- IRR
- -28.3%
- Equity multiple
- -0.10×
- Total profit
- $-58,495
- Equity at exit
- $16,419
Cash invested: $53,172 (down + closing). Projections, not guarantees.
Landlord ↔ Tenant lean methodology
- Overall (STATE)
- 87 Strongly Landlord-Friendly
- State Florida
- 87 Strongly Landlord-Friendly · R+3
- County
- — inherits STATE
- City
- — inherits STATE
ZIP-level market 33936
- Home prices YoY
- -19.9%
- Rents YoY
- -0.8%
- Active inventory
- 644
- Price-to-rent
- 8.1×
Monthly cashflow live
- Estimated rent
- $1,947 high interval (Pro) →
- Mortgage (P&I)
- −$996
- Tax from tax record
- −$248 /mo · $2,975/yr
- Insurance
- −$79
- HOA
- −$256
- Vacancy / Maint / Mgmt
- −$409
- Net cashflow
- $-41
Break-even live
Sensitivity live
| Price | -10% $66 | -5% $13 | +0% $-41 | +5% $-95 | +10% $-149 |
|---|---|---|---|---|---|
| Rent | -10% $-195 | -5% $-118 | +0% $-41 | +5% $36 | +10% $113 |
| Rate | -1.0pp $55 | -0.5pp $7 | base $-41 | +0.5pp $-90 | +1.0pp $-140 |
UW: 25.0% down · 7.5% · 30yr · 1.5% tax · 5.0% vac · 8.0% maint · 8.0% mgmt
Financing live
Cash to close
- Down payment
- $47,475
- Closing costs
- $5,697
- Reserves months
- —
- Total cash needed
- —
Loan-product check · same deal, 3 products live
Conventional
25% down · 7.5% · 30yr
- Down + closing
- —
- Monthly P&I
- —
- Monthly cashflow
- —
- DSCR
- —
- Eligible?
- —
Personal DTI + credit; lowest rate.
DSCR
20% down · 8.5% · 30yr
- Down + closing
- —
- Monthly P&I
- —
- Monthly cashflow
- —
- DSCR
- —
- Eligible?
- —
No personal income docs; deal must DSCR.
Hard money
10% down · 12.0% · 12mo
- Down + closing
- —
- Monthly P&I
- —
- Monthly cashflow
- —
- DSCR
- —
- Eligible?
- —
Short-term bridge; refi at stabilization.
Rent comps 40 comps
| Address | Beds | Baths | Sqft | Rent | $/sqft | DOM | Units | Dist |
|---|---|---|---|---|---|---|---|---|
| 19949 Lake Vista Cir Unit 16C Lehigh Acres, FL | 3.0 | 2.0 | 1517 | $1,600 | $1.05 | 25d | 1 | 0.03mi |
| 19933 Lake Vista Cir Lehigh Acres, FL | 3.0 | 2.0 | 1776 | $1,750 | $0.99 | 21d | 1 | 0.04mi |
| 19949 Lake Vista Cir N #1 Lehigh Acres, FL | 3.0 | 2.0 | 1442 | $1,800 | $1.25 | 25d | 1 | 0.05mi |
| 351 Ranchito Ave Lehigh Acres, FL | 3.0 | 2.5 | 1500 | $2,000 | $1.33 | 25d | 1 | 0.18mi |
| 20055 Lake Vista Cir N Lehigh Acres, FL | 3.0 | 2.0 | 1442 | $1,700 | $1.18 | 25d | 1 | 0.20mi |
| 20012 Petrucka Cir N Unit D Lehigh Acres, FL | 3.0 | 2.0 | 1517 | $1,750 | $1.15 | 25d | 1 | 0.24mi |
| 532 Ilaria Ct Lehigh Acres, FL | 4.0 | 2.0 | 1598 | $2,300 | $1.44 | 18d | 1 | 0.31mi |
| 337 Rancho Ave Lehigh Acres, FL | 3.0 | 2.0 | 1723 | $2,150 | $1.25 | 25d | 1 | 0.31mi |
| 448 Reading St Lehigh Acres, FL | 3.0 | 2.0 | 1100 | $1,890 | $1.72 | 5d | 1 | 0.35mi |
| 467 Raymer St Lehigh Acres, FL | 4.0 | 2.0 | 1833 | $1,850 | $1.01 | 12d | 1 | 0.36mi |
| 334 Ranch Ave Lehigh Acres, FL | 3.0 | 2.0 | 1645 | $2,150 | $1.31 | 5d | 1 | 0.37mi |
| 438 Poplar St Lehigh Acres, FL | 3.0 | 2.0 | 1640 | $2,150 | $1.31 | 5d | 1 | 0.38mi |
| 477 Rayford St Lehigh Acres, FL | 4.0 | 3.0 | 1715 | $2,000 | $1.17 | 25d | 1 | 0.40mi |
| 437 Reading St Lehigh Acres, FL | 4.0 | 2.0 | 1833 | $1,795 | $0.98 | 4d | 1 | 0.43mi |
| 472 Rajah St Lehigh Acres, FL | 3.0 | 2.0 | 1715 | $2,200 | $1.28 | 5d | 1 | 0.43mi |
| 19882 Green Pasture Rd Lehigh Acres, FL | 4.0 | 2.0 | 1942 | $2,350 | $1.21 | 25d | 1 | 0.43mi |
| 19931 Green Pasture Rd Lehigh Acres, FL | 4.0 | 2.0 | 1817 | $2,248 | $1.24 | 25d | 1 | 0.46mi |
| 463 Piedmont St Unit 463 Lehigh Acres, FL | 3.0 | 2.0 | 1200 | $1,350 | $1.12 | 5d | 1 | 0.46mi |
| 448 Grant Blvd Unit 1 Lehigh Acres, FL | 2.0 | 2.0 | 1244 | $1,595 | $1.28 | 3d | 1 | 0.52mi |
| 448 Grant Blvd Unit 1 Lehigh Acres, FL | 3.0 | 2.0 | 1244 | $1,650 | $1.33 | 23d | 1 | 0.52mi |
| 448 Grant Blvd Unit 1 Lehigh Acres, FL | 2.0 | 2.0 | 1244 | $1,595 | $1.28 | 4d | 1 | 0.52mi |
| 442 Grant Blvd Lehigh Acres, FL | 3.0 | 2.0 | 1199 | $1,625 | $1.36 | 15d | 1 | 0.55mi |
| 20050 Caroline Creek Pl Lehigh Acres, FL | 4.0 | 2.5 | 1885 | $2,300 | $1.22 | 25d | 1 | 0.56mi |
| 20190 Caroline Creek Pl Unit 250 Lehigh Acres, FL | 3.0 | 2.0 | 1448 | $1,900 | $1.31 | 5d | 1 | 0.59mi |
| 20190 Caroline Creek Pl Unit 250 Lehigh Acres, FL | 3.0 | 2.0 | 1448 | $2,200 | $1.52 | 25d | 1 | 0.59mi |
| 11621 Savanna Lakes Blvd Lehigh Acres, FL | 4.0 | 3.0 | 2174 | $2,200 | $1.01 | 18d | 1 | 0.60mi |
| 11918 Savanna Lakes Blvd Lehigh Acres, FL | 3.0 | 2.0 | 1484 | $2,000 | $1.35 | 25d | 1 | 0.62mi |
| 374 Compese Ave S Lehigh Acres, FL | 3.0 | 2.0 | 1200 | $1,750 | $1.46 | 18d | 1 | 0.63mi |
| 12321 Dakota Ridge Pl Lehigh Acres, FL | 3.0 | 2.0 | 1448 | $1,850 | $1.28 | 16d | 1 | 0.64mi |
| 12312 Amber Waves Rd Lehigh Acres, FL | 4.0 | 2.0 | 1937 | $2,325 | $1.20 | 21d | 1 | 0.66mi |
| 12312 Amber Waves Rd Unit NA Lehigh Acres, FL | 4.0 | 2.0 | 1941 | $2,325 | $1.20 | 25d | 1 | 0.66mi |
| 520 Creuset Ave S Lehigh Acres, FL | 2.0 | 2.0 | 1050 | $1,700 | $1.62 | 25d | 1 | 0.68mi |
| 333 Pinehurst Ave Lehigh Acres, FL | 3.0 | 2.0 | 1545 | $2,100 | $1.36 | 25d | 1 | 0.70mi |
| 12441 Dakota Ridge Pl Lehigh Acres, FL | 4.0 | 2.5 | 1885 | $2,150 | $1.14 | 25d | 1 | 0.72mi |
| 397 Carrillon Ave S Lehigh Acres, FL | 3.0 | 2.0 | 1200 | $1,550 | $1.29 | 5d | 1 | 0.73mi |
| 510 Caywood Ave S Lehigh Acres, FL | 3.0 | 2.0 | 1582 | $2,664 | $1.68 | 25d | 1 | 0.74mi |
| 363 Grant Blvd Lehigh Acres, FL | 3.0 | 2.0 | 1158 | $1,700 | $1.47 | 25d | 1 | 0.77mi |
| 357 Grant Blvd Lehigh Acres, FL | 3.0 | 2.0 | 1200 | $1,800 | $1.50 | 18d | 1 | 0.79mi |
| 19750 Garden Ridge Ct Lehigh Acres, FL | 4.0 | 2.5 | 1400 | $2,200 | $1.57 | 25d | 1 | 0.79mi |
| 418 Pickford Ave Lehigh Acres, FL | 4.0 | 2.0 | 1937 | $2,450 | $1.26 | 25d | 1 | 0.82mi |
HOA detail condo
- Monthly dues
- $256 · $3,072/yr
- Assessments
- None detected in remarks — confirm with the listing agent.
Listing history 26 events
-
2026-06-22days on market $189,900 Active 301 DOM
-
2026-06-17days on market $189,900 Active 297 DOM
-
2026-06-16days on market $189,900 Active 296 DOM
-
2026-06-16days on market $189,900 Active 295 DOM
-
2026-06-13days on market $189,900 Active 293 DOM
-
2026-06-09days on market $189,900 Active 289 DOM
-
2026-06-07days on market $189,900 Active 287 DOM
-
2026-06-02days on market $189,900 Active 282 DOM
-
2026-06-01days on market $189,900 Active 281 DOM
-
2026-06-01days on market $189,900 Active 280 DOM
-
2026-04-13status Active
-
2026-03-31status Pending
-
2026-03-31historical
-
2026-03-27status Pending
-
2026-02-06price $189,900
-
2025-11-14price $192,000
-
2025-11-14price $192,000
-
2025-10-24price $197,000
-
2025-10-24price $197,000
-
2025-08-07$220,000 Active
-
2025-07-25$220,000 Active
-
2021-12-16soldstatus $203,000
-
2015-01-10historical
-
2014-01-27$88,000
-
2014-01-24historical
-
2013-09-26$109,900
ⓘ Source: listings_history table (triggers on properties + properties_extension) + one-shot
backfill from property_details.listing_events for pre-trigger history.
Tax reassessment forecast FL · Resets to sale price
- Current annual tax
- $2,975 · $248/mo
- Projected year-2 tax
- $2,975 · $248/mo
- Expected delta
- $0/yr ($0/mo · 0.0%)
ⓘ Screening estimate from a state-policy table — verify with the county assessor before closing.
Climate risk First Street
- Flood 1/10 Low FEMA zone X (unshaded) · 0% chance over 30 yrs
- Wildfire 4/10 Moderate
- Heat 10/10 Extreme 7 d/yr ≥108°F today · 30 d/yr by 30 yrs out
- Wind 10/10 Extreme 99% chance of damaging wind over 30 yrs
- Air quality 2/10 Low 1 unhealthy d/yr today · 2 by 30 yrs out
Nearby sold comps map
Loading sold comps map…
Walkable amenities ~0.75 mi
Loading nearby amenities…
Taxation est. · year 1
- Rental income
- $23,360
- − Mortgage interest
- −$10,637
- − Property taxes
- −$2,975
- − Insurance
- −$950
- − Repairs & maintenance
- −$1,869
- − Management
- −$1,869
- − HOA
- −$3,072
- − Depreciation
- −$5,524
- Taxable loss
- −$3,536
- Est. tax savings @ 24.0%
- +$849
- After-tax cash flow
- $356/yr
For passive investors: Depreciation is non-cash, so a rental often shows a tax loss while cash-flowing — sheltering income. Rental losses are passive: they offset passive income freely, and up to $25,000/yr can offset ordinary (W-2) income if you actively participate and your MAGI is under $100k (phasing out to $0 by $150k); unused losses carry forward. On sale, claimed depreciation is recaptured at up to 25%, and gains may owe capital-gains tax (a 1031 exchange can defer both). Figures are a year-1 estimate at your 24.0% rate — not tax advice; consult a CPA.
Schools (NCES district)
- District
- Lee
- NCES district ID
- 1201080
- Math proficiency
- 47% ▼ -11.00%
- Reading proficiency
- 50% ▼ -4.00%
- Median HH income
- $49,518
- Composite
- 41.49/100
- National rank
- #3458
- State rank
- #42 of 73 in FL
Livability — Lehigh Acres
- Score
- 59/100
- State rank
- #826
- US rank
- #20055
Category grades
Schools grade is shown separately in the Schools card above.
Census & demographics
- Census place
- Lehigh Acres, FL
- County
- Lee County · 788,662 people
- City population
- 130,638
- Metro
- Cape Coral-Fort Myers, FL
- Population (ZIP)
- 27,967
- Household income
- $51,417
- Rent vs Own
- Severe rent burden
- 1027.0
Population outlook (Lee County) Hauer SSP2
- Today (2025)
- 871,946 people
- By 2030
- 955,468 · +9.6%
- By 2040
- 1,113,587 · +27.7%
- By 2050
- 1,256,891 · +44.1%
- By 2075
- 1,560,270 · +78.9%
- By 2100
- 1,726,848 · +98.0%
Race, ethnicity, and origin ACS 2023
- Neighborhood character
- Diverse neighborhood (Simpson 0.63)
- Race & ethnicity
- Hispanic / Latino 44% White 41% Two or more races 21% Black 9% Asian 1%
- Hispanic origin (detail)
- Mexican 7% Puerto Rican 9% Cuban 18% Dominican 2%
- Common ancestry
- Hispanic 3% Romanian 2% Lithuanian 1%
- Foreign-born
- 28% · Canada, Jamaica
- Languages at home
- 59% English-only · Spanish 36% French/Haitian/Cajun 3% Tagalog/Filipino 1%
Political lean MEDSL · Lee
- 2024 margin
- Strong R (+28.4) · D 35.5% · R 63.9%
- 2008→2024 swing
- -18.0pp toward R · 2008: -10.4pp · 2024: -28.4pp
- All cycles
- 2024: R+28.4 2020: R+19.2 2016: R+20.4 2012: R+16.6 2008: R+10.4
Not yet ingested
- Civics
- —
Market trends
- HPI YoY
- ▼ -86.78%
- Current HPI
- 348.8631
- Rent YoY
- ▼ -0.77%
- Metro
- Cape Coral-Fort Myers, FL
- State GDP YoY
- ▲ 3.28%
- F500 in state
- 36
Industry mix (Fortune 500 HQ in FL)
| Industry | F500 HQs | Revenue |
|---|---|---|
| Industrial Technology | 2 | $29B |
|
||
| Insurance | 2 | $17B |
|
||
| Retail | 1 | $60B |
|
||
| Technology Distribution | 1 | $58B |
|
||
| Homebuilding | 1 | $35B |
|
||
| Technology Manufacturing | 1 | $35B |
|
||
Price history
+72.8% since first listed16 events — show timeline
- 2026-04-13 Relisted — Stellar MLS as Distributed by MLS Grid
- 2026-03-31 Pending — FORTMLS
- 2026-03-31 Listing Removed — FORTMLS
- 2026-03-27 Pending — Stellar MLS as Distributed by MLS Grid
- 2026-02-06 Price Changed $189,900 Stellar MLS as Distributed by MLS Grid
- 2025-11-14 Price Changed $192,000 Stellar MLS as Distributed by MLS Grid
- 2025-11-14 Price Changed $192,000 FORTMLS
- 2025-10-24 Price Changed $197,000 FORTMLS
- 2025-10-24 Price Changed $197,000 Stellar MLS as Distributed by MLS Grid
- 2025-08-07 Listed $220,000 Stellar MLS as Distributed by MLS Grid
- 2025-07-25 Listed $220,000 FORTMLS
- 2021-12-16 Sold (Public Records) $203,000 Public Records
- 2015-01-10 Listing Removed — NAPLESMLS
- 2014-01-27 Listed $88,000 NAPLESMLS
- 2014-01-24 Listing Removed — NAPLESMLS
- 2013-09-26 Listed $109,900 NAPLESMLS
Property tax history
+7.9%/yrLatest (2025): $2,975 · +3.8% YoY. Source: county tax records.
Cash-flow waterfall
monthlySold comps — $/sqft
last 12 mo · ≤1 miLoading sold comps…