20 Pine Dr · Manchester, PA
Flood risk 1/10 · Minimal
- FEMA flood zone
- X (unshaded)
- Chance of flooding over 30 yrs
- 0.0%
- Est. flood insurance / yr
- $473 – $860
Fire risk 1/10 · Minimal
- Est. fire insurance / yr
- $511 – $949
Heat risk 5/10 · Moderate
- Hot days now (above 102°F)
- 7 days/yr
- Hot days in 30 yrs
- 15 days/yr
Wind risk 4/10 · Minor
- Chance of severe wind over 30 yrs
- 9.0%
Air-quality risk 3/10 · Minor
- Unhealthy air days now
- 3 days/yr
- Unhealthy air days in 30 yrs
- 4 days/yr
Risk factors via First Street. Map © Google.
Why this score? — see what drove the F grade
The composite is a weighted blend of 9 inputs, each scored 0–100. Each bar is that input's sub-score; the figure is the points it added to the 100-point composite (weight × sub-score).
- Cash flow +6.7/30.0
- ARV discount +5.4/15.0
- Schools +4.7/10.0
- Livability +3.9/5.0
- 1% rule +2.9/10.0
- Rent growth +2.5/5.0
- Condition / age +2.5/5.0
- DSCR +1.0/10.0
- Appreciation +0.0/10.0
$184,900
🖨 Deal sheet (PDF) 📄 Offer letter ✓ Due diligence
Listing remarks MLS
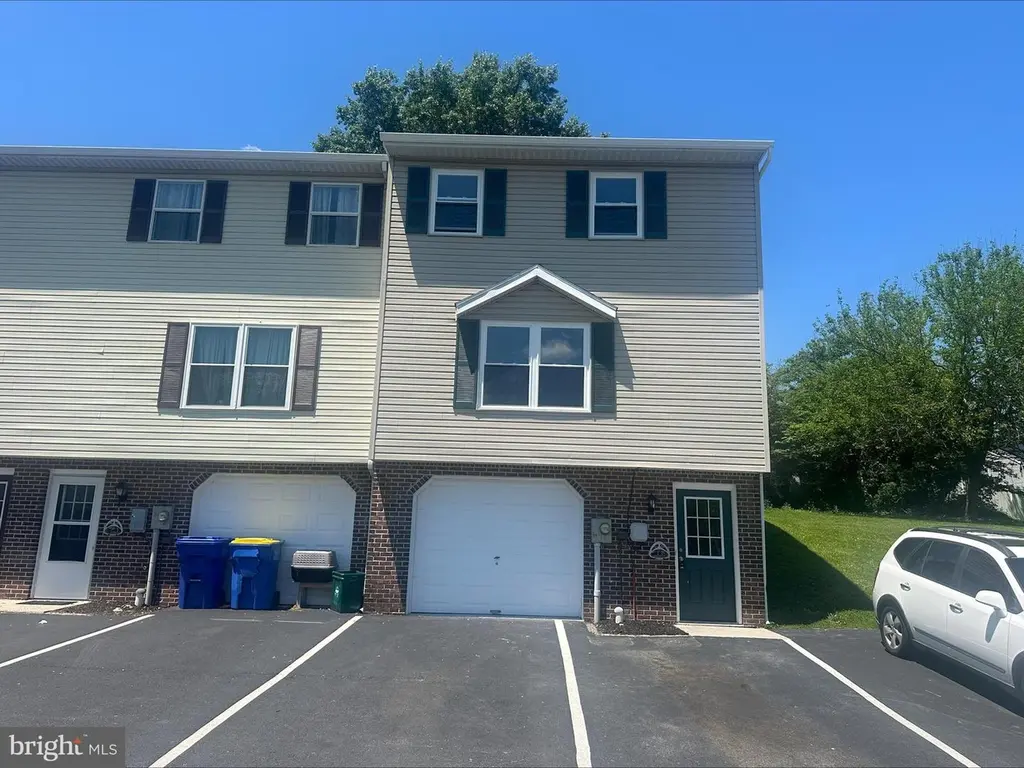
Don't touch a thing! Move in condition, no yard work, no exterior maintenance. Large eat-in kitchen to deck for cook outs & entertaining. A great style of living for the person on the move in today's fast paced society. Freshly painted, new carpets. Close to everything!!!
Key facts
- $190 HOA
- Built 1989
- Listed 8 days
Property features AI
Finance
- HOA & community: Monthly HOA fee of $125; HOA covers exterior building maintenance, lawn maintenance, and snow removal
Exterior
- Parking: Parking lot
- Utilities: Public water; Public sewer; Electric-powered systems; Natural gas for heat
- Home design: Condominium; Interior townhouse/rowhouse; Estimated effective year: 2026
- Construction: Stick-built with vinyl siding and brick; Shingle (asphalt) roof; Permanent foundation; Full basement with poured concrete and outside entrance
- Exterior features: Deck(s); Cleared lot; Corner lot; Not in a federal flood zone; Accessible switches/outlets
Interior
- Kitchen: Dishwasher; Refrigerator; Single oven; Microwave
- Bedrooms: Three bedrooms on the upper level
- Flooring: Vinyl flooring; Carpet
- Bathrooms: One full bathroom; One half bathroom on the main level
- Heating & cooling: Forced air heating (natural gas); Central air conditioning (electric); Electric hot water
- Interior features: Eat-in kitchen; Dining area
- Laundry & utility: Laundry hookups on lower level
Neighborhood map
What this means for you Summary
Snapshot
- This is a 2-bed/2.0-bath townhouse listed at $185k.
Deal economics
- At list price, monthly cash flow is $-294 ($-4k/yr) — negative.
- To cash-flow at today's rent, offer at most $133k (28.1% below list).
- To meet the 1% rule (rent ≥ 1% of price), the offer needs to be $145k (21.3% below list).
- Recommended offer: $133k (28.1% below list) — sets the bar for cash-flow.
- Cap rate 4.4% vs local median 1.8% in Manchester — top-decile yield for the area; either an underpriced asset or a hidden risk that comps aren't pricing in. Stress-test before assuming the spread holds.
Location & tenants
- Location reads 78/100 on livability (#288 in PA, #2,532 nationally) — a middle-class / working-renter tenant base. Strengths: crime A+, cost of living A+, housing A+; Watch: amenities F, commute F.
- Northeastern York SD (suburban): math 45% / reading 63% proficiency, ranked #119 of 539 in PA (top 22%) — acceptable for families but not a draw, mixed tenant base, ~2y average lease.
- Zoned schools: Orendorf El Sch (math 52% / reading 72%, grade B, #313 of 1,518 statewide, top 24%, 355 students, 53% FRL); Northeastern Ms (math 35% / reading 60%, grade C-, #156 of 512 statewide, top 32%, 653 students, 44% FRL); Northeastern Shs (math 73% / reading 50%, grade B-, #74 of 437 statewide, top 17%, 1,175 students, 41% FRL).
- Market conditions: 39 active listings in the ZIP; 7 comparable units currently listed for rent nearby; rentals at typical pace (median 16d on market — plan ~3-4 weeks tenant-placement turnaround); 1,328 units permitted in York County in 2024 (338 in 5+ unit buildings).
Forward outlook
- Local home prices are declining (-3.0%/yr); year-one equity from $1k of loan paydown is wiped out by about $6k of value loss. Plan a longer hold.
Negotiation context
- Only 8 days on market — expect competitive offers; lowballing is unlikely to land.
- 3 sale attempts since 27y ago; this cycle's ask is 85% above the opening price — seller raised mid-cycle; expect resistance to lowballs.
- Current owner paid $100k; list at $185k implies a 85% gain — meaningful room to come down on a strong offer.
Risks & watch-outs
- Climate carrying-cost: extreme-heat days projected 7→15/yr by 2055 (HVAC capex compounding) — expect insurance premiums to compound above CPI over the hold.
Questions for the listing agent
- What do current leases actually rent for vs. the listed asking? Can we see a recent rent roll and the last 12 months of T-12 income?
- What does the HOA fee cover, when was the last increase, and are there any pending special assessments or reserve-fund shortfalls?
- Is there a deadline driving the sale (1031 exchange, divorce, estate, relocation)? That informs how much negotiation room exists.
- Schools are A-rated — typically a magnet for longer-tenancy family renters. What's the average tenant stay here, and is there a school-zone premium baked into asking?
- The area grade is low — what's the realistic commute time and amenity access for the typical tenant pool here? Any planned neighborhood developments (good or bad) we should know about?
- What's the average days-on-market for RENTAL listings here right now (not sales)? A rising rental-DOM trend means longer vacancies and softer asking-rent achievability than the comps imply.
- What's the recent tenant-quality profile in this submarket — average credit score on applications, eviction rate, late-payment / NSF rate, and stable-employment percentage? A property-management company in the area should have these aggregated.
- How much new for-sale + rental construction is in the pipeline within 1–3 miles? Heavy new supply typically softens prices + rents 12–24 months out; constrained supply supports both.
Investment metrics
- 1% rule
- 0.79% ✗
- Cap rate
- 4.38%
- Cash-on-cash
- -6.82%
- DSCR
- 0.70
- GRM
- 10.6
CMA / ARV
- ARV (on-the-fly)
- $176,700
- Comps found
- 7
Show comp detail 7 sales within ~0.75 mi
| Address | Dist | Beds/Ba | Sqft | Sold | Price | $/sf | Match |
|---|---|---|---|---|---|---|---|
| 13 Pine Dr #13 | 0.01mi | 3/1.5 (+1) | 1,140 (0%) | 10mo | $170,000 | $149 | 84 |
| 16 Pine Dr | 0.01mi | 3/1.5 (+1) | 1,140 (0%) | 19mo | $174,857 | $153 | 77 |
| 130 Poplar St | 0.26mi | 3/2.0 (+1) | 1,210 (+6%) | 21mo | $210,500 | $174 | 55 |
| 30 Sedum Ct | 0.53mi | 3/2.0 (+1) | 1,240 (+9%) | 7mo | $180,000 | $145 | 50 |
| 240 Boxwood Rd | 0.33mi | 3/1.5 (+1) | 1,198 (+5%) | 23mo | $220,000 | $184 | 50 |
| 21 Harding St | 0.65mi | 3/1.0 (+1) | 1,146 (+0%) | 23mo | $178,500 | $156 | 41 |
| 525 Glen Dr Unit I525 | 0.66mi | 3/1.5 (+1) | 1,258 (+10%) | 21mo | $195,000 | $155 | 28 |
Match score weights: distance 35% · size 25% · config 20% · recency 20%. Top-matched comps best support the ARV.
Projected returns pro-forma
-3.0% appreciation · 3.0% rent growth · sell at horizon
- IRR
- -28.0%
- Equity multiple
- 0.06×
- Total profit
- $-48,585
- Equity at exit
- $27,569
- IRR
- -26.5%
- Equity multiple
- -0.27×
- Total profit
- $-65,945
- Equity at exit
- $15,987
Cash invested: $51,772 (down + closing). Projections, not guarantees.
Landlord ↔ Tenant lean methodology
- Overall (STATE)
- 62 Landlord-Friendly
- State Pennsylvania
- 62 Landlord-Friendly · EVEN
- County
- — inherits STATE
- City
- — inherits STATE
ZIP-level market 17345
- Home prices YoY
- -16.8%
- Active inventory
- 39
- Price-to-rent
- 10.6×
Monthly cashflow live
- Estimated rent
- $1,455 high interval (Pro) →
- Mortgage (P&I)
- −$970
- Tax from tax record
- −$207 /mo · $2,483/yr
- Insurance
- −$77
- HOA
- −$190
- Vacancy / Maint / Mgmt
- −$305
- Net cashflow
- $-294
Break-even live
Sensitivity live
| Price | -10% $-190 | -5% $-242 | +0% $-294 | +5% $-347 | +10% $-399 |
|---|---|---|---|---|---|
| Rent | -10% $-409 | -5% $-352 | +0% $-294 | +5% $-237 | +10% $-179 |
| Rate | -1.0pp $-201 | -0.5pp $-247 | base $-294 | +0.5pp $-342 | +1.0pp $-391 |
UW: 25.0% down · 7.5% · 30yr · 1.5% tax · 5.0% vac · 8.0% maint · 8.0% mgmt
Financing live
Cash to close
- Down payment
- $46,225
- Closing costs
- $5,547
- Reserves months
- —
- Total cash needed
- —
Loan-product check · same deal, 3 products live
Conventional
25% down · 7.5% · 30yr
- Down + closing
- —
- Monthly P&I
- —
- Monthly cashflow
- —
- DSCR
- —
- Eligible?
- —
Personal DTI + credit; lowest rate.
DSCR
20% down · 8.5% · 30yr
- Down + closing
- —
- Monthly P&I
- —
- Monthly cashflow
- —
- DSCR
- —
- Eligible?
- —
No personal income docs; deal must DSCR.
Hard money
10% down · 12.0% · 12mo
- Down + closing
- —
- Monthly P&I
- —
- Monthly cashflow
- —
- DSCR
- —
- Eligible?
- —
Short-term bridge; refi at stabilization.
Rent comps 7 comps
| Address | Beds | Baths | Sqft | Rent | $/sqft | DOM | Units | Dist |
|---|---|---|---|---|---|---|---|---|
| 30 Loucks St Unit 2 Manchester, PA | 2.0 | 1.0 | 750 | $1,450 | $1.93 | 15d | 1 | 0.38mi |
| 75 N Liverpool St Manchester, PA | 2.0 | 1.0 | 740 | $1,070 | $1.45 | 23d | 1 | 0.70mi |
| 55 N Liverpool St Manchester, PA | 2.0 | 1.0 | 740 | $1,040 | $1.41 | 23d | 1 | 0.73mi |
| 102 S Third St Manchester, PA | 3.0 | 1.5 | 1280 | $1,625 | $1.27 | 15d | 1 | 1.04mi |
| 4000 Emerson Dr Mount Wolf, PA | 1.0–3.0 | 1.0–2.5 | 1196 | $1,810 | $1.51 | 15d | 18 | 1.04mi |
| 70 Pavillion Dr Manchester, PA | 1.0–2.0 | 1.0 | 797 | $1,312 | $1.65 | 15d | 4 | 1.11mi |
| 24 Malvern Dr Manchester, PA | 3.0 | 2.0 | 1118 | $1,895 | $1.69 | 15d | 1 | 1.22mi |
HOA detail
- Monthly dues
- $190 · $2,280/yr
- Likely covers
- exterior maint.
Listing history 12 events
-
2026-06-13status $184,900 Pending 8 DOM
-
2026-06-10days on market $184,900 Active 8 DOM
-
2026-06-09days on market $184,900 Active 7 DOM
-
2026-06-08days on market $184,900 Active 6 DOM
-
2026-06-07days on market $184,900 Active 5 DOM
-
2026-06-05days on market $184,900 Active 2 DOM
-
2026-06-03statusdays on market $184,900 Active 1 DOM
-
2026-06-02days on market $184,900 Coming Soon 4 DOM
-
2026-06-01days on market $184,900 Coming Soon 3 DOM
-
2026-05-31days on market $184,900 Coming Soon 2 DOM
-
2026-05-30remarks 687-char remark
-
2026-05-30$184,900 Coming Soon 1 DOM
ⓘ Source: listings_history table (triggers on properties + properties_extension) + one-shot
backfill from property_details.listing_events for pre-trigger history.
Tax reassessment forecast PA · Partial reset (capped growth)
- Current annual tax
- $2,483 · $207/mo
- Projected year-2 tax
- $2,702 · $225/mo
- Expected delta
- +$219/yr (+$18/mo · 8.8%)
ⓘ Screening estimate from a state-policy table — verify with the county assessor before closing.
Climate risk First Street
- Flood 1/10 Low FEMA zone X (unshaded) · 0% chance over 30 yrs
- Wildfire 1/10 Low
- Heat 5/10 Major 7 d/yr ≥102°F today · 15 d/yr by 30 yrs out
- Wind 4/10 Moderate 9% chance of damaging wind over 30 yrs
- Air quality 3/10 Moderate 3 unhealthy d/yr today · 4 by 30 yrs out
Nearby sold comps map
Loading sold comps map…
Walkable amenities ~0.75 mi
Loading nearby amenities…
Taxation est. · year 1
- Rental income
- $17,457
- − Mortgage interest
- −$10,357
- − Property taxes
- −$2,483
- − Insurance
- −$924
- − Repairs & maintenance
- −$1,397
- − Management
- −$1,397
- − HOA
- −$2,280
- − Depreciation
- −$5,379
- Taxable loss
- −$6,760
- Est. tax savings @ 24.0%
- +$1,622
- After-tax cash flow
- $-1,910/yr
For passive investors: Depreciation is non-cash, so a rental often shows a tax loss while cash-flowing — sheltering income. Rental losses are passive: they offset passive income freely, and up to $25,000/yr can offset ordinary (W-2) income if you actively participate and your MAGI is under $100k (phasing out to $0 by $150k); unused losses carry forward. On sale, claimed depreciation is recaptured at up to 25%, and gains may owe capital-gains tax (a 1031 exchange can defer both). Figures are a year-1 estimate at your 24.0% rate — not tax advice; consult a CPA.
Schools (NCES district)
- District
- Northeastern York SD
- NCES district ID
- 4217520
- Math proficiency
- 45% ▼ -12.00%
- Reading proficiency
- 63% ▼ -10.00%
- Median HH income
- $60,807
- Composite
- 47.06/100
- National rank
- #2338
- State rank
- #119 of 539 in PA
Livability — Manchester
- Score
- 78/100
- State rank
- #288
- US rank
- #2532
Category grades
Schools grade is shown separately in the Schools card above.
Census & demographics
- Population (ZIP)
- 8,106
Population outlook (York County) Hauer SSP2
- Today (2025)
- 454,205 people
- By 2030
- 457,407 · +0.7%
- By 2040
- 457,529 · +0.7%
- By 2050
- 448,261 · -1.3%
- By 2075
- 427,388 · -5.9%
- By 2100
- 384,218 · -15.4%
Race, ethnicity, and origin ACS 2023
- Neighborhood character
- Predominantly White (83%)
- Race & ethnicity
- White 83% Hispanic / Latino 9% Black 4% Two or more races 3% Asian 1%
- Hispanic origin (detail)
- Puerto Rican 4% Dominican 5%
- Common ancestry
- Slovak 4% Romanian 3% Lithuanian 2%
- Foreign-born
- 5% · Canada, Vietnam
- Languages at home
- 91% English-only · Spanish 6% Other Indo-European 1%
Political lean MEDSL · York
- 2024 margin
- Strong R (+25.3) · D 36.9% · R 62.1%
- 2008→2024 swing
- -11.7pp toward R · 2008: -13.6pp · 2024: -25.3pp
- All cycles
- 2024: R+25.3 2020: R+24.6 2016: R+29.3 2012: R+21.2 2008: R+13.6
Not yet ingested
- Civics
- —
Market trends
- HPI YoY
- ▼ -52.05%
- Current HPI
- 258.0184
- Rent YoY
- —
- Metro
- —
- State GDP YoY
- ▲ 1.68%
- F500 in state
- 34
Industry mix (Fortune 500 HQ in PA)
| Industry | F500 HQs | Revenue |
|---|---|---|
| Healthcare | 2 | $309B |
|
||
| Insurance | 2 | $27B |
|
||
| Telecommunications / Media | 1 | $124B |
|
||
| Industrial Distribution | 1 | $22B |
|
||
| Financial Services | 1 | $20B |
|
||
| Chemicals / Materials | 1 | $18B |
|
||
Price history
+131.4% since first listed13 events — show timeline
- 2026-05-29 Coming Soon $184,900 BRIGHT MLS
- 2007-06-06 Sold (Public Records) $99,900 Public Records
- 2007-06-01 Listing Removed — BRIGHT MLS
- 2007-05-30 Sold (MLS) $99,900 BRIGHT MLS
- 2007-04-14 Listed $99,900 BRIGHT MLS
- 2005-11-14 Sold (Public Records) $75,900 Public Records
- 2005-11-11 Sold (MLS) $75,900 BRIGHT MLS
- 2005-10-05 Listing Removed — BRIGHT MLS
- 2005-07-26 Listed $74,900 BRIGHT MLS
- 2000-02-02 Sold (Public Records) $79,900 Public Records
- 2000-01-02 Sold (MLS) $79,900 BRIGHT MLS
- 1999-12-16 Listing Removed — BRIGHT MLS
- 1999-12-02 Listed $79,900 BRIGHT MLS
Property tax history
+1.4%/yrLatest (2025): $2,483 · +1.6% YoY. Source: county tax records.
Cash-flow waterfall
monthlySold comps — $/sqft
last 12 mo · ≤1 miLoading sold comps…