 🌊 Lakefront
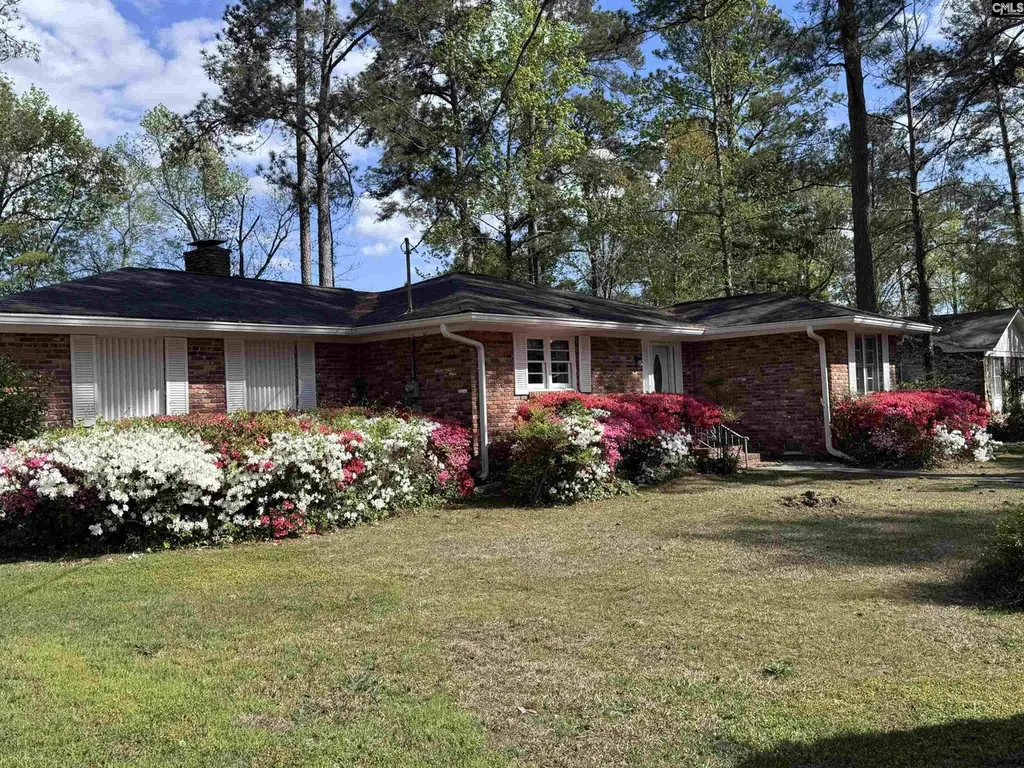
7604 Edgewater Dr · Dentsville, SC
Flood risk 1/10 · Minimal
- FEMA flood zone
- X (unshaded)
- Chance of flooding over 30 yrs
- 0.0%
- Est. flood insurance / yr
- $507 – $1,088
Fire risk 1/10 · Minimal
- Est. fire insurance / yr
- $783 – $1,453
Heat risk 6/10 · Moderate
- Hot days now (above 108°F)
- 7 days/yr
- Hot days in 30 yrs
- 16 days/yr
Wind risk 6/10 · Moderate
- Chance of severe wind over 30 yrs
- 66.0%
Air-quality risk 3/10 · Minor
- Unhealthy air days now
- 2 days/yr
- Unhealthy air days in 30 yrs
- 2 days/yr
Risk factors via First Street. Map © Google.
Why this score? — see what drove the D grade
The composite is a weighted blend of 9 inputs, each scored 0–100. Each bar is that input's sub-score; the figure is the points it added to the 100-point composite (weight × sub-score).
- Cash flow +15.0/30.0
- ARV discount +7.5/15.0
- DSCR +4.6/10.0
- Schools +3.6/10.0
- Livability +3.6/5.0
- 1% rule +3.2/10.0
- Rent growth +2.6/5.0
- Condition / age +2.5/5.0
- Appreciation +0.0/10.0
$175,000
🖨 Deal sheet (PDF) 📄 Offer letter ✓ Due diligence
Listing remarks
Investor Special – Cash Only | AS-IS | 3BR/2BA Brick HomeOpportunity knocks with this 3-bedroom, 2-bath brick home being sold AS-IS, cash only—perfect for investors or buyers looking for a quick project with strong upside potential. This home features a beautiful brick gas fireplace as the focal point of the living area, a spacious sunroom filled with natural light, and a functional layout ready for transformation. Outside, you’ll find a 2-car carport, outdoor storage, and a well-established landscape highlighted by mature, blooming azaleas that add timeless Southern charm. With solid bones and great curb appeal, this property is priced for a fast sale and will not last lo
Key facts
- Outdoor storage
- 2 car carport
- Spacious sunroom
Tags
Property features AI
Finance
- Other: Directions: From I-77, take the exit toward Northeast Drive and head toward N Kings Hwy. Turn right onto Trenholm Road Extension. Continue straight as it becomes Legrand Road. Follow Legrand Road, then turn onto Edgewater Drive. Continue on Edgewater Drive—home will be on the right
- HOA & community: Has an association
Exterior
- Parking: Attached carport; Two garage/car spaces
- Utilities: Public sewer
- Home design: Single-story house
- Construction: Crawlspace foundation
- Exterior features: Brick exterior above foundation; Paved road access; Public water
Interior
- Bedrooms: Master bedroom on the main level
- Bathrooms: Two full bathrooms
- Heating & cooling: Central heating; Central cooling
- Interior features: One fireplace; Total heated area 1,422
Neighborhood map
What this means for you Summary
Snapshot
- This is a 3-bed/2.0-bath single-family listed at $175k.
Deal economics
- At list price, monthly cash flow is $53 ($635/yr) — positive.
- The deal already cash-flows at list — no discount required.
- To meet the 1% rule (rent ≥ 1% of price), the offer needs to be $144k (17.8% below list).
- Recommended offer: $144k (17.8% below list) — sets the bar for 1% rule.
Location & tenants
- Location reads 71/100 on livability (#50 in SC) — a middle-class / working-renter tenant base. Strengths: cost of living A+, health & safety A+, housing A; Watch: amenities D+, crime F, commute F.
- Richland 02 (suburban): math 35% / reading 47% proficiency, ranked #29 of 80 in SC (top 36%) — families likely to look elsewhere, expect single-tenant / working-renter base with shorter leases.
- Zoned schools: Joseph Keels Elementary (math 27% / reading 26%, grade F, #435 of 597 statewide, top 73%, 438 students, 100% FRL); Dent Middle (math 25% / reading 42%, grade F, #113 of 229 statewide, top 50%, 1,018 students, 100% FRL); Westwood High (math 47% / reading 87%, grade B, #73 of 196 statewide, top 41%, 1,684 students, 66% FRL) — zoned schools average 89% FRL vs 38% district-wide (50 pts higher); higher-poverty schools than district average — tighter screening recommended.
- Market conditions: Rents flat; 341 active listings in the ZIP; 20 comparable units currently listed for rent nearby; rentals leasing fast (median 13d on market — plan ~1-2 weeks tenant-placement turnaround); 3,472 units permitted in Richland County in 2024 (1,096 in 5+ unit buildings).
Forward outlook
- Local home prices are declining (-3.0%/yr); year-one equity from $1k of loan paydown is wiped out by about $5k of value loss. Plan a longer hold.
- Richland County population projected at +30% by 2050 — long-run rental-demand tailwind backs the buy-and-hold thesis.
Negotiation context
- It's been on market 51 days — a 3% lower offer ($170k) is reasonable based on typical stale-listing flexibility.
Risks & watch-outs
- Climate carrying-cost: major wind risk, 66% chance of damaging wind over 30y; extreme-heat days projected 7→16/yr by 2055 (HVAC capex compounding) — expect insurance premiums to compound above CPI over the hold.
Questions for the listing agent
- It's been on market 51 days. Have you received any prior offers? Is the seller open to a 18% concession, seller financing, or rate buy-down credit?
- Built in 1962 — when were the roof, HVAC, electrical panel, plumbing, and water heater last replaced?
- What does the HOA fee cover, when was the last increase, and are there any pending special assessments or reserve-fund shortfalls?
- Is there a deadline driving the sale (1031 exchange, divorce, estate, relocation)? That informs how much negotiation room exists.
- Schools are D-rated, which usually means shorter tenancies and higher turnover. Who's the typical renter profile here, and what's been the actual vacancy rate?
- Crime grade is F in this area — have there been break-ins, vandalism, or insurance claims at this property in the last 3 years? What carrier currently insures it and at what premium?
- The area grade is low — what's the realistic commute time and amenity access for the typical tenant pool here? Any planned neighborhood developments (good or bad) we should know about?
- This sits on a lake — are riparian / water-frontage rights deeded with the parcel? Any dock permits, shoreline easements, or HOA water-use restrictions?
- What's the documented flood / surge / shoreline-erosion history here (FEMA AND non-FEMA — e.g., storm surge, creek backup, septic-field saturation)?
- Any water-quality or seasonal algae-bloom issues that affect tenant satisfaction or short-term-rental demand?
- What's the average days-on-market for RENTAL listings here right now (not sales)? A rising rental-DOM trend means longer vacancies and softer asking-rent achievability than the comps imply.
- What's the recent tenant-quality profile in this submarket — average credit score on applications, eviction rate, late-payment / NSF rate, and stable-employment percentage? A property-management company in the area should have these aggregated.
- How much new for-sale + rental construction is in the pipeline within 1–3 miles? Heavy new supply typically softens prices + rents 12–24 months out; constrained supply supports both.
Investment metrics
- 1% rule
- 0.82% ✗
- Cap rate
- 6.66%
- Cash-on-cash
- 1.30%
- DSCR
- 1.06
- GRM
- 10.1
CMA / ARV
No comps found within radius.
Projected returns pro-forma
-3.0% appreciation · 0.21% rent growth · sell at horizon
- IRR
- -17.1%
- Equity multiple
- 0.41×
- Total profit
- $-28,972
- Equity at exit
- $26,093
- IRR
- -14.6%
- Equity multiple
- 0.26×
- Total profit
- $-36,363
- Equity at exit
- $15,131
Cash invested: $49,000 (down + closing). Projections, not guarantees.
Landlord ↔ Tenant lean methodology
- Overall (STATE)
- 90 Strongly Landlord-Friendly
- State South Carolina
- 90 Strongly Landlord-Friendly · R+6
- County
- — inherits STATE
- City
- — inherits STATE
ZIP-level market 29223
- Rents YoY
- 0.2%
- Active inventory
- 341
- Price-to-rent
- 10.1×
Monthly cashflow live
- Estimated rent
- $1,439 high interval (Pro) →
- Mortgage (P&I)
- −$918
- Tax from tax record
- −$76 /mo · $913/yr
- Insurance
- −$73
- HOA
- −$17
- Vacancy / Maint / Mgmt
- −$302
- Net cashflow
- $53
Break-even live
Sensitivity live
| Price | -10% $152 | -5% $102 | +0% $53 | +5% $3 | +10% $-46 |
|---|---|---|---|---|---|
| Rent | -10% $-61 | -5% $-4 | +0% $53 | +5% $110 | +10% $167 |
| Rate | -1.0pp $141 | -0.5pp $97 | base $53 | +0.5pp $8 | +1.0pp $-39 |
UW: 25.0% down · 7.5% · 30yr · 1.5% tax · 5.0% vac · 8.0% maint · 8.0% mgmt
Financing live
Cash to close
- Down payment
- $43,750
- Closing costs
- $5,250
- Reserves months
- —
- Total cash needed
- —
Loan-product check · same deal, 3 products live
Conventional
25% down · 7.5% · 30yr
- Down + closing
- —
- Monthly P&I
- —
- Monthly cashflow
- —
- DSCR
- —
- Eligible?
- —
Personal DTI + credit; lowest rate.
DSCR
20% down · 8.5% · 30yr
- Down + closing
- —
- Monthly P&I
- —
- Monthly cashflow
- —
- DSCR
- —
- Eligible?
- —
No personal income docs; deal must DSCR.
Hard money
10% down · 12.0% · 12mo
- Down + closing
- —
- Monthly P&I
- —
- Monthly cashflow
- —
- DSCR
- —
- Eligible?
- —
Short-term bridge; refi at stabilization.
Rent comps 20 comps
| Address | Beds | Baths | Sqft | Rent | $/sqft | DOM | Units | Dist |
|---|---|---|---|---|---|---|---|---|
| 1682 Horseshoe Dr Unit D Columbia, SC | 2.0 | 2.0 | 1000 | $895 | $0.90 | 16d | 1 | 0.14mi |
| 1728 Springwoods Lake Dr Columbia, SC | 2.0 | 1.5 | 1025 | $1,200 | $1.17 | 5d | 1 | 0.17mi |
| 1718 Horseshoe Dr Apt B Columbia, SC | 2.0 | 1.5 | 1050 | $1,300 | $1.24 | 13d | 1 | 0.20mi |
| 207 Weddell St Unit 1D Columbia, SC | 2.0 | 2.0 | 1200 | $1,100 | $0.92 | 5d | 1 | 0.55mi |
| 1659 Legrand Rd Columbia, SC | 2.0–3.0 | 2.0–2.5 | 1450 | $2,500 | $1.72 | 5d | 12 | 0.56mi |
| 8100 Bayfield Rd Columbia, SC | 3.0 | 1.0–2.0 | 773 | $1,364 | $1.76 | 25d | 1 | 0.64mi |
| 250 Springtree Dr Columbia, SC | 1.0–2.0 | 1.0 | 839 | $1,090 | $1.30 | 5d | 8 | 0.76mi |
| 2920 Chatsworth Rd Apt C Columbia, SC | 2.0 | 2.0 | 980 | $1,100 | $1.12 | 25d | 1 | 0.81mi |
| 2920 Chatsworth Rd Unit A Columbia, SC | 2.0 | 2.0 | 980 | $1,100 | $1.12 | 5d | 1 | 0.81mi |
| 2919 Chatsworth Rd Columbia, SC | 2.0 | 1.0 | 975 | $1,300 | $1.33 | 25d | 1 | 0.82mi |
| 2058 Mapleton Dr Columbia, SC | 3.0 | 2.5 | 1476 | $1,995 | $1.35 | 23d | 1 | 0.91mi |
| 229 Windsor Point Rd Unit 3H Columbia, SC | 2.0 | 2.0 | 1000 | $1,243 | $1.24 | 4d | 1 | 0.94mi |
| 229 Windsor Point Rd Unit 3H Columbia, SC | 2.0 | 2.0 | 1000 | $1,243 | $1.24 | 25d | 1 | 0.94mi |
| 1000 Windsor Shores Dr Columbia, SC | 1.0–3.0 | 1.0–2.0 | 1011 | $1,590 | $1.57 | 25d | 1 | 0.94mi |
| 1310 Oakcrest Dr Columbia, SC | 1.0–3.0 | 1.0–2.0 | 1110 | $1,848 | $1.66 | 5d | 27 | 0.94mi |
| 137 Carr Ln Columbia, SC | 3.0 | 2.5 | 1250 | $1,900 | $1.52 | 5d | 1 | 1.19mi |
| 7400 Hunt Club Rd Columbia, SC | 1.0–3.0 | 1.0–2.0 | 1087 | $1,200 | $1.10 | 25d | 1 | 1.42mi |
| 6837 N Trenholm Rd Columbia, SC | 1.0–3.0 | 1.0–2.0 | 1105 | $1,985 | $1.80 | 5d | 30 | 1.48mi |
| 7502 Hunt Club Rd Columbia, SC | 1.0–2.0 | 1.0–2.0 | 825 | $1,305 | $1.58 | 5d | 22 | 1.48mi |
| 7502 Hunt Club Rd Columbia, SC | 1.0–3.0 | 1.0–2.0 | 875 | $1,515 | $1.73 | 25d | 1 | 1.48mi |
HOA detail
- Monthly dues
- $17 · $204/yr
- Likely covers
- gas
Listing history 18 events
-
2026-06-22days on market $175,000 Active 51 DOM
-
2026-06-18price $175,000 Active 48 DOM
-
2026-06-18days on market $185,000 Active 48 DOM
-
2026-06-17days on market $185,000 Active 47 DOM
-
2026-06-16days on market $185,000 Active 46 DOM
-
2026-06-15days on market $185,000 Active 45 DOM
-
2026-06-14days on market $185,000 Active 43 DOM
-
2026-06-13days on market $185,000 Active 42 DOM
-
2026-06-10days on market $185,000 Active 40 DOM
-
2026-06-09days on market $185,000 Active 39 DOM
-
2026-06-08days on market $185,000 Active 38 DOM
-
2026-06-07days on market $185,000 Active 37 DOM
-
2026-06-05days on market $185,000 Active 34 DOM
-
2026-06-03days on market $185,000 Active 33 DOM
-
2026-06-03days on market $185,000 Active 32 DOM
-
2026-06-01days on market $185,000 Active 31 DOM
-
2026-05-31days on market $185,000 Active 30 DOM
-
2026-05-01$185,000 Active
ⓘ Source: listings_history table (triggers on properties + properties_extension) + one-shot
backfill from property_details.listing_events for pre-trigger history.
Tax reassessment forecast SC · Resets to sale price
- Current annual tax
- $913 · $76/mo
- Projected year-2 tax
- $998 · $83/mo
- Expected delta
- +$84/yr (+$7/mo · 9.3%)
ⓘ Screening estimate from a state-policy table — verify with the county assessor before closing.
Climate risk First Street
- Flood 1/10 Low FEMA zone X (unshaded) · 0% chance over 30 yrs
- Wildfire 1/10 Low
- Heat 6/10 Major 7 d/yr ≥108°F today · 16 d/yr by 30 yrs out
- Wind 6/10 Major 66% chance of damaging wind over 30 yrs
- Air quality 3/10 Moderate 2 unhealthy d/yr today · 2 by 30 yrs out
Nearby sold comps map
Loading sold comps map…
Walkable amenities ~0.75 mi
Loading nearby amenities…
Taxation est. · year 1
- Rental income
- $17,265
- − Mortgage interest
- −$9,803
- − Property taxes
- −$913
- − Insurance
- −$875
- − Repairs & maintenance
- −$1,381
- − Management
- −$1,381
- − HOA
- −$204
- − Depreciation
- −$5,091
- Taxable loss
- −$2,383
- Est. tax savings @ 24.0%
- +$572
- After-tax cash flow
- $1,207/yr
For passive investors: Depreciation is non-cash, so a rental often shows a tax loss while cash-flowing — sheltering income. Rental losses are passive: they offset passive income freely, and up to $25,000/yr can offset ordinary (W-2) income if you actively participate and your MAGI is under $100k (phasing out to $0 by $150k); unused losses carry forward. On sale, claimed depreciation is recaptured at up to 25%, and gains may owe capital-gains tax (a 1031 exchange can defer both). Figures are a year-1 estimate at your 24.0% rate — not tax advice; consult a CPA.
Schools (NCES district)
- District
- Richland 02
- NCES district ID
- 4503390
- Math proficiency
- 35% ▼ -15.00%
- Reading proficiency
- 47% ▼ -5.00%
- Median HH income
- $59,684
- Composite
- 36.2/100
- National rank
- #4730
- State rank
- #29 of 80 in SC
Livability — Dentsville
- Score
- 71/100
- State rank
- #50
- US rank
- #6940
Category grades
Schools grade is shown separately in the Schools card above.
Census & demographics
- Census place
- Dentsville, SC
- County
- Richland County · 389,530 people
- City population
- 52,835
- Metro
- Columbia, SC
- Population (ZIP)
- 53,074
- Household income
- $62,408
- Rent vs Own
- Severe rent burden
- 2857.0
Population outlook (Richland County) Hauer SSP2
- Today (2025)
- 459,667 people
- By 2030
- 487,524 · +6.1%
- By 2040
- 542,035 · +17.9%
- By 2050
- 595,371 · +29.5%
- By 2075
- 732,998 · +59.5%
- By 2100
- 820,415 · +78.5%
Race, ethnicity, and origin ACS 2023
- Neighborhood character
- Diverse neighborhood (Simpson 0.60)
- Race & ethnicity
- Black 57% White 23% Hispanic / Latino 11% Two or more races 6% Asian 4%
- Hispanic origin (detail)
- Mexican 5% Puerto Rican 2%
- Common ancestry
- Slovak 1% Serbian 1% Italian 1%
- Foreign-born
- 10% · Canada, South Korea
- Languages at home
- 86% English-only · Spanish 8% Other Indo-European 2% Korean 1%
Political lean MEDSL · Richland
- 2024 margin
- Solid D (+34.6) · D 66.4% · R 31.8% · Other 1.8%
- 2008→2024 swing
- +5.7pp toward D · 2008: 28.9pp · 2024: 34.6pp
- All cycles
- 2024: D+34.6 2020: D+38.3 2016: D+32.9 2012: D+33.3 2008: D+28.9
Not yet ingested
- Civics
- —
Market trends
- HPI YoY
- ▼ -135.96%
- Current HPI
- 195.3158
- Rent YoY
- ▲ 0.21%
- Metro
- Columbia, SC
- State GDP YoY
- ▲ 4.51%
- F500 in state
- 2
Industry mix (Fortune 500 HQ in SC)
| Industry | F500 HQs | Revenue |
|---|---|---|
| Packaging | 1 | $7B |
|
||
Price history
1 event — show timeline
- 2026-05-01 Listed $185,000 Consolidated MLS
Property tax history
+1.3%/yrLatest (2025): $913 · +3.0% YoY. Source: county tax records.
Cash-flow waterfall
monthlySold comps — $/sqft
last 12 mo · ≤1 miLoading sold comps…