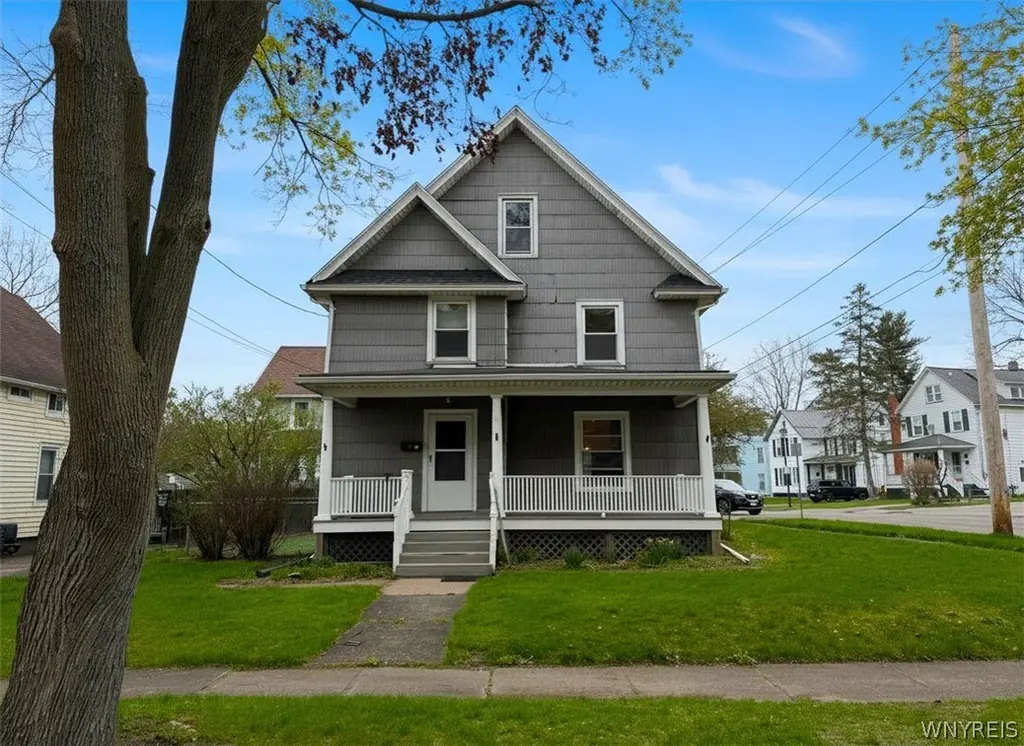
136 Parce Ave · Fairport, NY
Flood risk 1/10 · Minimal
- FEMA flood zone
- X (unshaded)
- Chance of flooding over 30 yrs
- 0.0%
- Est. flood insurance / yr
- $473 – $860
Fire risk 1/10 · Minimal
- Est. fire insurance / yr
- $691 – $1,283
Heat risk 3/10 · Minor
- Hot days now (above 95°F)
- 7 days/yr
- Hot days in 30 yrs
- 17 days/yr
Wind risk 1/10 · Minimal
- Chance of severe wind over 30 yrs
- —
Air-quality risk 2/10 · Minimal
- Unhealthy air days now
- 1 days/yr
- Unhealthy air days in 30 yrs
- 1 days/yr
Risk factors via First Street. Map © Google.
Why this score? — see what drove the C grade
The composite is a weighted blend of 9 inputs, each scored 0–100. Each bar is that input's sub-score; the figure is the points it added to the 100-point composite (weight × sub-score).
- Cash flow +17.1/30.0
- ARV discount +15.0/15.0
- 1% rule +5.9/10.0
- Schools +5.4/10.0
- DSCR +5.3/10.0
- Livability +3.7/5.0
- Condition / age +2.5/5.0
- Rent growth +2.3/5.0
- Appreciation +0.0/10.0
$225,000
🖨 Deal sheet 📄 Offer letter ✓ Due diligence
Listing remarks
Nestled in the heart of the Village of Fairport, this inviting 4-bedroom, 1.5-bath home offers a fantastic opportunity for investors or owner-occupants alike. Enjoy an unbeatable location just a short stroll to the canal, local shops, and popular restaurants, all while living in a charming neighborhood setting. A welcoming covered front porch sets the tone, perfect for relaxing and enjoying the village atmosphere. Inside, the spacious layout features a blend of hardwood and laminate flooring, complemented by beautiful original Craftsman woodwork that adds warmth and character throughout. The large kitchen is ideal for everyday living and entertaining, complete with a convenient butler&rsquo
Key facts
- Covered front porch
- Popular restaurants
- Local shops
Tags
Property features AI
Exterior
- Parking: No garage
- Utilities: Public water connected; Sewer connected
- Home design: 2-story existing residence; Resale condition; City street frontage
- Construction: See remarks for construction materials
- Exterior features: Concrete driveway; Rectangular residential lot (60 x 82)
Interior
- Kitchen: Eat-in kitchen; Appliances negotiable
- Bedrooms: Total rooms: 8; Includes living, family, and laundry rooms
- Flooring: Hardwood; Varies
- Bathrooms: 1 full bathroom; 1 half bathroom; One main-level bathroom
- Heating & cooling: Gas forced-air heating; Has heating
- Interior features: Separate/formal dining room; Eat-in kitchen; Separate/formal living room; Natural woodwork; Full basement
- Laundry & utility: Main-level laundry; Gas water heater
Neighborhood map
What this means for you Summary
Snapshot
- This is a 4-bed/1.5-bath single-family listed at $225k.
Deal economics
- At list price, monthly cash flow is $158 ($2k/yr) — positive.
- The deal already cash-flows at list — no discount required.
- Meets the 1% rule at list price ($2k rent vs $225k).
- Cap rate 7.1% vs local median 3.4% in Fairport — top-decile yield for the area; either an underpriced asset or a hidden risk that comps aren't pricing in. Stress-test before assuming the spread holds.
Location & tenants
- Location reads 74/100 on livability (#301 in NY, #4,847 nationally) — a middle-class / working-renter tenant base. Strengths: housing A+, health & safety A+, schools A; Watch: commute F.
- Fairport Central School District (suburban): math 55% / reading 66% proficiency, ranked #199 of 590 in NY (top 34%) — acceptable for families but not a draw, mixed tenant base, ~2y average lease; only 14% free/reduced lunch — higher-income household profile.
- Market conditions: Rents soft (-0.8%/yr); 186 active listings in the ZIP; 3 comparable units currently listed for rent nearby; rentals leasing fast (median 3d on market — plan ~1-2 weeks tenant-placement turnaround); solid renter incomes; 1,169 units permitted in Monroe County in 2024 (591 in 5+ unit buildings).
Forward outlook
- Local home prices are declining (-3.0%/yr); year-one equity from $2k of loan paydown is wiped out by about $7k of value loss. Plan a longer hold.
- Monroe County population projected to shrink 6% by 2050 — rents likely to lag national; underwrite the cash flow, not the appreciation.
Negotiation context
- Only 14 days on market — expect competitive offers; lowballing is unlikely to land.
- Current owner paid $115k; list at $225k implies a 96% gain — meaningful room to come down on a strong offer.
Risks & watch-outs
- Watch-outs: property tax is 2.7% of price; built in 1910 — expect roof / HVAC / electrical / plumbing capex.
Questions for the listing agent
- Built in 1910 — when were the roof, HVAC, electrical panel, plumbing, and water heater last replaced?
- Property tax is high relative to price — has the assessment been appealed recently, and will the sale trigger a re-assessment?
- Is there a deadline driving the sale (1031 exchange, divorce, estate, relocation)? That informs how much negotiation room exists.
- Schools are A-rated — typically a magnet for longer-tenancy family renters. What's the average tenant stay here, and is there a school-zone premium baked into asking?
- What's the average days-on-market for RENTAL listings here right now (not sales)? A rising rental-DOM trend means longer vacancies and softer asking-rent achievability than the comps imply.
- What's the recent tenant-quality profile in this submarket — average credit score on applications, eviction rate, late-payment / NSF rate, and stable-employment percentage? A property-management company in the area should have these aggregated.
- How much new for-sale + rental construction is in the pipeline within 1–3 miles? Heavy new supply typically softens prices + rents 12–24 months out; constrained supply supports both.
Investment metrics
- 1% rule
- 1.09% ✓
- Cap rate
- 7.14%
- Cash-on-cash
- 3.01%
- DSCR
- 1.13
- GRM
- 7.7
CMA / ARV
- ARV (median comp)
- $312,942
- List price
- $225,000
- Delta
- -28.10%
- Verdict
- UNDERPRICED
- Comps
- 20 within 1.0 mi
Show comp detail 12 sales within ~0.75 mi
| Address | Dist | Beds/Ba | Sqft | Sold | Price | $/sf | Match |
|---|---|---|---|---|---|---|---|
| 18 Deland Park A | 0.18mi | 4/2.0 | 1,548 (-2%) | 3mo | $305,000 | $197 | 84 |
| 60 Parce Ave | 0.14mi | 4/2.0 | 1,624 (+3%) | 13mo | $225,000 | $139 | 75 |
| 30 Elm St | 0.10mi | 3/1.0 (-1) | 1,600 (+2%) | 17mo | $221,000 | $138 | 71 |
| 16 Deland Park A | 0.19mi | 4/1.5 | 1,440 (-8%) | 11mo | $455,000 | $316 | 68 |
| 112 Roselawn Ave | 0.32mi | 3/2.0 (-1) | 1,452 (-8%) | 6mo | $395,000 | $272 | 60 |
| 752 Whitney Rd W | 0.33mi | 3/1.0 (-1) | 1,470 (-6%) | 17mo | $242,000 | $165 | 52 |
| 75 Edendery Cir | 0.28mi | 3/2.5 (-1) | 1,462 (-7%) | 18mo | $285,000 | $195 | 52 |
| 19 Homestead Dr | 0.65mi | 4/2.5 | 1,398 (-11%) | 6mo | $307,500 | $220 | 42 |
| 25 Old Winding Ln | 0.64mi | 3/2.0 (-1) | 1,705 (+8%) | 13mo | $455,000 | $267 | 38 |
| 146 S Main St | 0.72mi | 3/1.0 (-1) | 1,416 (-10%) | 8mo | $299,500 | $212 | 36 |
| 31 Dewey Ave | 0.65mi | 3/1.5 (-1) | 1,344 (-14%) | 7mo | $414,500 | $308 | 35 |
| 28 Wheatstone Cir | 0.72mi | 4/1.5 | 1,804 (+15%) | 12mo | $429,000 | $238 | 32 |
Match score weights: distance 35% · size 25% · config 20% · recency 20%. Top-matched comps best support the ARV.
Projected returns pro-forma
-3.0% appreciation · 0.0% rent growth · sell at horizon
- IRR
- -15.4%
- Equity multiple
- 0.47×
- Total profit
- $-33,385
- Equity at exit
- $33,548
- IRR
- -14.0%
- Equity multiple
- 0.32×
- Total profit
- $-43,133
- Equity at exit
- $19,454
Cash invested: $63,000 (down + closing). Projections, not guarantees.
Landlord ↔ Tenant lean methodology
- Overall (STATE)
- 15 Strongly Tenant-Friendly
- State New York
- 15 Strongly Tenant-Friendly · D+10
- County
- — inherits STATE
- City
- — inherits STATE
ZIP-level market 14450
- Rents YoY
- -0.8%
- Active inventory
- 186
- Price-to-rent
- 7.7×
Monthly cashflow live
- Estimated rent
- $2,450 medium interval (Pro) →
- Mortgage (P&I)
- −$1,180
- Tax from tax record
- −$504 /mo · $6,043/yr
- Insurance
- −$94
- HOA
- −$0
- Vacancy / Maint / Mgmt
- −$515
- Net cashflow
- $158
Break-even live
UW: 25.0% down · 7.5% · 30yr · 1.5% tax · 5.0% vac · 8.0% maint · 8.0% mgmt
Financing live
Cash to close
- Down payment
- $56,250
- Closing costs
- $6,750
- Reserves months
- —
- Total cash needed
- —
Loan-product check · same deal, 3 products live
Conventional
25% down · 7.5% · 30yr
- Down + closing
- —
- Monthly P&I
- —
- Monthly cashflow
- —
- DSCR
- —
- Eligible?
- —
Personal DTI + credit; lowest rate.
DSCR
20% down · 8.5% · 30yr
- Down + closing
- —
- Monthly P&I
- —
- Monthly cashflow
- —
- DSCR
- —
- Eligible?
- —
No personal income docs; deal must DSCR.
Hard money
10% down · 12.0% · 12mo
- Down + closing
- —
- Monthly P&I
- —
- Monthly cashflow
- —
- DSCR
- —
- Eligible?
- —
Short-term bridge; refi at stabilization.
Rent comps 3 comps
| Address | Beds | Baths | Sqft | Rent | $/sqft | DOM | Units | Dist |
|---|---|---|---|---|---|---|---|---|
| 1253 Fairport Rd Fairport, NY | 3.0 | 2.0 | 2194 | $2,500 | $1.14 | 2d | 1 | 0.93mi |
| 131 Broxbourne Dr Fairport, NY | 3.0 | 2.0 | 1110 | $2,700 | $2.43 | 10d | 1 | 1.27mi |
| 370 Jefferson Ave Fairport, NY | 1.0–3.0 | 1.0 | 997 | $1,783 | $1.79 | 2d | 1 | 1.43mi |
Listing history 4 events
-
2026-05-07status Pending 1002-char remark
-
2026-04-23$225,000 Active 1002-char remark
-
2021-05-20soldstatus $115,000
-
1997-03-27soldstatus $75,000
ⓘ Source: listings_history table (triggers on properties + properties_extension) + one-shot
backfill from property_details.listing_events for pre-trigger history.
Tax reassessment forecast NY · Partial reset (capped growth)
- Current annual tax
- $6,043 · $504/mo
- Projected year-2 tax
- $6,043 · $504/mo
- Expected delta
- $0/yr ($0/mo · 0.0%)
ⓘ Screening estimate from a state-policy table — verify with the county assessor before closing.
Climate risk First Street
- Flood 1/10 Low FEMA zone X (unshaded) · 0% chance over 30 yrs
- Wildfire 1/10 Low
- Heat 3/10 Moderate 7 d/yr ≥95°F today · 17 d/yr by 30 yrs out
- Wind 1/10 Low
- Air quality 2/10 Low 1 unhealthy d/yr today · 1 by 30 yrs out
Nearby sold comps map
Loading sold comps map…
Walkable amenities ~0.75 mi
Loading nearby amenities…
Taxation est. · year 1
- Rental income
- $29,400
- − Mortgage interest
- −$12,603
- − Property taxes
- −$6,043
- − Insurance
- −$1,125
- − Repairs & maintenance
- −$2,352
- − Management
- −$2,352
- − Depreciation
- −$6,545
- Taxable loss
- −$1,620
- Est. tax savings @ 24.0%
- +$389
- After-tax cash flow
- $2,288/yr
For passive investors: Depreciation is non-cash, so a rental often shows a tax loss while cash-flowing — sheltering income. Rental losses are passive: they offset passive income freely, and up to $25,000/yr can offset ordinary (W-2) income if you actively participate and your MAGI is under $100k (phasing out to $0 by $150k); unused losses carry forward. On sale, claimed depreciation is recaptured at up to 25%, and gains may owe capital-gains tax (a 1031 exchange can defer both). Figures are a year-1 estimate at your 24.0% rate — not tax advice; consult a CPA.
Schools (NCES district)
- District
- Fairport Central School District
- NCES district ID
- 3610890
- Math proficiency
- 55% ▼ -16.00%
- Reading proficiency
- 66% ▲ 3.00%
- Median HH income
- $74,981
- Composite
- 53.84/100
- National rank
- #1409
- State rank
- #199 of 590 in NY
Livability — Fairport
- Score
- 74/100
- State rank
- #301
- US rank
- #4847
Category grades
Schools grade is shown separately in the Schools card above.
Census & demographics
- Census place
- Fairport, NY
- County
- Monroe County · 674,131 people
- City population
- 42,750
- Metro
- Rochester, NY
- Population (ZIP)
- 42,750
- Household income
- $109,466
- Rent vs Own
- Severe rent burden
- 843.0
Population outlook (Monroe County) Hauer SSP2
- Today (2025)
- 759,460 people
- By 2030
- 757,154 · -0.3%
- By 2040
- 740,644 · -2.5%
- By 2050
- 714,443 · -5.9%
- By 2075
- 645,883 · -15.0%
- By 2100
- 547,084 · -28.0%
Race, ethnicity, and origin ACS 2023
- Neighborhood character
- Predominantly White (89%)
- Race & ethnicity
- White 89% Two or more races 5% Hispanic / Latino 3% Asian 2% Black 2%
- Common ancestry
- Romanian 6% Lithuanian 2% Iranian 2%
- Foreign-born
- 6% · Canada, China, South Korea
- Languages at home
- 94% English-only · Other Indo-European 1% Spanish 1% Other Asian/Pacific 1%
Political lean MEDSL · Monroe
- 2024 margin
- D (+19.1) · D 59.5% · R 40.5%
- 2008→2024 swing
- +1.4pp toward D · 2008: 17.7pp · 2024: 19.1pp
- All cycles
- 2024: D+19.1 2020: D+21.0 2016: D+14.1 2012: D+17.4 2008: D+17.7
Not yet ingested
- Civics
- —
Market trends
- HPI YoY
- ▼ -189.56%
- Current HPI
- 270.7329
- Rent YoY
- ▼ -0.84%
- Metro
- Rochester, NY
- State GDP YoY
- ▲ 2.60%
- F500 in state
- 92
Industry mix (Fortune 500 HQ in NY)
| Industry | F500 HQs | Revenue |
|---|---|---|
| Financial Services | 10 | $950B |
|
||
| Consumer Goods | 9 | $162B |
|
||
| Insurance | 4 | $225B |
|
||
| Telecommunications | 2 | $144B |
|
||
| Pharmaceuticals | 2 | $112B |
|
||
| Media / Entertainment | 2 | $69B |
|
||
Price history
+200.0% since first listed4 events — show timeline
- 2026-05-07 Pending — WNYREIS
- 2026-04-23 Listed $225,000 WNYREIS
- 2021-05-20 Sold (Public Records) $115,000 Public Records
- 1997-03-27 Sold (Public Records) $75,000 Public Records
Property tax history
+3.1%/yrLatest (2025): $6,043 · +3.6% YoY. Source: county tax records.
Cash-flow waterfall
monthlySold comps — $/sqft
last 12 mo · ≤1 miLoading sold comps…