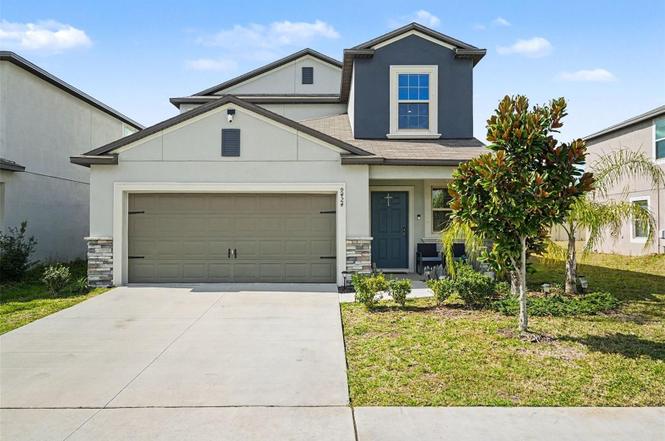
9424 Lemon Drop Loop · Apollo Beach, FL
Flood risk 1/10 · Minimal
- FEMA flood zone
- X (unshaded)
- Chance of flooding over 30 yrs
- 0.0%
- Est. flood insurance / yr
- $507 – $1,088
Fire risk 5/10 · Moderate
- Est. fire insurance / yr
- $947 – $1,759
Heat risk 10/10 · Severe
- Hot days now (above 108°F)
- 7 days/yr
- Hot days in 30 yrs
- 27 days/yr
Wind risk 10/10 · Severe
- Chance of severe wind over 30 yrs
- 99.0%
Air-quality risk 3/10 · Minor
- Unhealthy air days now
- 3 days/yr
- Unhealthy air days in 30 yrs
- 4 days/yr
Risk factors via First Street. Map © Google.
Why this score? — see what drove the D- grade
The composite is a weighted blend of 9 inputs, each scored 0–100. Each bar is that input's sub-score; the figure is the points it added to the 100-point composite (weight × sub-score).
- Cash flow +8.9/30.0
- ARV discount +7.5/15.0
- Schools +4.2/10.0
- Livability +3.6/5.0
- 1% rule +3.4/10.0
- Appreciation +3.4/10.0
- Rent growth +3.2/5.0
- DSCR +2.5/10.0
- Condition / age +2.5/5.0
$357,000
🖨 Deal sheet (PDF) 📄 Offer letter ✓ Due diligence
Listing remarks
Under contract-accepting backup offers. Spacious 5-bedroom home featuring a functional open-concept floorplan ideal for everyday living and entertaining. The modern kitchen offers ample white cabinetry, granite countertops, stainless-steel appliances, and a large island with breakfast bar seating so your home chef can keep loved ones close. The main-level primary suite includes a custom walk-in closet and an en-suite bathroom with dual sinks and a beautifully remodeled shower. Upstairs, a versatile loft provides additional living space perfect for a media room, home office, or play area. Ceiling fans are installed in all bedrooms and living areas for added comfort year-round. Enjoy communit
Key facts
- Large island
- Modern kitchen
- Granite countertops
Tags
Neighborhood map
What this means for you Summary
Snapshot
- This is a 5-bed/3.0-bath single-family listed at $357k.
Deal economics
- At list price, monthly cash flow is $-286 ($-3k/yr) — negative.
- To cash-flow at today's rent, offer at most $306k (14.1% below list).
- To meet the 1% rule (rent ≥ 1% of price), the offer needs to be $301k (15.6% below list).
- Recommended offer: $301k (15.6% below list) — sets the bar for 1% rule.
Location & tenants
- Location reads 72/100 on livability (#333 in FL) — a middle-class / working-renter tenant base. Strengths: crime A+, employment A+, housing A+; Watch: cost of living C-, amenities F, health & safety F.
- Hillsborough (suburban): math 47% / reading 50% proficiency, ranked #41 of 73 in FL (top 56%) — families likely to look elsewhere, expect single-tenant / working-renter base with shorter leases.
- Zoned schools: Belmont Elementary School (math 42% / reading 45%, grade F, #1,345 of 2,144 statewide, top 64%, 987 students, 44% FRL); East Bay High School (math 24% / reading 35%, grade F, #447 of 667 statewide, top 68%, 1,995 students, 51% FRL) — zoned schools at 47% FRL track the district average.
- Zoned-school proficiency averages 36% at this address vs 48% district-wide (-12 pts) — the specific schools serving this property underperform the Hillsborough average; the district grade overstates school quality for this exact location.
- Market conditions: Rents rising (+2.6%/yr); 605 active listings in the ZIP; 16 comparable units currently listed for rent nearby; rentals at typical pace (median 20d on market — plan ~3-4 weeks tenant-placement turnaround); 9,053 units permitted in Hillsborough County in 2024 (4,555 in 5+ unit buildings).
- At $3,012/mo this rent would consume 50% of the median local household income ($73k/yr) (locally 1382% of renters already pay >50% of income on rent) — very limited rent-growth headroom before tenants either downsize or default.
Forward outlook
- Local home prices are declining (-3.0%/yr); year-one equity from $2k of loan paydown is wiped out by about $11k of value loss. Plan a longer hold.
- Hillsborough County population projected at +37% by 2050 — long-run rental-demand tailwind backs the buy-and-hold thesis.
Negotiation context
- It's been on market 32 days — a 3% lower offer ($346k) is reasonable based on typical stale-listing flexibility.
Risks & watch-outs
- Climate carrying-cost: severe wind risk, 99% chance of damaging wind over 30y; moderate wildfire risk; extreme-heat days projected 7→27/yr by 2055 (HVAC capex compounding) — expect insurance premiums to compound above CPI over the hold.
Questions for the listing agent
- What do current leases actually rent for vs. the listed asking? Can we see a recent rent roll and the last 12 months of T-12 income?
- It's been on market 32 days. Have you received any prior offers? Is the seller open to a 16% concession, seller financing, or rate buy-down credit?
- What does the HOA fee cover, when was the last increase, and are there any pending special assessments or reserve-fund shortfalls?
- Is there a deadline driving the sale (1031 exchange, divorce, estate, relocation)? That informs how much negotiation room exists.
- Schools are B-rated — typically a magnet for longer-tenancy family renters. What's the average tenant stay here, and is there a school-zone premium baked into asking?
- The area grade is low — what's the realistic commute time and amenity access for the typical tenant pool here? Any planned neighborhood developments (good or bad) we should know about?
- What's the average days-on-market for RENTAL listings here right now (not sales)? A rising rental-DOM trend means longer vacancies and softer asking-rent achievability than the comps imply.
- What's the recent tenant-quality profile in this submarket — average credit score on applications, eviction rate, late-payment / NSF rate, and stable-employment percentage? A property-management company in the area should have these aggregated.
- How much new for-sale + rental construction is in the pipeline within 1–3 miles? Heavy new supply typically softens prices + rents 12–24 months out; constrained supply supports both.
Investment metrics
- 1% rule
- 0.84% ✗
- Cap rate
- 5.33%
- Cash-on-cash
- -3.43%
- DSCR
- 0.85
- GRM
- 9.9
CMA / ARV
No comps found within radius.
Projected returns pro-forma
-3.0% appreciation · 2.65% rent growth · sell at horizon
- IRR
- -22.4%
- Equity multiple
- 0.23×
- Total profit
- $-76,951
- Equity at exit
- $53,230
- IRR
- -17.4%
- Equity multiple
- 0.06×
- Total profit
- $-94,087
- Equity at exit
- $30,867
Cash invested: $99,960 (down + closing). Projections, not guarantees.
Landlord ↔ Tenant lean methodology
- Overall (STATE)
- 87 Strongly Landlord-Friendly
- State Florida
- 87 Strongly Landlord-Friendly · R+3
- County
- — inherits STATE
- City
- — inherits STATE
ZIP-level market 33573
- Home prices YoY
- -1.2%
- Rents YoY
- 2.6%
- Active inventory
- 605
- Price-to-rent
- 9.9×
Monthly cashflow live
- Estimated rent
- $3,012 high interval (Pro) →
- Mortgage (P&I)
- −$1,872
- Tax from tax record
- −$631 /mo · $7,575/yr
- Insurance
- −$149
- HOA
- −$13
- Vacancy / Maint / Mgmt
- −$632
- Net cashflow
- $-286
Break-even live
Sensitivity live
| Price | -10% $-84 | -5% $-185 | +0% $-286 | +5% $-387 | +10% $-488 |
|---|---|---|---|---|---|
| Rent | -10% $-524 | -5% $-405 | +0% $-286 | +5% $-167 | +10% $-48 |
| Rate | -1.0pp $-106 | -0.5pp $-195 | base $-286 | +0.5pp $-378 | +1.0pp $-473 |
UW: 25.0% down · 7.5% · 30yr · 1.5% tax · 5.0% vac · 8.0% maint · 8.0% mgmt
Financing live
Cash to close
- Down payment
- $89,250
- Closing costs
- $10,710
- Reserves months
- —
- Total cash needed
- —
Loan-product check · same deal, 3 products live
Conventional
25% down · 7.5% · 30yr
- Down + closing
- —
- Monthly P&I
- —
- Monthly cashflow
- —
- DSCR
- —
- Eligible?
- —
Personal DTI + credit; lowest rate.
DSCR
20% down · 8.5% · 30yr
- Down + closing
- —
- Monthly P&I
- —
- Monthly cashflow
- —
- DSCR
- —
- Eligible?
- —
No personal income docs; deal must DSCR.
Hard money
10% down · 12.0% · 12mo
- Down + closing
- —
- Monthly P&I
- —
- Monthly cashflow
- —
- DSCR
- —
- Eligible?
- —
Short-term bridge; refi at stabilization.
Rent comps 16 comps
| Address | Beds | Baths | Sqft | Rent | $/sqft | DOM | Units | Dist |
|---|---|---|---|---|---|---|---|---|
| 9648 Sage Creek Dr Sun City Center, FL | 6.0 | 3.0 | 3153 | $3,000 | $0.95 | 20d | 1 | 0.58mi |
| 10018 Sage Creek Dr Sun City Center, FL | 4.0 | 2.0 | 2598 | $2,611 | $1.01 | 26d | 1 | 0.59mi |
| 9924 Victory Gallop Loop Ruskin, FL | 4.0 | 2.5 | 2535 | $2,656 | $1.05 | 24d | 1 | 0.65mi |
| 10040 Blackstone Creek CT Riverview, FL | 3.0–4.0 | 2.5 | 1687 | $2,995 | $1.78 | 7d | 20 | 0.74mi |
| 10114 Point Given Ct Sun City Center, FL | 4.0 | 2.5 | 2162 | $2,327 | $1.08 | 26d | 1 | 0.86mi |
| 6610 Brighton Park Dr Apollo Beach, FL | 4.0 | 2.0 | 2567 | $3,250 | $1.27 | 7d | 1 | 0.94mi |
| 5448 Silver Sun Dr Apollo Beach, FL | 4.0 | 2.0 | 1992 | $4,000 | $2.01 | 26d | 1 | 0.96mi |
| 10125 Count Fleet Dr Ruskin, FL | 4.0 | 3.0 | 2529 | $2,850 | $1.13 | 14d | 1 | 0.99mi |
| 6328 Lantern View Pl Apollo Beach, FL | 4.0 | 3.5 | 2184 | $2,600 | $1.19 | 19d | 1 | 1.00mi |
| 6214 Sea Amber Ln Apollo Beach, FL | 4.0 | 3.0 | 2273 | $3,200 | $1.41 | 13d | 1 | 1.00mi |
| 10279 Newminster Loop Ruskin, FL | 4.0 | 2.5 | 2576 | $2,395 | $0.93 | 26d | 1 | 1.04mi |
| 7006 Monarch Park Dr Apollo Beach, FL | 4.0 | 2.0 | 1868 | $2,425 | $1.30 | 22d | 1 | 1.15mi |
| 10220 Newminster Loop Ruskin, FL | 4.0 | 2.5 | 2483 | $2,315 | $0.93 | 17d | 1 | 1.18mi |
| 4529 Eternal Prince Dr Sun City Center, FL | 4.0 | 2.5 | 1914 | $2,450 | $1.28 | 22d | 1 | 1.34mi |
| 5612 Limelight Dr Apollo Beach, FL | 5.0 | 4.0 | 3245 | $4,000 | $1.23 | 13d | 1 | 1.47mi |
| 6725 Guilford Crest Dr Apollo Beach, FL | 4.0 | 2.0 | 2646 | $3,100 | $1.17 | 7d | 1 | 1.48mi |
HOA detail
- Monthly dues
- $13 · $156/yr
Listing history 6 events
-
2026-04-10status Pending
-
2026-04-10price $357,000
-
2026-04-07price $349,900
-
2026-03-26price $356,900
-
2026-03-17price $358,900
-
2026-03-09$365,000 Active
ⓘ Source: listings_history table (triggers on properties + properties_extension) + one-shot
backfill from property_details.listing_events for pre-trigger history.
Tax reassessment forecast FL · Resets to sale price
- Current annual tax
- $7,575 · $631/mo
- Projected year-2 tax
- $7,575 · $631/mo
- Expected delta
- $0/yr ($0/mo · 0.0%)
ⓘ Screening estimate from a state-policy table — verify with the county assessor before closing.
Climate risk First Street
- Flood 1/10 Low FEMA zone X (unshaded) · 0% chance over 30 yrs
- Wildfire 5/10 Major
- Heat 10/10 Extreme 7 d/yr ≥108°F today · 27 d/yr by 30 yrs out
- Wind 10/10 Extreme 99% chance of damaging wind over 30 yrs
- Air quality 3/10 Moderate 3 unhealthy d/yr today · 4 by 30 yrs out
Nearby sold comps map
Loading sold comps map…
Walkable amenities ~0.75 mi
Loading nearby amenities…
Taxation est. · year 1
- Rental income
- $36,140
- − Mortgage interest
- −$19,998
- − Property taxes
- −$7,575
- − Insurance
- −$1,785
- − Repairs & maintenance
- −$2,891
- − Management
- −$2,891
- − HOA
- −$156
- − Depreciation
- −$10,385
- Taxable loss
- −$9,542
- Est. tax savings @ 24.0%
- +$2,290
- After-tax cash flow
- $-1,141/yr
For passive investors: Depreciation is non-cash, so a rental often shows a tax loss while cash-flowing — sheltering income. Rental losses are passive: they offset passive income freely, and up to $25,000/yr can offset ordinary (W-2) income if you actively participate and your MAGI is under $100k (phasing out to $0 by $150k); unused losses carry forward. On sale, claimed depreciation is recaptured at up to 25%, and gains may owe capital-gains tax (a 1031 exchange can defer both). Figures are a year-1 estimate at your 24.0% rate — not tax advice; consult a CPA.
Schools (NCES district)
- District
- Hillsborough
- NCES district ID
- 1200870
- Math proficiency
- 47% ▼ -8.00%
- Reading proficiency
- 50% ▼ -4.00%
- Median HH income
- $50,622
- Composite
- 41.6/100
- National rank
- #3435
- State rank
- #41 of 73 in FL
Livability — Apollo Beach
- Score
- 72/100
- State rank
- #333
- US rank
- #5784
Category grades
Schools grade is shown separately in the Schools card above.
Census & demographics
- Census place
- Apollo Beach, FL
- County
- Hillsborough County · 1,540,968 people
- City population
- 26,495
- Metro
- Tampa-St. Petersburg-Clearwater, FL
- Population (ZIP)
- 35,362
- Household income
- $72,834
- Rent vs Own
- Severe rent burden
- 1382.0
Population outlook (Hillsborough County) Hauer SSP2
- Today (2025)
- 1,607,022 people
- By 2030
- 1,733,968 · +7.9%
- By 2040
- 1,979,565 · +23.2%
- By 2050
- 2,203,427 · +37.1%
- By 2075
- 2,667,893 · +66.0%
- By 2100
- 2,891,558 · +79.9%
Race, ethnicity, and origin ACS 2023
- Neighborhood character
- Predominantly White (73%)
- Race & ethnicity
- White 73% Hispanic / Latino 13% Two or more races 11% Black 10% Asian 1%
- Hispanic origin (detail)
- Mexican 1% Puerto Rican 6% Cuban 2%
- Common ancestry
- Romanian 3% Lithuanian 3% Slovak 2%
- Foreign-born
- 8% · Canada, Vietnam
- Languages at home
- 86% English-only · Spanish 10% French/Haitian/Cajun 1% German/W. Germanic 1%
Political lean MEDSL · Hillsborough
- 2024 margin
- Toss-up / Even · D 47.8% · R 50.9% · Other 1.3%
- 2008→2024 swing
- -10.2pp toward R · 2008: 7.1pp · 2024: -3.1pp
- All cycles
- 2024: R+3.1 2020: D+6.9 2016: D+6.8 2012: D+6.7 2008: D+7.1
Not yet ingested
- Civics
- —
Market trends
- HPI YoY
- ▼ -3.27%
- Current HPI
- 272.9767
- Rent YoY
- ▲ 2.65%
- Metro
- Tampa-St. Petersburg-Clearwater, FL
- State GDP YoY
- ▲ 3.28%
- F500 in state
- 36
Industry mix (Fortune 500 HQ in FL)
| Industry | F500 HQs | Revenue |
|---|---|---|
| Industrial Technology | 2 | $29B |
|
||
| Insurance | 2 | $17B |
|
||
| Retail | 1 | $60B |
|
||
| Technology Distribution | 1 | $58B |
|
||
| Homebuilding | 1 | $35B |
|
||
| Technology Manufacturing | 1 | $35B |
|
||
Price history
-2.2% since first listed6 events — show timeline
- 2026-04-10 Pending — Stellar MLS as Distributed by MLS Grid
- 2026-04-10 Price Changed $357,000 Stellar MLS as Distributed by MLS Grid
- 2026-04-07 Price Changed $349,900 Stellar MLS as Distributed by MLS Grid
- 2026-03-26 Price Changed $356,900 Stellar MLS as Distributed by MLS Grid
- 2026-03-17 Price Changed $358,900 Stellar MLS as Distributed by MLS Grid
- 2026-03-09 Listed $365,000 Stellar MLS as Distributed by MLS Grid
Property tax history
-8.5%/yrLatest (2025): $7,575 · +5.1% YoY. Source: county tax records.
Cash-flow waterfall
monthlySold comps — $/sqft
last 12 mo · ≤1 miLoading sold comps…