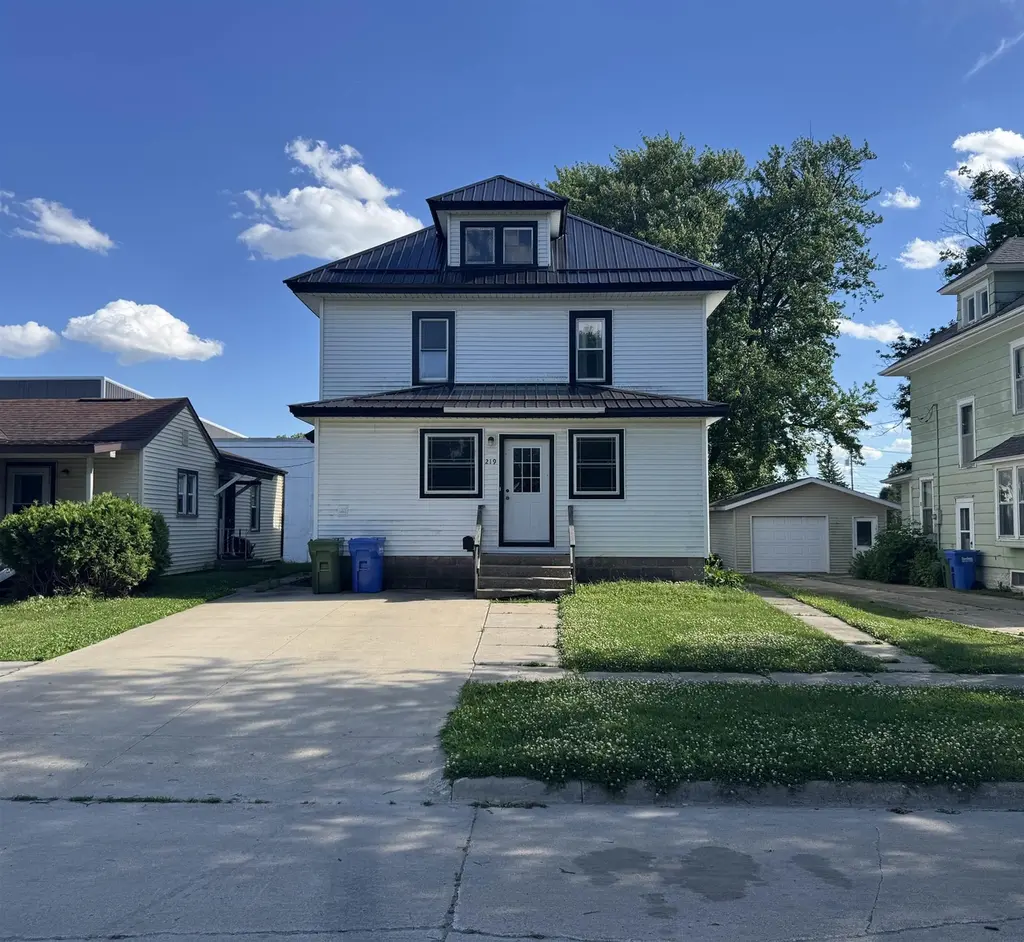
219 W 2nd Ave · Cresco, IA
Flood risk 1/10 · Minimal
- FEMA flood zone
- X (unshaded)
- Chance of flooding over 30 yrs
- 0.0%
- Est. flood insurance / yr
- $473 – $860
Fire risk 4/10 · Minor
- Est. fire insurance / yr
- $902 – $1,676
Heat risk 2/10 · Minimal
- Hot days now (above 98°F)
- 7 days/yr
- Hot days in 30 yrs
- 15 days/yr
Wind risk 2/10 · Minimal
- Chance of severe wind over 30 yrs
- —
Air-quality risk 1/10 · Minimal
- Unhealthy air days now
- 0 days/yr
- Unhealthy air days in 30 yrs
- 0 days/yr
Risk factors via First Street. Map © Google.
Why this score? — see what drove the C grade
The composite is a weighted blend of 9 inputs, each scored 0–100. Each bar is that input's sub-score; the figure is the points it added to the 100-point composite (weight × sub-score).
- Cash flow +17.1/30.0
- ARV discount +15.0/15.0
- Schools +5.6/10.0
- DSCR +5.3/10.0
- 1% rule +4.4/10.0
- Livability +4.2/5.0
- Rent growth +2.5/5.0
- Condition / age +2.5/5.0
- Appreciation +0.0/10.0
$129,900
🖨 Deal sheet 📄 Offer letter ✓ Due diligence
Listing remarks
If you are looking for a first time home, wanting to run a business out of your home, or adding another investment property to your portfolio…. You don’t want to miss this! Nestled on the edge of the business district in Cresco, is this 2 story home. Kick your shoes off in the inviting front porch and come inside. The main floor features kitchen, ¾ bath, living room, dining room and one bedroom. Upstairs there are 3 bedrooms and a full bathroom. On the back of the home is a deck and a back yard with storage shed to enjoy. The home has had many updates over the years and is ready for its new owner.
Key facts
- Back yard
- Many updates
- Front porch
Tags
Property features AI
Exterior
- Parking: No parking
- Utilities: Public water; Public sewer
- Home design: Single-family residence; 2 stories
- Construction: Vinyl siding; Metal roof
- Exterior features: Concrete road surface
Interior
- Bathrooms: 1 full bathroom; 1 three-quarter bathroom
- Heating & cooling: Central air conditioning; Forced air heating (natural gas)
- Interior features: No fireplace; Unfinished basement with block and concrete construction and interior entry
Neighborhood map
What this means for you Summary
Snapshot
- This is a 3-bed/1.5-bath single-family listed at $130k.
Deal economics
- At list price, monthly cash flow is $91 ($1k/yr) — positive.
- The deal already cash-flows at list — no discount required.
- To meet the 1% rule (rent ≥ 1% of price), the offer needs to be $122k (5.8% below list).
- Recommended offer: $122k (5.8% below list) — sets the bar for 1% rule.
Location & tenants
- Location reads 83/100 on livability (#30 in IA, #877 nationally) — a professional / high-income tenant draw. Strengths: crime A+, cost of living A+, housing A+; Watch: amenities D-, commute F.
- Howard-Winneshiek Community School District (town): math 62% / reading 70% proficiency, ranked #189 of 289 in IA (top 65%) — acceptable for families but not a draw, mixed tenant base, ~2y average lease.
- Zoned schools: Cresco Early Childhood Development Center (56 students, 46% FRL).
- Market conditions: 26 active listings in the ZIP; 8 units permitted in Howard County in 2024 (0 in 5+ unit buildings).
Forward outlook
- Local home prices are declining (-3.0%/yr); year-one equity from $898 of loan paydown is wiped out by about $4k of value loss. Plan a longer hold.
- Howard County population projected at -18% by 2050 — secular population decline; favor cash flow + early exit over multi-decade hold.
Negotiation context
- Only 5 days on market — expect competitive offers; lowballing is unlikely to land.
Risks & watch-outs
- Watch-outs: built in 1915 — expect roof / HVAC / electrical / plumbing capex.
Questions for the listing agent
- Built in 1915 — when were the roof, HVAC, electrical panel, plumbing, and water heater last replaced?
- Is there a deadline driving the sale (1031 exchange, divorce, estate, relocation)? That informs how much negotiation room exists.
- Schools are B-rated — typically a magnet for longer-tenancy family renters. What's the average tenant stay here, and is there a school-zone premium baked into asking?
- What's the average days-on-market for RENTAL listings here right now (not sales)? A rising rental-DOM trend means longer vacancies and softer asking-rent achievability than the comps imply.
- What's the recent tenant-quality profile in this submarket — average credit score on applications, eviction rate, late-payment / NSF rate, and stable-employment percentage? A property-management company in the area should have these aggregated.
- How much new for-sale + rental construction is in the pipeline within 1–3 miles? Heavy new supply typically softens prices + rents 12–24 months out; constrained supply supports both.
Investment metrics
- 1% rule
- 0.94% ✗
- Cap rate
- 7.13%
- Cash-on-cash
- 3.00%
- DSCR
- 1.13
- GRM
- 8.8
CMA / ARV
- ARV (on-the-fly)
- $191,520
- Comps found
- 12
Show comp detail 12 sales within ~0.75 mi
| Address | Dist | Beds/Ba | Sqft | Sold | Price | $/sf | Match |
|---|---|---|---|---|---|---|---|
| 219 E 3rd Ave | 0.29mi | 3/2.0 | 1,640 (-2%) | 10mo | $140,000 | $85 | 72 |
| 226 W 4th Ave | 0.21mi | 4/1.5 (+1) | 1,528 (-9%) | 3mo | $73,106 | $48 | 68 |
| 309 Vernon Rd | 0.29mi | 3/3.0 | 1,553 (-8%) | 6mo | $127,000 | $82 | 62 |
| 626 3rd St E | 0.51mi | 3/1.0 | 1,560 (-7%) | 1mo | $136,000 | $87 | 62 |
| 304 E 6th St. St | 0.53mi | 4/1.5 (+1) | 1,677 (-0%) | 12mo | $180,000 | $107 | 60 |
| 505 7th Ave East Ave | 0.57mi | 3/1.5 | 1,723 (+3%) | 13mo | $197,000 | $114 | 58 |
| 723 2nd Street West | 0.52mi | 4/1.5 (+1) | 1,841 (+10%) | 2mo | $247,000 | $134 | 53 |
| 716 E 6th Ave Ave | 0.72mi | 2/2.0 (-1) | 1,635 (-3%) | 4mo | $210,000 | $128 | 51 |
| 616 E 4th Ave Ave | 0.59mi | 4/2.0 (+1) | 1,728 (+3%) | 21mo | $202,000 | $117 | 44 |
| 611 SW 3rd St | 0.50mi | 4/2.0 (+1) | 1,800 (+7%) | 19mo | $158,000 | $88 | 42 |
| 513 2nd St SW Unit Wayne Smith | 0.45mi | 4/3.0 (+1) | 1,484 (-12%) | 9mo | $184,900 | $125 | 41 |
| 630 5th Ave Ave E | 0.64mi | 2/3.0 (-1) | 1,456 (-13%) | 22mo | $315,000 | $216 | 19 |
Match score weights: distance 35% · size 25% · config 20% · recency 20%. Top-matched comps best support the ARV.
Projected returns pro-forma
-3.0% appreciation · 3.0% rent growth · sell at horizon
- IRR
- -11.6%
- Equity multiple
- 0.58×
- Total profit
- $-15,247
- Equity at exit
- $19,369
- IRR
- -2.4%
- Equity multiple
- 0.84×
- Total profit
- $-5,793
- Equity at exit
- $11,231
Cash invested: $36,372 (down + closing). Projections, not guarantees.
Landlord ↔ Tenant lean methodology
- Overall (STATE)
- 83 Strongly Landlord-Friendly
- State Iowa
- 83 Strongly Landlord-Friendly · R+6
- County
- — inherits STATE
- City
- — inherits STATE
ZIP-level market 52136
- Home prices YoY
- -9.4%
- Active inventory
- 26
- Price-to-rent
- 8.8×
Monthly cashflow live
- Estimated rent
- $1,223 medium interval (Pro) →
- Mortgage (P&I)
- −$681
- Tax from tax record
- −$140 /mo · $1,680/yr
- Insurance
- −$54
- HOA
- −$0
- Vacancy / Maint / Mgmt
- −$257
- Net cashflow
- $91
Break-even live
UW: 25.0% down · 7.5% · 30yr · 1.5% tax · 5.0% vac · 8.0% maint · 8.0% mgmt
Financing live
Cash to close
- Down payment
- $32,475
- Closing costs
- $3,897
- Reserves months
- —
- Total cash needed
- —
Loan-product check · same deal, 3 products live
Conventional
25% down · 7.5% · 30yr
- Down + closing
- —
- Monthly P&I
- —
- Monthly cashflow
- —
- DSCR
- —
- Eligible?
- —
Personal DTI + credit; lowest rate.
DSCR
20% down · 8.5% · 30yr
- Down + closing
- —
- Monthly P&I
- —
- Monthly cashflow
- —
- DSCR
- —
- Eligible?
- —
No personal income docs; deal must DSCR.
Hard money
10% down · 12.0% · 12mo
- Down + closing
- —
- Monthly P&I
- —
- Monthly cashflow
- —
- DSCR
- —
- Eligible?
- —
Short-term bridge; refi at stabilization.
Listing history 6 events
-
2026-06-18days on market $129,900 Active 5 DOM
-
2026-06-17days on market $129,900 Active 4 DOM
-
2026-06-16days on market $129,900 Active 3 DOM
-
2026-06-15days on market $129,900 Active 2 DOM
-
2026-06-14remarks 604-char remark
-
2026-06-14$129,900 Active 1 DOM
ⓘ Source: listings_history table (triggers on properties + properties_extension) + one-shot
backfill from property_details.listing_events for pre-trigger history.
Tax reassessment forecast IA · Partial reset (capped growth)
- Current annual tax
- $1,680 · $140/mo
- Projected year-2 tax
- $1,860 · $155/mo
- Expected delta
- +$180/yr (+$15/mo · 10.7%)
ⓘ Screening estimate from a state-policy table — verify with the county assessor before closing.
Climate risk First Street
- Flood 1/10 Low FEMA zone X (unshaded) · 0% chance over 30 yrs
- Wildfire 4/10 Moderate
- Heat 2/10 Low 7 d/yr ≥98°F today · 15 d/yr by 30 yrs out
- Wind 2/10 Low
- Air quality 1/10 Low 0 unhealthy d/yr today · 0 by 30 yrs out
Nearby sold comps map
Loading sold comps map…
Walkable amenities ~0.75 mi
Loading nearby amenities…
Taxation est. · year 1
- Rental income
- $14,679
- − Mortgage interest
- −$7,276
- − Property taxes
- −$1,680
- − Insurance
- −$650
- − Repairs & maintenance
- −$1,174
- − Management
- −$1,174
- − Depreciation
- −$3,779
- Taxable loss
- −$1,055
- Est. tax savings @ 24.0%
- +$253
- After-tax cash flow
- $1,345/yr
For passive investors: Depreciation is non-cash, so a rental often shows a tax loss while cash-flowing — sheltering income. Rental losses are passive: they offset passive income freely, and up to $25,000/yr can offset ordinary (W-2) income if you actively participate and your MAGI is under $100k (phasing out to $0 by $150k); unused losses carry forward. On sale, claimed depreciation is recaptured at up to 25%, and gains may owe capital-gains tax (a 1031 exchange can defer both). Figures are a year-1 estimate at your 24.0% rate — not tax advice; consult a CPA.
Schools (NCES district)
- District
- Howard-Winneshiek Community School District
- NCES district ID
- 1914280
- Math proficiency
- 62% ▼ -11.00%
- Reading proficiency
- 70% ▲ 2.00%
- Median HH income
- $46,388
- Composite
- 55.68/100
- National rank
- #1223
- State rank
- #189 of 289 in IA
Livability — Cresco
- Score
- 83/100
- State rank
- #30
- US rank
- #877
Category grades
Schools grade is shown separately in the Schools card above.
Census & demographics
- Census place
- Cresco, IA
- City population
- 5,763
- Population (ZIP)
- 5,763
Population outlook (Howard County) Hauer SSP2
- Today (2025)
- 8,964 people
- By 2030
- 8,668 · -3.3%
- By 2040
- 8,056 · -10.1%
- By 2050
- 7,388 · -17.6%
- By 2075
- 6,121 · -31.7%
- By 2100
- 4,792 · -46.5%
Race, ethnicity, and origin ACS 2023
- Neighborhood character
- Predominantly White (94%)
- Race & ethnicity
- White 94% Hispanic / Latino 3% Two or more races 3%
- Common ancestry
- Portuguese 17% Romanian 3% Lithuanian 2%
- Foreign-born
- 0%
- Languages at home
- 95% English-only · German/W. Germanic 3% Spanish 2%
Political lean MEDSL · Howard
- 2024 margin
- Solid R (+31.8) · D 33.5% · R 65.3% · Other 1.3%
- 2008→2024 swing
- -57.6pp toward R · 2008: 25.8pp · 2024: -31.8pp
- All cycles
- 2024: R+31.8 2020: R+27.3 2016: R+20.8 2012: D+21.1 2008: D+25.8
Not yet ingested
- Civics
- —
Market trends
- HPI YoY
- ▼ -22.56%
- Current HPI
- 217.8492
- Rent YoY
- —
- Metro
- —
- State GDP YoY
- ▲ 2.48%
- F500 in state
- 4
Industry mix (Fortune 500 HQ in IA)
| Industry | F500 HQs | Revenue |
|---|---|---|
| Financial Services | 1 | $16B |
|
||
| Retail / Convenience | 1 | $15B |
|
||
Price history
1 event — show timeline
- 2026-06-12 Listed $129,900 NEIRBR as distributed by MLS GRID
Property tax history
+4.3%/yrLatest (2025): $1,680 · +1.1% YoY. Source: county tax records.
Cash-flow waterfall
monthlySold comps — $/sqft
last 12 mo · ≤1 miLoading sold comps…