23326 Spring Genesis Ln · Houston, TX
Flood risk 1/10 · Minimal
- FEMA flood zone
- X (unshaded)
- Chance of flooding over 30 yrs
- 0.0%
- Est. flood insurance / yr
- $507 – $1,088
Fire risk 4/10 · Minor
- Est. fire insurance / yr
- $1,222 – $2,270
Heat risk 9/10 · Severe
- Hot days now (above 110°F)
- 7 days/yr
- Hot days in 30 yrs
- 23 days/yr
Wind risk 9/10 · Severe
- Chance of severe wind over 30 yrs
- 99.0%
Air-quality risk 2/10 · Minimal
- Unhealthy air days now
- 1 days/yr
- Unhealthy air days in 30 yrs
- 1 days/yr
Risk factors via First Street. Map © Google.
Why this score? — see what drove the D- grade
The composite is a weighted blend of 9 inputs, each scored 0–100. Each bar is that input's sub-score; the figure is the points it added to the 100-point composite (weight × sub-score).
- ARV discount +12.7/15.0
- Cash flow +6.4/30.0
- Schools +5.7/10.0
- 1% rule +4.4/10.0
- Condition / age +4.0/5.0
- Livability +3.7/5.0
- Rent growth +2.3/5.0
- DSCR +0.7/10.0
- Appreciation +0.0/10.0
$300,000
🖨 Deal sheet 📄 Offer letter ✓ Due diligence
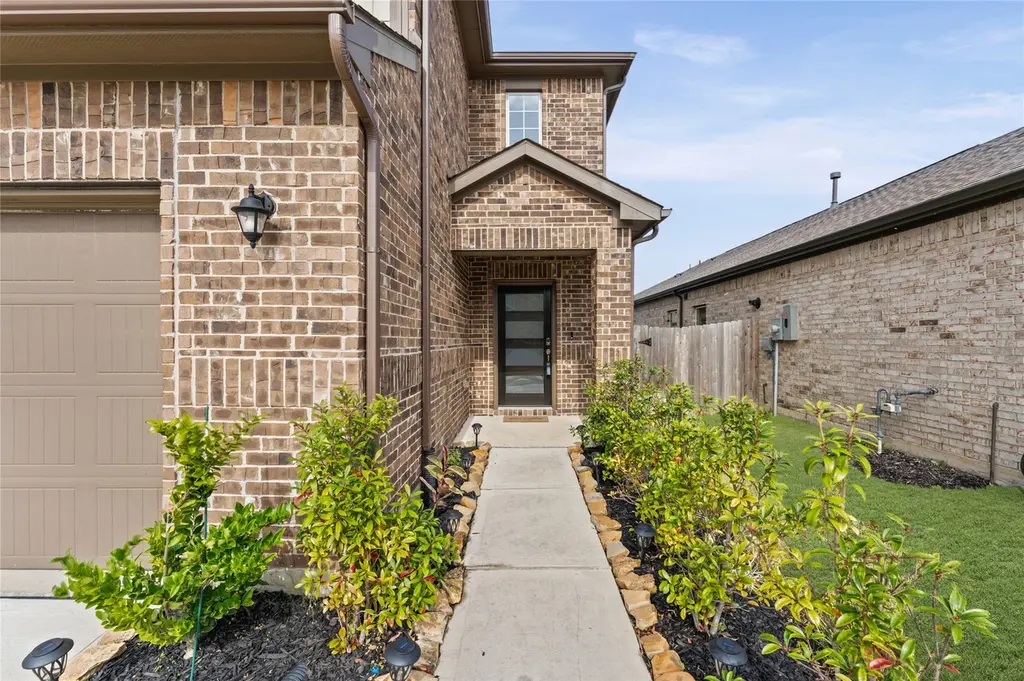
Listing remarks
Welcome to your stunning 5-bedroom home zoned to the highly acclaimed Katy ISD and offers a blend of modern style and functional living. TWO bedrooms down. You’ll be greeted by a wide front yard and a light-filled, open-concept floor plan featuring beautiful wood flooring throughout the spacious living area. The chef-inspired kitchen boasts crisp white cabinetry, premium granite countertops, and stainless steel appliances, with easy access to a massive backyard perfect for entertaining. The primary suite is a private first-floor retreat with peaceful backyard views, while a second downstairs bedroom serves as an ideal home office. Upstairs, discover a huge carpeted game room and three
Key facts
- Massive backyard
- 4,917 sq ft lot
- 2 garage spots
Tags
Property features AI
Finance
- HOA & community: Community managed by Spectrum Association Management; Annual association fee of $750
Exterior
- Parking: Attached 2-car garage
- Utilities: Public water
- Home design: Residential property; Built in 2023; Slab foundation; Composition roof
- Construction: Cement siding construction
- Exterior features: Fully fenced private yard; Back yard fencing; Subdivision lot
Interior
- Kitchen: Dishwasher; Disposal; Microwave; Quartz countertops
- Bedrooms: Primary bedroom (First level) — approx. 15x13; Bedroom (First level) — approx. 10x10; Bedroom (Second level) — approx. 10x12; Bedroom (Second level) — approx. 12x10; Bedroom (Second level) — approx. 13x11
- Flooring: Carpet; Wood
- Bathrooms: 3 full bathrooms
- Heating & cooling: Central heating (Gas); Central air conditioning (Electric)
- Interior features: Double vanity in primary bath; Kitchen open to family room; Primary bedroom with attached bath; Quartz countertops; Living room and dining room configuration
- Laundry & utility: Washer/dryer hookup (laundry/utility details not otherwise specified)
Neighborhood map
What this means for you Summary
Snapshot
- This is a 5-bed/3.0-bath single-family listed at $300k. Condition is rated good.
Deal economics
- At list price, monthly cash flow is $-522 ($-6k/yr) — negative.
- To cash-flow at today's rent, offer at most $235k (21.5% below list).
- To meet the 1% rule (rent ≥ 1% of price), the offer needs to be $281k (6.3% below list).
- Recommended offer: $235k (21.5% below list) — sets the bar for cash-flow.
- Cap rate 4.2% vs local median 3.2% in Houston — top-decile yield for the area; either an underpriced asset or a hidden risk that comps aren't pricing in. Stress-test before assuming the spread holds.
Location & tenants
- Location reads 74/100 on livability (#184 in TX, #4,771 nationally) — a middle-class / working-renter tenant base. Strengths: amenities A+, cost of living A+, housing A+; Watch: crime F.
- Katy ISD (suburban): math 61% / reading 63% proficiency, ranked #29 of 826 in TX (top 4%) — acceptable for families but not a draw, mixed tenant base, ~2y average lease.
- Zoned schools: Stockdick J H (math 41% / reading 51%, grade D+, #462 of 1,662 statewide, top 28%, 1,313 students, 55% FRL); Paetow H S (math 47% / reading 64%, grade C, #364 of 1,632 statewide, top 23%, 3,537 students, 62% FRL) — zoned schools average 58% FRL vs 27% district-wide (31 pts higher); higher-poverty schools than district average — tighter screening recommended.
- Market conditions: Rents soft (-0.8%/yr); 2696 active listings in the ZIP; 26 comparable units currently listed for rent nearby; rentals at typical pace (median 17d on market — plan ~3-4 weeks tenant-placement turnaround); high-income renter base; 29,883 units permitted in Harris County in 2024 (8,621 in 5+ unit buildings).
Forward outlook
- Local home prices are declining (-3.0%/yr); year-one equity from $2k of loan paydown is wiped out by about $9k of value loss. Plan a longer hold.
- Harris County population projected at +47% by 2050 — long-run rental-demand tailwind backs the buy-and-hold thesis.
Negotiation context
- Only 13 days on market — expect competitive offers; lowballing is unlikely to land.
- 4 sale attempts with the ask held roughly flat each time — persistent listings suggest the price (not the market) is what's stuck; bring a comps-based counter.
Risks & watch-outs
- Watch-outs: property tax is 3.9% of price.
- Climate carrying-cost: severe wind risk, 99% chance of damaging wind over 30y; extreme-heat days projected 7→23/yr by 2055 (HVAC capex compounding) — expect insurance premiums to compound above CPI over the hold.
Questions for the listing agent
- What do current leases actually rent for vs. the listed asking? Can we see a recent rent roll and the last 12 months of T-12 income?
- Property tax is high relative to price — has the assessment been appealed recently, and will the sale trigger a re-assessment?
- What does the HOA fee cover, when was the last increase, and are there any pending special assessments or reserve-fund shortfalls?
- Is there a deadline driving the sale (1031 exchange, divorce, estate, relocation)? That informs how much negotiation room exists.
- Schools are D-rated, which usually means shorter tenancies and higher turnover. Who's the typical renter profile here, and what's been the actual vacancy rate?
- Crime grade is F in this area — have there been break-ins, vandalism, or insurance claims at this property in the last 3 years? What carrier currently insures it and at what premium?
- The area grade is low — what's the realistic commute time and amenity access for the typical tenant pool here? Any planned neighborhood developments (good or bad) we should know about?
- What's the average days-on-market for RENTAL listings here right now (not sales)? A rising rental-DOM trend means longer vacancies and softer asking-rent achievability than the comps imply.
- What's the recent tenant-quality profile in this submarket — average credit score on applications, eviction rate, late-payment / NSF rate, and stable-employment percentage? A property-management company in the area should have these aggregated.
- How much new for-sale + rental construction is in the pipeline within 1–3 miles? Heavy new supply typically softens prices + rents 12–24 months out; constrained supply supports both.
Investment metrics
- 1% rule
- 0.94% ✗
- Cap rate
- 4.21%
- Cash-on-cash
- -7.46%
- DSCR
- 0.67
- GRM
- 8.9
CMA / ARV
- ARV (median comp)
- $339,141
- List price
- $300,000
- Delta
- -0.04%
- Verdict
- FAIR
- Comps
- 20 within 1.0 mi
Show comp detail 12 sales within ~0.75 mi
| Address | Dist | Beds/Ba | Sqft | Sold | Price | $/sf | Match |
|---|---|---|---|---|---|---|---|
| 23347 Spring Genesis Ln | 0.05mi | 5/3.0 | 2,544 (0%) | 8mo | $399,999 | $157 | 91 |
| 6010 Birchwood Cliff Trl | 0.16mi | 4/3.5 (-1) | 2,702 (+6%) | 0mo | $399,000 | $148 | 75 |
| 23214 Penstemon Trl | 0.22mi | 4/2.5 (-1) | 2,498 (-2%) | 7mo | $375,000 | $150 | 74 |
| 23010 Needlegrass Rd | 0.51mi | 4/3.5 (-1) | 2,493 (-2%) | 4mo | $365,000 | $146 | 62 |
| 23231 Wise Walk Dr | 0.14mi | 4/2.5 (-1) | 2,166 (-15%) | 2mo | $320,000 | $148 | 60 |
| 6015 Birchwood Cliff Trl | 0.18mi | 4/2.0 (-1) | 2,225 (-12%) | 7mo | $409,990 | $184 | 56 |
| 23838 Northwood Terrace Ln | 0.46mi | 4/3.5 (-1) | 2,787 (+10%) | 3mo | $539,000 | $193 | 54 |
| 23110 True Fortune Dr | 0.40mi | 4/2.5 (-1) | 2,275 (-11%) | 5mo | $299,000 | $131 | 53 |
| 23718 Flint Meadow Trl | 0.44mi | 4/3.0 (-1) | 2,246 (-12%) | 2mo | $359,900 | $160 | 53 |
| 23931 Bearberry Thicket Trl | 0.53mi | 4/2.5 (-1) | 2,772 (+9%) | 2mo | $439,900 | $159 | 52 |
| 6322 Winthrop Terrace Trl | 0.69mi | 4/3.0 (-1) | 2,358 (-7%) | 2mo | $569,000 | $241 | 49 |
| 6143 Rosehill Harvest Loop | 0.53mi | 4/3.0 (-1) | 2,843 (+12%) | 3mo | $450,000 | $158 | 48 |
Match score weights: distance 35% · size 25% · config 20% · recency 20%. Top-matched comps best support the ARV.
Projected returns pro-forma
-3.0% appreciation · 0.0% rent growth · sell at horizon
- IRR
- -33.9%
- Equity multiple
- -0.07×
- Total profit
- $-89,636
- Equity at exit
- $44,731
- IRR
- -76.0%
- Equity multiple
- -0.80×
- Total profit
- $-150,843
- Equity at exit
- $25,939
Cash invested: $84,000 (down + closing). Projections, not guarantees.
Landlord ↔ Tenant lean methodology
- Overall (STATE)
- 87 Strongly Landlord-Friendly
- State Texas
- 87 Strongly Landlord-Friendly · R+5
- County
- — inherits STATE
- City
- — inherits STATE
ZIP-level market 77493
- Rents YoY
- -0.8%
- Active inventory
- 2696
- Price-to-rent
- 8.9×
Monthly cashflow live
- Estimated rent
- $2,810 high interval (Pro) →
- Mortgage (P&I)
- −$1,573
- Tax from tax record
- −$981 /mo · $11,771/yr
- Insurance
- −$125
- HOA
- −$63
- Vacancy / Maint / Mgmt
- −$590
- Net cashflow
- $-522
Break-even live
UW: 25.0% down · 7.5% · 30yr · 1.5% tax · 5.0% vac · 8.0% maint · 8.0% mgmt
Financing live
Cash to close
- Down payment
- $75,000
- Closing costs
- $9,000
- Reserves months
- —
- Total cash needed
- —
Loan-product check · same deal, 3 products live
Conventional
25% down · 7.5% · 30yr
- Down + closing
- —
- Monthly P&I
- —
- Monthly cashflow
- —
- DSCR
- —
- Eligible?
- —
Personal DTI + credit; lowest rate.
DSCR
20% down · 8.5% · 30yr
- Down + closing
- —
- Monthly P&I
- —
- Monthly cashflow
- —
- DSCR
- —
- Eligible?
- —
No personal income docs; deal must DSCR.
Hard money
10% down · 12.0% · 12mo
- Down + closing
- —
- Monthly P&I
- —
- Monthly cashflow
- —
- DSCR
- —
- Eligible?
- —
Short-term bridge; refi at stabilization.
Rent comps 26 comps
| Address | Beds | Baths | Sqft | Rent | $/sqft | DOM | Units | Dist |
|---|---|---|---|---|---|---|---|---|
| 5710 Fresh View Ct Katy, TX | 4.0 | 2.5 | 2313 | $2,495 | $1.08 | 2d | 1 | 0.16mi |
| 5103 Visionary Dr Katy, TX | 3.0–4.0 | 2.0–2.5 | 1692 | $3,096 | $1.83 | 2d | 9 | 0.79mi |
| 22700 Elyson Falls Dr Katy, TX | 2.0–4.0 | 2.0–3.0 | 1658 | $2,925 | $1.76 | 2d | 1 | 1.04mi |
| 22824 Frassino Pl Katy, TX | 4.0 | 2.5 | 2017 | $2,629 | $1.30 | 2d | 1 | 1.08mi |
| 22865 Terrazzo Dr Katy, TX | 4.0 | 2.5 | 2017 | $2,759 | $1.37 | 15d | 1 | 1.11mi |
| 22808 Terrazzo Dr Katy, TX | 4.0 | 2.5 | 2004 | $2,529 | $1.26 | 17d | 1 | 1.13mi |
| 22851 Terazzo Dr Katy, TX | 3.0–4.0 | 2.5–3.0 | 1740 | $3,304 | $1.90 | 1d | 1 | 1.15mi |
| 22738 Terrazzo Dr Katy, TX | 4.0 | 3.0 | 1873 | $2,539 | $1.36 | 20d | 1 | 1.16mi |
| 5007 Royal Amber Ln Katy, TX | 4.0 | 3.0 | 2270 | $1,975 | $0.87 | 44d | 1 | 1.17mi |
| 22716 Terrazzo Dr Katy, TX | 4.0 | 3.0 | 1865 | $2,439 | $1.31 | 5d | 1 | 1.17mi |
| 22718 Terrazzo Dr Katy, TX | 4.0 | 3.0 | 1873 | $2,439 | $1.30 | 5d | 1 | 1.18mi |
| 22722 Terrazzo Dr Katy, TX | 4.0 | 2.5 | 2017 | $2,559 | $1.27 | 17d | 1 | 1.18mi |
| 22622 Terrazzo Dr Katy, TX | 4.0 | 3.0 | 1873 | $2,569 | $1.37 | 44d | 1 | 1.18mi |
| 22616 Terrazzo Dr Katy, TX | 4.0 | 3.0 | 1865 | $2,539 | $1.36 | 15d | 1 | 1.18mi |
| 22614 Terrazzo Dr Katy, TX | 4.0 | 3.0 | 1873 | $2,539 | $1.36 | 13d | 1 | 1.18mi |
| 22720 Terrazzo Dr Katy, TX | 4.0 | 2.5 | 2004 | $2,559 | $1.28 | 17d | 1 | 1.19mi |
| 22624 Terrazzo Dr Katy, TX | 4.0 | 3.0 | 1865 | $2,569 | $1.38 | 44d | 1 | 1.19mi |
| 22737 Terrazzo Dr Katy, TX | 4.0 | 3.0 | 1873 | $2,649 | $1.41 | 44d | 1 | 1.19mi |
| 22626 Terrazzo Dr Katy, TX | 4.0 | 2.5 | 2004 | $2,699 | $1.35 | 44d | 1 | 1.19mi |
| 22719 Terrazzo Dr Katy, TX | 4.0 | 2.5 | 2004 | $2,559 | $1.28 | 17d | 1 | 1.20mi |
| 22628 Terrazzo Dr Katy, TX | 4.0 | 2.5 | 2017 | $2,659 | $1.32 | 15d | 1 | 1.21mi |
| 22717 Terrazzo Dr Katy, TX | 4.0 | 2.5 | 2017 | $2,629 | $1.30 | 5d | 1 | 1.21mi |
| 22615 Terrazzo Dr Katy, TX | 4.0 | 3.0 | 1865 | $2,569 | $1.38 | 44d | 1 | 1.25mi |
| 22613 Terrazzo Dr Katy, TX | 4.0 | 3.0 | 1873 | $2,569 | $1.37 | 44d | 1 | 1.25mi |
| 22611 Terrazzo Dr Katy, TX | 4.0 | 3.0 | 1865 | $2,569 | $1.38 | 44d | 1 | 1.26mi |
| 24430 Piney Harbor Ln Katy, TX | 4.0 | 3.0 | 2859 | $2,800 | $0.98 | 24d | 1 | 1.48mi |
HOA detail
- Monthly dues
- $63 · $756/yr
Listing history 18 events
-
2026-06-18days on market $300,000 Pending 13 DOM
-
2026-06-17days on market $300,000 Pending 12 DOM
-
2026-06-16days on market $300,000 Pending 11 DOM
-
2026-06-15days on market $300,000 Pending 10 DOM
-
2026-06-13statusdays on market $300,000 Pending 8 DOM
-
2026-06-09days on market $300,000 Active 4 DOM
-
2026-06-08days on market $300,000 Active 3 DOM
-
2026-06-07pricedays on market $300,000 Active 2 DOM
-
2026-06-04days on market $339,000 Active 66 DOM
-
2026-06-03days on market $339,000 Active 65 DOM
-
2026-06-02days on market $339,000 Active 64 DOM
-
2026-06-01days on market $339,000 Active 63 DOM
-
2026-05-31days on market $339,000 Active 62 DOM
-
2026-03-30historical
-
2026-03-30$339,000 Active 876-char remark
-
2026-03-03$355,000 Active
-
2026-03-03historical
-
2026-01-16$369,000 Active
ⓘ Source: listings_history table (triggers on properties + properties_extension) + one-shot
backfill from property_details.listing_events for pre-trigger history.
Tax reassessment forecast TX · Resets to sale price
- Current annual tax
- $11,771 · $981/mo
- Projected year-2 tax
- $11,771 · $981/mo
- Expected delta
- $0/yr ($0/mo · 0.0%)
ⓘ Screening estimate from a state-policy table — verify with the county assessor before closing.
Climate risk First Street
- Flood 1/10 Low FEMA zone X (unshaded) · 0% chance over 30 yrs
- Wildfire 4/10 Moderate
- Heat 9/10 Extreme 7 d/yr ≥110°F today · 23 d/yr by 30 yrs out
- Wind 9/10 Extreme 99% chance of damaging wind over 30 yrs
- Air quality 2/10 Low 1 unhealthy d/yr today · 1 by 30 yrs out
Nearby sold comps map
Loading sold comps map…
Walkable amenities ~0.75 mi
Loading nearby amenities…
Taxation est. · year 1
- Rental income
- $33,726
- − Mortgage interest
- −$16,805
- − Property taxes
- −$11,771
- − Insurance
- −$1,500
- − Repairs & maintenance
- −$2,698
- − Management
- −$2,698
- − HOA
- −$756
- − Depreciation
- −$8,727
- Taxable loss
- −$11,230
- Est. tax savings @ 24.0%
- +$2,695
- After-tax cash flow
- $-3,568/yr
For passive investors: Depreciation is non-cash, so a rental often shows a tax loss while cash-flowing — sheltering income. Rental losses are passive: they offset passive income freely, and up to $25,000/yr can offset ordinary (W-2) income if you actively participate and your MAGI is under $100k (phasing out to $0 by $150k); unused losses carry forward. On sale, claimed depreciation is recaptured at up to 25%, and gains may owe capital-gains tax (a 1031 exchange can defer both). Figures are a year-1 estimate at your 24.0% rate — not tax advice; consult a CPA.
Condition & rehab AI · 12 photos
This home is in excellent condition with a good condition score of 80. It is move-in ready with a good rehab level of cosmetic. The highest-ROI updates would be painting the exterior brick, landscaping improvements, new flooring in bathrooms, new kitchen appliances, and new lighting fixtures.
Value-add opportunities
- Both Painting exterior brick — Enhances curb appeal and value
- Both Landscaping improvements — Enhances curb appeal and value
- Both New flooring in bathrooms — Improves aesthetics and functionality
- Both New kitchen appliances — Enhances functionality and value
- Both New lighting fixtures — Enhances aesthetics and functionality
Renovation cost estimate screening
Value-add ROI direction
- Both Painting exterior brick — Enhances curb appeal and value ↑
- Both Landscaping improvements — Enhances curb appeal and value ↑
- Both New flooring in bathrooms — Improves aesthetics and functionality ↑
- Both New kitchen appliances — Enhances functionality and value ↑
- Both New lighting fixtures — Enhances aesthetics and functionality ↑
ⓘ Cost ranges are severity-bucket heuristics (US national rule-of-thumb). Get contractor quotes + a written scope before underwriting a rehab budget.
Schools (NCES district)
- District
- Katy ISD
- NCES district ID
- 4825170
- Math proficiency
- 61% ▼ -7.00%
- Reading proficiency
- 63% ▼ -3.00%
- Median HH income
- $90,312
- Composite
- 56.59/100
- National rank
- #1146
- State rank
- #29 of 826 in TX
Livability — Houston
- Score
- 74/100
- State rank
- #184
- US rank
- #4771
Category grades
Schools grade is shown separately in the Schools card above.
Census & demographics
- County
- Harris County · 4,702,590 people
- City population
- 3,226,434
- Metro
- Houston-The Woodlands-Sugar Land, TX
- Population (ZIP)
- 71,484
- Household income
- $118,464
- Rent vs Own
- Severe rent burden
- 913.0
Population outlook (Harris County) Hauer SSP2
- Today (2025)
- 5,571,493 people
- By 2030
- 6,089,821 · +9.3%
- By 2040
- 7,142,806 · +28.2%
- By 2050
- 8,185,864 · +46.9%
- By 2075
- 10,574,329 · +89.8%
- By 2100
- 12,109,958 · +117.4%
Race, ethnicity, and origin ACS 2023
- Neighborhood character
- Highly diverse neighborhood (Simpson 0.73)
- Race & ethnicity
- White 36% Hispanic / Latino 33% Two or more races 16% Black 15% Asian 12%
- Hispanic origin (detail)
- Mexican 20%
- Common ancestry
- Lithuanian 2% Slovak 1% Italian 1%
- Foreign-born
- 21% · Canada, Vietnam, Jamaica
- Languages at home
- 64% English-only · Spanish 22% Vietnamese 5% French/Haitian/Cajun 4%
Political lean MEDSL · Harris
- 2024 margin
- Lean D (+5.5) · D 52.0% · R 46.4% · Other 1.6%
- 2008→2024 swing
- +3.9pp toward D · 2008: 1.6pp · 2024: 5.5pp
- All cycles
- 2024: D+5.5 2020: D+13.3 2016: D+12.4 2012: D+0.1 2008: D+1.6
Not yet ingested
- Civics
- —
Market trends
- HPI YoY
- ▼ -140.65%
- Current HPI
- 233.1683
- Rent YoY
- ▼ -0.80%
- Metro
- Houston-The Woodlands-Sugar Land, TX
- State GDP YoY
- ▲ 3.95%
- F500 in state
- 110
Industry mix (Fortune 500 HQ in TX)
| Industry | F500 HQs | Revenue |
|---|---|---|
| Energy | 16 | $1,198B |
|
||
| Technology | 5 | $198B |
|
||
| Engineering / Construction | 4 | $72B |
|
||
| Energy Services | 3 | $60B |
|
||
| Utilities | 3 | $41B |
|
||
| Healthcare | 2 | $330B |
|
||
Price history
-18.7% since first listed8 events — show timeline
- 2026-06-13 Pending — HARMLS
- 2026-06-05 Listing Removed — HARMLS
- 2026-06-05 Listed $300,000 HARMLS
- 2026-03-30 Listing Removed — HARMLS
- 2026-03-30 Listed $339,000 HARMLS
- 2026-03-03 Listing Removed — HARMLS
- 2026-03-03 Listed $355,000 HARMLS
- 2026-01-16 Listed $369,000 HARMLS
Property tax history
+203.8%/yrLatest (2025): $11,771 · +7.9% YoY. Source: county tax records.
Cash-flow waterfall
monthlySold comps — $/sqft
last 12 mo · ≤1 miLoading sold comps…