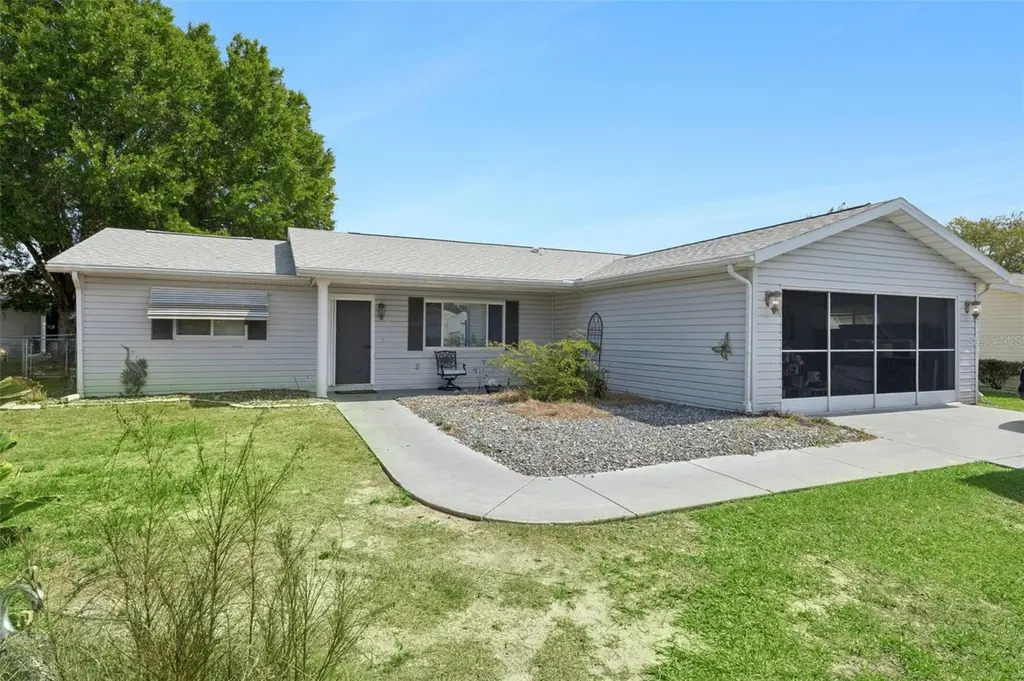
17841 SE 106th Ct · The Villages, FL
Flood risk 1/10 · Minimal
- FEMA flood zone
- X (unshaded)
- Chance of flooding over 30 yrs
- 0.0%
- Est. flood insurance / yr
- $507 – $1,088
Fire risk 3/10 · Minor
- Est. fire insurance / yr
- $947 – $1,759
Heat risk 9/10 · Severe
- Hot days now (above 109°F)
- 7 days/yr
- Hot days in 30 yrs
- 22 days/yr
Wind risk 9/10 · Severe
- Chance of severe wind over 30 yrs
- 99.0%
Air-quality risk 3/10 · Minor
- Unhealthy air days now
- 2 days/yr
- Unhealthy air days in 30 yrs
- 2 days/yr
Risk factors via First Street. Map © Google.
Why this score? — see what drove the D grade
The composite is a weighted blend of 9 inputs, each scored 0–100. Each bar is that input's sub-score; the figure is the points it added to the 100-point composite (weight × sub-score).
- ARV discount +12.0/15.0
- Cash flow +11.6/30.0
- 1% rule +4.0/10.0
- Schools +3.6/10.0
- Livability +3.5/5.0
- DSCR +3.4/10.0
- Rent growth +2.5/5.0
- Condition / age +2.5/5.0
- Appreciation +0.0/10.0
$216,000
🖨 Deal sheet (PDF) 📄 Offer letter ✓ Due diligence
Listing remarks MLS
Located in the sought-after Spruce Creek South 55+ gated golf course community just 2 miles north of The Villages, this 2-bed single family home in Summerfield offers a smart opportunity to secure a well-built home with key updates already completed and room to make it your own. This Chestnut model features a split-bedroom layout with spacious walk-in closets and a functional floor plan designed for comfortable everyday living. The primary suite has been updated with a renovated bathroom showcasing dual vessel sinks, vertical glass tile, and a barn-style sliding glass shower door, along with barn-style doors on both the bathroom and closet for added style and accessibility. Interior details include crown molding, arched doorways, ceiling fans, and a combination of ceramic tile and carpet flooring. The kitchen is equipped with stainless steel appliances, Corian-style countertops, tube lighting, and a recessed fan light, offering a solid foundation for future personalization. A bright Florida room surrounded by windows overlooks the spacious yard and opens to an outdoor patio, creating a natural extension of the living space. Major improvements include a brand new roof completed in 2025 and HVAC replaced in 2015. Additional features include inside laundry, irrigation system, and a 2-car attached garage. This home is priced to reflect the opportunity for cosmetic updates while already offering an updated primary bathroom and important system upgrades. Residents enjoy access to a clubhouse, fitness center, tennis, pickleball, pool, sauna, and a full calendar of social activities. Golf cart access allows convenient travel to nearby shopping, dining, and medical services. HOA includes 24-hour guard and community amenities.
Key facts
- Split-bedroom layout
- Renovated bathroom
- Dual vessel sinks
Tags
Neighborhood map
What this means for you Summary
Snapshot
- This is a 2-bed/2.0-bath single-family listed at $216k.
Deal economics
- At list price, monthly cash flow is $-69 ($-823/yr) — negative.
- To cash-flow at today's rent, offer at most $204k (5.6% below list).
- To meet the 1% rule (rent ≥ 1% of price), the offer needs to be $193k (10.4% below list).
- Recommended offer: $193k (10.4% below list) — sets the bar for 1% rule.
Location & tenants
- Location reads 70/100 on livability (#431 in FL) — a middle-class / working-renter tenant base. Strengths: crime A+, housing A, employment B+; Watch: amenities F, commute F, health & safety F.
- Marion (rural): math 42% / reading 43% proficiency, ranked #61 of 73 in FL (top 84%) — families likely to look elsewhere, expect single-tenant / working-renter base with shorter leases; 61% free/reduced lunch — lower-income household profile, screen leases tightly.
- Zoned schools: Stanton-Weirsdale Elementary School (math 42% / reading 36%, grade F, #1,560 of 2,144 statewide, top 73%, 544 students, 70% FRL); Lake Weir Middle School (math 37% / reading 33%, grade F, #416 of 571 statewide, top 74%, 1,207 students, 76% FRL); Belleview High School (math 31% / reading 46%, grade F, #321 of 667 statewide, top 49%, 1,783 students, 56% FRL).
- Market conditions: 713 active listings in the ZIP; 14 comparable units currently listed for rent nearby; rentals at typical pace (median 23d on market — plan ~3-4 weeks tenant-placement turnaround); 7,071 units permitted in Marion County in 2024 (534 in 5+ unit buildings).
- This rent runs 35% of the median local income ($67k/yr) — at the standard rent-burdened threshold; future hikes will face affordability resistance.
Forward outlook
- Local home prices are declining (-3.0%/yr); year-one equity from $1k of loan paydown is wiped out by about $6k of value loss. Plan a longer hold.
- Marion County population projected at +13% by 2050 — modest demand growth; plan on rents tracking national, not racing it.
Negotiation context
- It's been on market 87 days — a 6% lower offer ($203k) is reasonable based on typical stale-listing flexibility.
- 13 sale attempts since 20y ago with the ask held roughly flat each time — persistent listings suggest the price (not the market) is what's stuck; bring a comps-based counter.
- Current owner paid $162k; 34% above their basis — modest negotiation headroom, anchor on the comps not their cost.
Risks & watch-outs
- Climate carrying-cost: severe wind risk, 99% chance of damaging wind over 30y; extreme-heat days projected 7→22/yr by 2055 (HVAC capex compounding) — expect insurance premiums to compound above CPI over the hold.
Questions for the listing agent
- What do current leases actually rent for vs. the listed asking? Can we see a recent rent roll and the last 12 months of T-12 income?
- It's been on market 87 days. Have you received any prior offers? Is the seller open to a 10% concession, seller financing, or rate buy-down credit?
- What does the HOA fee cover, when was the last increase, and are there any pending special assessments or reserve-fund shortfalls?
- Why hasn't it sold? Are there any deal-killer items the seller is aware of (foundation, flood, title, zoning, code violations)?
- Is there a deadline driving the sale (1031 exchange, divorce, estate, relocation)? That informs how much negotiation room exists.
- Schools are A-rated — typically a magnet for longer-tenancy family renters. What's the average tenant stay here, and is there a school-zone premium baked into asking?
- The area grade is low — what's the realistic commute time and amenity access for the typical tenant pool here? Any planned neighborhood developments (good or bad) we should know about?
- What's the average days-on-market for RENTAL listings here right now (not sales)? A rising rental-DOM trend means longer vacancies and softer asking-rent achievability than the comps imply.
- What's the recent tenant-quality profile in this submarket — average credit score on applications, eviction rate, late-payment / NSF rate, and stable-employment percentage? A property-management company in the area should have these aggregated.
- How much new for-sale + rental construction is in the pipeline within 1–3 miles? Heavy new supply typically softens prices + rents 12–24 months out; constrained supply supports both.
Investment metrics
- 1% rule
- 0.90% ✗
- Cap rate
- 5.91%
- Cash-on-cash
- -1.36%
- DSCR
- 0.94
- GRM
- 9.3
CMA / ARV
- ARV (median comp)
- $239,827
- List price
- $216,000
- Delta
- -9.93%
- Verdict
- FAIR
- Comps
- 20 within 1.0 mi
Show comp detail 12 sales within ~0.75 mi
| Address | Dist | Beds/Ba | Sqft | Sold | Price | $/sf | Match |
|---|---|---|---|---|---|---|---|
| 10683 SE 174th Loop | 0.43mi | 3/2.0 (+1) | 1,450 (+0%) | 2mo | $220,000 | $152 | 73 |
| 10486 SE 179th Pl | 0.28mi | 3/2.0 (+1) | 1,450 (+0%) | 13mo | $250,000 | $172 | 70 |
| 10385 SE 178th St | 0.35mi | 2/2.0 | 1,420 (-2%) | 13mo | $247,900 | $175 | 70 |
| 17815 SE 102nd Ter | 0.44mi | 2/2.0 | 1,372 (-5%) | 3mo | $235,000 | $171 | 68 |
| 10410 SE 179th Pl | 0.37mi | 3/2.0 (+1) | 1,526 (+6%) | 3mo | $205,000 | $134 | 66 |
| 10699 SE 178th St | 0.06mi | 2/2.0 | 1,248 (-14%) | 10mo | $179,000 | $143 | 66 |
| 10340 SE 177th Pl | 0.41mi | 2/2.0 | 1,296 (-10%) | 2mo | $207,000 | $160 | 62 |
| 17971 SE 105th Ct | 0.14mi | 2/2.0 | 1,296 (-10%) | 21mo | $242,000 | $187 | 59 |
| 13550 County Road 109h | 0.68mi | 2/2.0 | 1,482 (+2%) | 22mo | $165,000 | $111 | 45 |
| 17430 SE 110th Ter | 0.54mi | 2/2.0 | 1,623 (+12%) | 12mo | $309,900 | $191 | 44 |
| 11101 SE 174th Loop | 0.48mi | 3/2.0 (+1) | 1,329 (-8%) | 23mo | $351,000 | $264 | 40 |
| 10986 SE 171st Street Rd | 0.72mi | 3/2.0 (+1) | 1,631 (+13%) | 11mo | $325,000 | $199 | 31 |
Match score weights: distance 35% · size 25% · config 20% · recency 20%. Top-matched comps best support the ARV.
Projected returns pro-forma
-3.0% appreciation · 3.0% rent growth · sell at horizon
- IRR
- -18.5%
- Equity multiple
- 0.35×
- Total profit
- $-39,278
- Equity at exit
- $32,206
- IRR
- -10.8%
- Equity multiple
- 0.35×
- Total profit
- $-39,451
- Equity at exit
- $18,676
Cash invested: $60,480 (down + closing). Projections, not guarantees.
Landlord ↔ Tenant lean methodology
- Overall (STATE)
- 87 Strongly Landlord-Friendly
- State Florida
- 87 Strongly Landlord-Friendly · R+3
- County
- — inherits STATE
- City
- — inherits STATE
ZIP-level market 34491
- Home prices YoY
- -35.0%
- Active inventory
- 713
- Price-to-rent
- 9.3×
Monthly cashflow live
- Estimated rent
- $1,935 high interval (Pro) →
- Mortgage (P&I)
- −$1,133
- Tax from tax record
- −$195 /mo · $2,344/yr
- Insurance
- −$90
- HOA
- −$179
- Vacancy / Maint / Mgmt
- −$406
- Net cashflow
- $-69
Break-even live
Sensitivity live
| Price | -10% $54 | -5% $-7 | +0% $-69 | +5% $-130 | +10% $-191 |
|---|---|---|---|---|---|
| Rent | -10% $-221 | -5% $-145 | +0% $-69 | +5% $8 | +10% $84 |
| Rate | -1.0pp $40 | -0.5pp $-14 | base $-69 | +0.5pp $-125 | +1.0pp $-182 |
UW: 25.0% down · 7.5% · 30yr · 1.5% tax · 5.0% vac · 8.0% maint · 8.0% mgmt
Financing live
Cash to close
- Down payment
- $54,000
- Closing costs
- $6,480
- Reserves months
- —
- Total cash needed
- —
Loan-product check · same deal, 3 products live
Conventional
25% down · 7.5% · 30yr
- Down + closing
- —
- Monthly P&I
- —
- Monthly cashflow
- —
- DSCR
- —
- Eligible?
- —
Personal DTI + credit; lowest rate.
DSCR
20% down · 8.5% · 30yr
- Down + closing
- —
- Monthly P&I
- —
- Monthly cashflow
- —
- DSCR
- —
- Eligible?
- —
No personal income docs; deal must DSCR.
Hard money
10% down · 12.0% · 12mo
- Down + closing
- —
- Monthly P&I
- —
- Monthly cashflow
- —
- DSCR
- —
- Eligible?
- —
Short-term bridge; refi at stabilization.
Rent comps 14 comps
| Address | Beds | Baths | Sqft | Rent | $/sqft | DOM | Units | Dist |
|---|---|---|---|---|---|---|---|---|
| 10397 SE 176th St Summerfield, FL | 2.0 | 2.0 | 1296 | $2,150 | $1.66 | 23d | 1 | 0.38mi |
| 13957 County Road 109D Lady Lake, FL | 2.0 | 2.0 | 1482 | $1,650 | $1.11 | 23d | 1 | 0.53mi |
| 13904 County Road 109D Lady Lake, FL | 3.0 | 2.0 | 1568 | $1,550 | $0.99 | 23d | 1 | 0.54mi |
| 17532 SE 100th Ct Summerfield, FL | 2.0 | 2.0 | 1217 | $1,800 | $1.48 | 23d | 1 | 0.73mi |
| 1377 Camero Dr Lady Lake, FL | 3.0 | 2.0 | 1462 | $5,500 | $3.76 | 23d | 1 | 0.91mi |
| 17582 SE 96th Ct Summerfield, FL | 2.0 | 2.0 | 1652 | $1,750 | $1.06 | 23d | 1 | 1.12mi |
| 17199 SE 97th Ter Summerfield, FL | 3.0 | 2.0 | 1404 | $1,990 | $1.42 | 23d | 1 | 1.13mi |
| 17951 SE 115th Cir Summerfield, FL | 3.0 | 2.0 | 1829 | $2,100 | $1.15 | 16d | 1 | 1.14mi |
| 17713 SE 95th Cir Summerfield, FL | 3.0 | 2.0 | 1450 | $2,000 | $1.38 | 23d | 1 | 1.22mi |
| 13740 Lead LN The Villages, FL | 1.0–3.0 | 1.0–2.0 | 1029 | $1,720 | $1.67 | 23d | 38 | 1.23mi |
| 13765 NE 136th Loop Lady Lake, FL | 1.0–3.0 | 1.0–2.0 | 1078 | $1,639 | $1.52 | 23d | 36 | 1.23mi |
| 2006 Cardona Way Lady Lake, FL | 2.0 | 2.0 | 1428 | $3,900 | $2.73 | 23d | 1 | 1.24mi |
| 9990 SE 166th St Summerfield, FL | 3.0 | 2.0 | 962 | $1,395 | $1.45 | 16d | 1 | 1.42mi |
| 17408 SE 121st Cir Summerfield, FL | 3.0 | 2.0 | 1733 | $1,850 | $1.07 | 23d | 1 | 1.44mi |
HOA detail
- Monthly dues
- $179 · $2,148/yr
- Likely covers
- poolgymsecurity
Listing history 46 events
-
2026-06-21days on market $216,000 Active 87 DOM
-
2026-06-18days on market $216,000 Active 84 DOM
-
2026-06-17days on market $216,000 Active 83 DOM
-
2026-06-16days on market $216,000 Active 82 DOM
-
2026-06-15days on market $216,000 Active 81 DOM
-
2026-06-14days on market $216,000 Active 79 DOM
-
2026-06-13days on market $216,000 Active 78 DOM
-
2026-06-10days on market $216,000 Active 76 DOM
-
2026-06-09days on market $216,000 Active 75 DOM
-
2026-06-08days on market $216,000 Active 74 DOM
-
2026-06-07days on market $216,000 Active 73 DOM
-
2026-06-03days on market $216,000 Active 69 DOM
-
2026-06-02days on market $216,000 Active 68 DOM
-
2026-06-01days on market $216,000 Active 67 DOM
-
2026-05-31days on market $216,000 Active 66 DOM
-
2026-05-30days on market $216,000 Active 65 DOM
-
2026-03-26$216,000 Active 1746-char remark
Show marketing remark (1746 chars)
Located in the sought-after Spruce Creek South 55+ gated golf course community just 2 miles north of The Villages, this 2-bed single family home in Summerfield offers a smart opportunity to secure a well-built home with key updates already completed and room to make it your own. This Chestnut model features a split-bedroom layout with spacious walk-in closets and a functional floor plan designed for comfortable everyday living. The primary suite has been updated with a renovated bathroom showcasing dual vessel sinks, vertical glass tile, and a barn-style sliding glass shower door, along with barn-style doors on both the bathroom and closet for added style and accessibility. Interior details include crown molding, arched doorways, ceiling fans, and a combination of ceramic tile and carpet flooring. The kitchen is equipped with stainless steel appliances, Corian-style countertops, tube lighting, and a recessed fan light, offering a solid foundation for future personalization. A bright Florida room surrounded by windows overlooks the spacious yard and opens to an outdoor patio, creating a natural extension of the living space. Major improvements include a brand new roof completed in 2025 and HVAC replaced in 2015. Additional features include inside laundry, irrigation system, and a 2-car attached garage. This home is priced to reflect the opportunity for cosmetic updates while already offering an updated primary bathroom and important system upgrades. Residents enjoy access to a clubhouse, fitness center, tennis, pickleball, pool, sauna, and a full calendar of social activities. Golf cart access allows convenient travel to nearby shopping, dining, and medical services. HOA includes 24-hour guard and community amenities.
-
2022-11-01historical
-
2022-09-08$269,900 Active
-
2020-12-14soldstatus $161,750
-
2020-10-12$168,750
-
2014-04-09soldstatus $90,000
-
2014-04-04soldstatus $90,000
-
2014-04-04soldstatus $90,000
-
2013-06-04$105,000
-
2013-06-04$105,000
-
2007-10-19soldstatus $143,900
-
2007-10-17soldstatus $143,900
-
2007-10-17soldstatus $143,900
-
2007-05-01$148,900
-
2007-05-01$148,900
-
2007-04-30historical
-
2007-04-30historical
-
2007-01-18$153,000
-
2007-01-18$153,000
-
2007-01-17historical
-
2007-01-17historical
-
2006-08-20historical
-
2006-07-20$165,000
-
2006-07-17$165,000
-
2006-07-15historical
-
2006-04-19$169,900
-
2006-02-20$169,900
-
2000-06-09soldstatus $81,000
-
1997-03-25soldstatus $82,500
-
1992-05-01soldstatus $69,400
ⓘ Source: listings_history table (triggers on properties + properties_extension) + one-shot
backfill from property_details.listing_events for pre-trigger history.
Tax reassessment forecast FL · Resets to sale price
- Current annual tax
- $2,344 · $195/mo
- Projected year-2 tax
- $2,344 · $195/mo
- Expected delta
- $0/yr ($0/mo · 0.0%)
ⓘ Screening estimate from a state-policy table — verify with the county assessor before closing.
Climate risk First Street
- Flood 1/10 Low FEMA zone X (unshaded) · 0% chance over 30 yrs
- Wildfire 3/10 Moderate
- Heat 9/10 Extreme 7 d/yr ≥109°F today · 22 d/yr by 30 yrs out
- Wind 9/10 Extreme 99% chance of damaging wind over 30 yrs
- Air quality 3/10 Moderate 2 unhealthy d/yr today · 2 by 30 yrs out
Nearby sold comps map
Loading sold comps map…
Walkable amenities ~0.75 mi
Loading nearby amenities…
Taxation est. · year 1
- Rental income
- $23,216
- − Mortgage interest
- −$12,099
- − Property taxes
- −$2,344
- − Insurance
- −$1,080
- − Repairs & maintenance
- −$1,857
- − Management
- −$1,857
- − HOA
- −$2,148
- − Depreciation
- −$6,284
- Taxable loss
- −$4,453
- Est. tax savings @ 24.0%
- +$1,069
- After-tax cash flow
- $245/yr
For passive investors: Depreciation is non-cash, so a rental often shows a tax loss while cash-flowing — sheltering income. Rental losses are passive: they offset passive income freely, and up to $25,000/yr can offset ordinary (W-2) income if you actively participate and your MAGI is under $100k (phasing out to $0 by $150k); unused losses carry forward. On sale, claimed depreciation is recaptured at up to 25%, and gains may owe capital-gains tax (a 1031 exchange can defer both). Figures are a year-1 estimate at your 24.0% rate — not tax advice; consult a CPA.
Schools (NCES district)
- District
- Marion
- NCES district ID
- 1201260
- Math proficiency
- 42% ▼ -7.00%
- Reading proficiency
- 43% ▼ -4.00%
- Median HH income
- $40,015
- Composite
- 35.61/100
- National rank
- #4890
- State rank
- #61 of 73 in FL
Livability — The Villages
- Score
- 70/100
- State rank
- #431
- US rank
- #7363
Category grades
Schools grade is shown separately in the Schools card above.
Census & demographics
- County
- Marion County · 315,796 people
- City population
- 83,973
- Metro
- Ocala, FL
- Population (ZIP)
- 33,318
- Household income
- $66,679
- Rent vs Own
- Severe rent burden
- 256.0
Population outlook (Marion County) Hauer SSP2
- Today (2025)
- 365,905 people
- By 2030
- 376,768 · +3.0%
- By 2040
- 396,555 · +8.4%
- By 2050
- 412,723 · +12.8%
- By 2075
- 446,090 · +21.9%
- By 2100
- 436,193 · +19.2%
Race, ethnicity, and origin ACS 2023
- Neighborhood character
- Predominantly White (77%)
- Race & ethnicity
- White 77% Hispanic / Latino 14% Two or more races 9% Black 4% Asian 2%
- Hispanic origin (detail)
- Mexican 3% Puerto Rican 6% Cuban 1%
- Common ancestry
- Lithuanian 3% Slovak 2% Romanian 2%
- Foreign-born
- 8% · Canada, Vietnam, Jamaica
- Languages at home
- 85% English-only · Spanish 11% Vietnamese 1% French/Haitian/Cajun 1%
Political lean MEDSL · Marion
- 2024 margin
- Solid R (+31.6) · D 33.8% · R 65.5%
- 2008→2024 swing
- -20.0pp toward R · 2008: -11.6pp · 2024: -31.6pp
- All cycles
- 2024: R+31.6 2020: R+25.9 2016: R+26.2 2012: R+16.2 2008: R+11.6
Not yet ingested
- Civics
- —
Market trends
- HPI YoY
- ▼ -107.67%
- Current HPI
- 200.0792
- Rent YoY
- —
- Metro
- Ocala, FL
- State GDP YoY
- ▲ 3.28%
- F500 in state
- 36
Industry mix (Fortune 500 HQ in FL)
| Industry | F500 HQs | Revenue |
|---|---|---|
| Industrial Technology | 2 | $29B |
|
||
| Insurance | 2 | $17B |
|
||
| Retail | 1 | $60B |
|
||
| Technology Distribution | 1 | $58B |
|
||
| Homebuilding | 1 | $35B |
|
||
| Technology Manufacturing | 1 | $35B |
|
||
Price history
+211.2% since first listed30 events — show timeline
- 2026-03-26 Listed $216,000 Stellar MLS as Distributed by MLS Grid
- 2022-11-01 Listing Removed — Stellar MLS as Distributed by MLS Grid
- 2022-09-08 Listed $269,900 Stellar MLS as Distributed by MLS Grid
- 2020-12-14 Sold (MLS) $161,750 Stellar MLS as Distributed by MLS Grid
- 2020-10-12 Listed $168,750 Stellar MLS as Distributed by MLS Grid
- 2014-04-09 Sold (Public Records) $90,000 Public Records
- 2014-04-04 Sold (MLS) $90,000 Stellar MLS as Distributed by MLS Grid
- 2014-04-04 Sold (MLS) $90,000 Stellar MLS as Distributed by MLS Grid
- 2013-06-04 Listed $105,000 Stellar MLS as Distributed by MLS Grid
- 2013-06-04 Listed $105,000 Stellar MLS as Distributed by MLS Grid
- 2007-10-19 Sold (Public Records) $143,900 Public Records
- 2007-10-17 Sold (MLS) $143,900 Stellar MLS as Distributed by MLS Grid
- 2007-10-17 Sold (MLS) $143,900 Stellar MLS as Distributed by MLS Grid
- 2007-05-01 Listed $148,900 Stellar MLS as Distributed by MLS Grid
- 2007-05-01 Listed $148,900 Stellar MLS as Distributed by MLS Grid
- 2007-04-30 Listing Removed — Stellar MLS as Distributed by MLS Grid
- 2007-04-30 Listing Removed — Stellar MLS as Distributed by MLS Grid
- 2007-01-18 Listed $153,000 Stellar MLS as Distributed by MLS Grid
- 2007-01-18 Listed $153,000 Stellar MLS as Distributed by MLS Grid
- 2007-01-17 Listing Removed — Stellar MLS as Distributed by MLS Grid
- 2007-01-17 Listing Removed — Stellar MLS as Distributed by MLS Grid
- 2006-08-20 Listing Removed — Stellar MLS as Distributed by MLS Grid
- 2006-07-20 Listed $165,000 Stellar MLS as Distributed by MLS Grid
- 2006-07-17 Listed $165,000 Stellar MLS as Distributed by MLS Grid
- 2006-07-15 Listing Removed — Stellar MLS as Distributed by MLS Grid
- 2006-04-19 Listed $169,900 Stellar MLS as Distributed by MLS Grid
- 2006-02-20 Listed $169,900 Stellar MLS as Distributed by MLS Grid
- 2000-06-09 Sold (Public Records) $81,000 Public Records
- 1997-03-25 Sold (Public Records) $82,500 Public Records
- 1992-05-01 Sold (Public Records) $69,400 Public Records
Property tax history
+4.3%/yrLatest (2025): $2,344 · +11.7% YoY. Source: county tax records.
Cash-flow waterfall
monthlySold comps — $/sqft
last 12 mo · ≤1 miLoading sold comps…