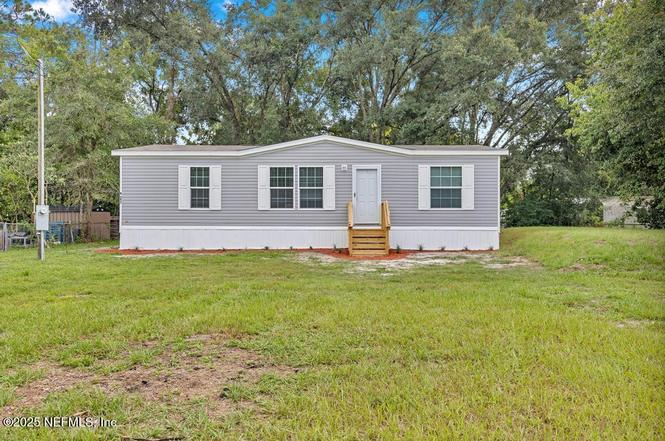
9942 Billmore Cir N · Jacksonville, FL
Flood risk No data
- FEMA flood zone
- —
- Chance of flooding over 30 yrs
- —
- Est. flood insurance / yr
- —
Fire risk No data
- Est. fire insurance / yr
- —
Heat risk No data
- Hot days now (above threshold)
- —
- Hot days in 30 yrs
- —
Wind risk No data
- Chance of severe wind over 30 yrs
- —
Air-quality risk No data
- Unhealthy air days now
- —
- Unhealthy air days in 30 yrs
- —
Risk factors via First Street. Map © Google.
Why this score? — see what drove the C- grade
The composite is a weighted blend of 9 inputs, each scored 0–100. Each bar is that input's sub-score; the figure is the points it added to the 100-point composite (weight × sub-score).
- Cash flow +20.3/30.0
- ARV discount +7.5/15.0
- DSCR +6.4/10.0
- Livability +4.2/5.0
- 1% rule +4.1/10.0
- Schools +3.9/10.0
- Rent growth +3.2/5.0
- Condition / age +2.5/5.0
- Appreciation +0.0/10.0
$197,400
🖨 Deal sheet 📄 Offer letter ✓ Due diligence
Listing remarks
Don't miss out on this brand new 3 bedroom 2 bathroom home! This is an Energy Star rated home, includes brand new Trane HVAC System
Key facts
- Energy star rated
- 0.29 acre lot
- Built 2025
Tags
Property features AI
Finance
- Other: Unfurnished
- HOA & community: Not a senior community
Exterior
- Parking: Other parking
- Utilities: Septic tank; Electricity connected
- Home design: Double wide manufactured home; One story; North-facing
- Construction: Manufactured construction
- Exterior features: Shingle roof; Homesite on a paved city street
Interior
- Kitchen: Dishwasher; Electric range; Refrigerator
- Bedrooms: 3 bedrooms (Main level)
- Flooring: Vinyl
- Bathrooms: 2 full bathrooms
- Heating & cooling: Central heating; Heat pump; Central air conditioning
- Interior features: 1 total room
- Laundry & utility: Washer hookup; Electric dryer hookup
Neighborhood map
What this means for you Summary
Snapshot
- This is a 3-bed/2.0-bath land listed at $197k.
Deal economics
- At list price, monthly cash flow is $251 ($3k/yr) — positive.
- The deal already cash-flows at list — no discount required.
- To meet the 1% rule (rent ≥ 1% of price), the offer needs to be $179k (9.2% below list).
- Recommended offer: $174k (12.0% below list) — sets the bar for market timing.
- Cap rate 7.8% vs local median 4.0% in Jacksonville — top-decile yield for the area; either an underpriced asset or a hidden risk that comps aren't pricing in. Stress-test before assuming the spread holds.
Location & tenants
- Location reads 83/100 on livability (#50 in FL, #911 nationally) — a professional / high-income tenant draw. Strengths: amenities A+, commute A+, housing A+.
- Duval (urban): math 46% / reading 45% proficiency, ranked #48 of 73 in FL (top 66%) — families likely to look elsewhere, expect single-tenant / working-renter base with shorter leases.
- Market conditions: Rents rising (+2.6%/yr); 137 active listings in the ZIP; 11 comparable units currently listed for rent nearby; rentals leasing fast (median 4d on market — plan ~1-2 weeks tenant-placement turnaround); solid renter incomes; 6,503 units permitted in Duval County in 2024 (1,131 in 5+ unit buildings).
Forward outlook
- Local home prices are declining (-3.0%/yr); year-one equity from $1k of loan paydown is wiped out by about $6k of value loss. Plan a longer hold.
- Duval County population projected at +19% by 2050 — long-run rental-demand tailwind backs the buy-and-hold thesis.
Negotiation context
- It's been on market 241 days — a 12% lower offer ($174k) is reasonable based on typical stale-listing flexibility.
Questions for the listing agent
- It's been on market 241 days. Have you received any prior offers? Is the seller open to a 12% concession, seller financing, or rate buy-down credit?
- Why hasn't it sold? Are there any deal-killer items the seller is aware of (foundation, flood, title, zoning, code violations)?
- Is there a deadline driving the sale (1031 exchange, divorce, estate, relocation)? That informs how much negotiation room exists.
- Schools are B-rated — typically a magnet for longer-tenancy family renters. What's the average tenant stay here, and is there a school-zone premium baked into asking?
- What's the average days-on-market for RENTAL listings here right now (not sales)? A rising rental-DOM trend means longer vacancies and softer asking-rent achievability than the comps imply.
- What's the recent tenant-quality profile in this submarket — average credit score on applications, eviction rate, late-payment / NSF rate, and stable-employment percentage? A property-management company in the area should have these aggregated.
- How much new for-sale + rental construction is in the pipeline within 1–3 miles? Heavy new supply typically softens prices + rents 12–24 months out; constrained supply supports both.
Investment metrics
- 1% rule
- 0.91% ✗
- Cap rate
- 7.82%
- Cash-on-cash
- 5.46%
- DSCR
- 1.24
- GRM
- 9.2
CMA / ARV
No comps found within radius.
Projected returns pro-forma
-3.0% appreciation · 2.62% rent growth · sell at horizon
- IRR
- -8.3%
- Equity multiple
- 0.70×
- Total profit
- $-16,752
- Equity at exit
- $29,433
- IRR
- 0.8%
- Equity multiple
- 1.05×
- Total profit
- $2,864
- Equity at exit
- $17,068
Cash invested: $55,272 (down + closing). Projections, not guarantees.
Landlord ↔ Tenant lean methodology
- Overall (STATE)
- 87 Strongly Landlord-Friendly
- State Florida
- 87 Strongly Landlord-Friendly · R+3
- County
- — inherits STATE
- City
- — inherits STATE
ZIP-level market 32222
- Home prices YoY
- -20.0%
- Rents YoY
- 2.6%
- Active inventory
- 137
- Price-to-rent
- 9.2×
Monthly cashflow live
- Estimated rent
- $1,793 high interval (Pro) →
- Mortgage (P&I)
- −$1,035
- Tax from tax record
- −$48 /mo · $571/yr
- Insurance
- −$82
- HOA
- −$0
- Vacancy / Maint / Mgmt
- −$377
- Net cashflow
- $251
Break-even live
UW: 25.0% down · 7.5% · 30yr · 1.5% tax · 5.0% vac · 8.0% maint · 8.0% mgmt
Financing live
Cash to close
- Down payment
- $49,350
- Closing costs
- $5,922
- Reserves months
- —
- Total cash needed
- —
Loan-product check · same deal, 3 products live
Conventional
25% down · 7.5% · 30yr
- Down + closing
- —
- Monthly P&I
- —
- Monthly cashflow
- —
- DSCR
- —
- Eligible?
- —
Personal DTI + credit; lowest rate.
DSCR
20% down · 8.5% · 30yr
- Down + closing
- —
- Monthly P&I
- —
- Monthly cashflow
- —
- DSCR
- —
- Eligible?
- —
No personal income docs; deal must DSCR.
Hard money
10% down · 12.0% · 12mo
- Down + closing
- —
- Monthly P&I
- —
- Monthly cashflow
- —
- DSCR
- —
- Eligible?
- —
Short-term bridge; refi at stabilization.
Rent comps 11 comps
| Address | Beds | Baths | Sqft | Rent | $/sqft | DOM | Units | Dist |
|---|---|---|---|---|---|---|---|---|
| 9956 Somerset Grove Ln Jacksonville, FL | 3.0 | 2.0 | 1168 | $1,675 | $1.43 | 23d | 1 | 0.07mi |
| 5565 Connie Jean Rd Jacksonville, FL | 1.0–2.0 | 1.0 | 630 | $1,100 | $1.75 | 1d | 8 | 0.15mi |
| 5437 Tellaro Ln Unit 1 Jacksonville, FL | 3.0 | 2.5 | 1395 | $1,795 | $1.29 | 20d | 1 | 0.26mi |
| 9732 Chirping Way Jacksonville, FL | 3.0 | 2.0 | 1410 | $1,800 | $1.28 | 4d | 1 | 0.26mi |
| 5216 Brighton Park Ln Jacksonville, FL | 3.0 | 2.5 | 1472 | $1,795 | $1.22 | 10d | 1 | 0.55mi |
| 5229 Walkers Ridge Dr Jacksonville, FL | 3.0 | 2.5 | 1497 | $1,795 | $1.20 | 23d | 1 | 0.58mi |
| 9541 103rd St Jacksonville, FL | 1.0–3.0 | 1.0–2.0 | 1040 | $1,668 | $1.60 | 1d | 21 | 0.66mi |
| 9455 103rd St Jacksonville, FL | 1.0–4.0 | 1.0–2.0 | 1090 | $1,570 | $1.44 | 1d | 18 | 0.75mi |
| 9359 103rd St Jacksonville, FL | 1.0–3.0 | 1.0–2.0 | 848 | $1,479 | $1.74 | 1d | 1 | 0.91mi |
| 10628 Waterfield Rd Jacksonville, FL | 3.0 | 2.5 | 1429 | $1,900 | $1.33 | 23d | 1 | 0.95mi |
| 4910 Samaritan Way Jacksonville, FL | 1.0–2.0 | 1.0–2.0 | 966 | $1,758 | $1.82 | 2d | 16 | 1.35mi |
Listing history 20 events
-
2026-06-02status $197,400 Pending 241 DOM
-
2026-06-01days on market $197,400 Active 241 DOM
-
2026-05-31days on market $197,400 Active 240 DOM
-
2026-05-22price $197,500
-
2026-05-14price $198,900
-
2026-04-16price $199,900
-
2026-03-27price $209,900
-
2026-03-12price $214,800
-
2026-02-27price $214,900
-
2026-02-27price $199,500
-
2026-02-13price $219,900
-
2026-02-05price $226,500
-
2026-01-22price $227,900
-
2026-01-16price $228,500
-
2025-12-04price $228,900
-
2025-11-13price $229,400
-
2025-10-30price $229,500
-
2025-10-23price $229,900
-
2025-10-16price $234,900
-
2025-10-03$239,900 Active
ⓘ Source: listings_history table (triggers on properties + properties_extension) + one-shot
backfill from property_details.listing_events for pre-trigger history.
Tax reassessment forecast FL · Resets to sale price
- Current annual tax
- $571 · $48/mo
- Projected year-2 tax
- $1,638 · $137/mo
- Expected delta
- +$1,067/yr (+$89/mo · 186.8%)
ⓘ Screening estimate from a state-policy table — verify with the county assessor before closing.
Nearby sold comps map
Loading sold comps map…
Walkable amenities ~0.75 mi
Loading nearby amenities…
Taxation est. · year 1
- Rental income
- $21,516
- − Mortgage interest
- −$11,057
- − Property taxes
- −$571
- − Insurance
- −$987
- − Repairs & maintenance
- −$1,721
- − Management
- −$1,721
- − Depreciation
- −$5,743
- Taxable loss
- −$285
- Est. tax savings @ 24.0%
- +$68
- After-tax cash flow
- $3,085/yr
For passive investors: Depreciation is non-cash, so a rental often shows a tax loss while cash-flowing — sheltering income. Rental losses are passive: they offset passive income freely, and up to $25,000/yr can offset ordinary (W-2) income if you actively participate and your MAGI is under $100k (phasing out to $0 by $150k); unused losses carry forward. On sale, claimed depreciation is recaptured at up to 25%, and gains may owe capital-gains tax (a 1031 exchange can defer both). Figures are a year-1 estimate at your 24.0% rate — not tax advice; consult a CPA.
Schools (NCES district)
- District
- Duval
- NCES district ID
- 1200480
- Math proficiency
- 46% ▼ -11.00%
- Reading proficiency
- 45% ▼ -4.00%
- Median HH income
- $48,987
- Composite
- 38.97/100
- National rank
- #4076
- State rank
- #48 of 73 in FL
Livability — Jacksonville
- Score
- 83/100
- State rank
- #50
- US rank
- #911
Category grades
Schools grade is shown separately in the Schools card above.
Census & demographics
- Census place
- Jacksonville, FL
- County
- Duval County · 1,015,274 people
- City population
- 979,034
- Metro
- Jacksonville, FL
- Population (ZIP)
- 18,258
- Household income
- $85,649
- Rent vs Own
- Severe rent burden
- 666.0
Population outlook (Duval County) Hauer SSP2
- Today (2025)
- 1,013,010 people
- By 2030
- 1,059,228 · +4.6%
- By 2040
- 1,141,439 · +12.7%
- By 2050
- 1,205,258 · +19.0%
- By 2075
- 1,324,282 · +30.7%
- By 2100
- 1,319,620 · +30.3%
Race, ethnicity, and origin ACS 2023
- Neighborhood character
- Highly diverse neighborhood (Simpson 0.70)
- Race & ethnicity
- White 39% Black 34% Hispanic / Latino 16% Two or more races 8% Asian 3%
- Hispanic origin (detail)
- Mexican 1% Puerto Rican 6% Cuban 2% Dominican 1%
- Common ancestry
- Italian 2% Iranian 1% Romanian 1%
- Foreign-born
- 13% · Canada, Vietnam
- Languages at home
- 83% English-only · Spanish 12% Tagalog/Filipino 3% Other Asian/Pacific 1%
Political lean MEDSL · Duval
- 2024 margin
- Toss-up / Even · D 48.7% · R 50.1% · Other 1.2%
- 2008→2024 swing
- +0.4pp no change · 2008: -1.9pp · 2024: -1.5pp
- All cycles
- 2024: R+1.5 2020: D+3.8 2016: R+1.5 2012: R+3.6 2008: R+1.9
Not yet ingested
- Civics
- —
Market trends
- HPI YoY
- ▼ -64.56%
- Current HPI
- 257.6466
- Rent YoY
- ▲ 2.62%
- Metro
- Jacksonville, FL
- State GDP YoY
- ▲ 3.28%
- F500 in state
- 36
Industry mix (Fortune 500 HQ in FL)
| Industry | F500 HQs | Revenue |
|---|---|---|
| Industrial Technology | 2 | $29B |
|
||
| Insurance | 2 | $17B |
|
||
| Retail | 1 | $60B |
|
||
| Technology Distribution | 1 | $58B |
|
||
| Homebuilding | 1 | $35B |
|
||
| Technology Manufacturing | 1 | $35B |
|
||
Price history
-17.7% since first listed17 events — show timeline
- 2026-05-22 Price Changed $197,500 realMLS
- 2026-05-14 Price Changed $198,900 realMLS
- 2026-04-16 Price Changed $199,900 realMLS
- 2026-03-27 Price Changed $209,900 realMLS
- 2026-03-12 Price Changed $214,800 realMLS
- 2026-02-27 Price Changed $214,900 realMLS
- 2026-02-27 Price Changed $199,500 realMLS
- 2026-02-13 Price Changed $219,900 realMLS
- 2026-02-05 Price Changed $226,500 realMLS
- 2026-01-22 Price Changed $227,900 realMLS
- 2026-01-16 Price Changed $228,500 realMLS
- 2025-12-04 Price Changed $228,900 realMLS
- 2025-11-13 Price Changed $229,400 realMLS
- 2025-10-30 Price Changed $229,500 realMLS
- 2025-10-23 Price Changed $229,900 realMLS
- 2025-10-16 Price Changed $234,900 realMLS
- 2025-10-03 Listed $239,900 realMLS
Cash-flow waterfall
monthlySold comps — $/sqft
last 12 mo · ≤1 miLoading sold comps…