 🏷️ Likely Rental
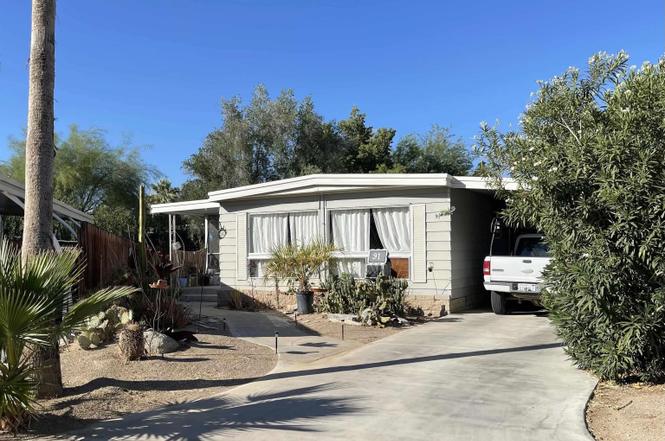
1010 Palm Canyon Dr #91 · Borrego Springs, CA
Flood risk No data
- FEMA flood zone
- —
- Chance of flooding over 30 yrs
- —
- Est. flood insurance / yr
- —
Fire risk No data
- Est. fire insurance / yr
- —
Heat risk No data
- Hot days now (above threshold)
- —
- Hot days in 30 yrs
- —
Wind risk No data
- Chance of severe wind over 30 yrs
- —
Air-quality risk No data
- Unhealthy air days now
- —
- Unhealthy air days in 30 yrs
- —
Risk factors via First Street. Map © Google.
Why this score? — see what drove the C- grade
The composite is a weighted blend of 9 inputs, each scored 0–100. Each bar is that input's sub-score; the figure is the points it added to the 100-point composite (weight × sub-score).
- Cash flow +15.0/30.0
- ARV discount +15.0/15.0
- 1% rule +5.0/10.0
- DSCR +5.0/10.0
- Livability +2.9/5.0
- Schools +2.6/10.0
- Rent growth +2.5/5.0
- Condition / age +2.5/5.0
- Appreciation +0.0/10.0
$39,900
🖨 Deal sheet 📄 Offer letter ✓ Due diligence
Listing remarks
Charming and affordable mobile home located in the desirable RoadRunner Club 55+ community. This well-maintained home features an open floor plan, two bedrooms, and two bathrooms, along with a convenient stackable washer and dryer. Enjoy additional living space in the covered sunroom and a small fenced yard, perfect for relaxing outdoors. Ideally situated on a quiet cul-de-sac, this home offers beautiful golf course views and a peaceful setting. Residents of RoadRunner Club enjoy an exceptional resort-style lifestyle with amenities that include a 24-hour pool and spa, 27 holes of golf, pickleball courts, tennis courts, and horseshoe pits. Land lease is $960 per month. Don't miss this opport
Key facts
- Open floor plan
- Fenced yard
- Covered sunroom
Tags
Property features AI
Finance
- Other: Common-interest lot (shared/common property)
- HOA & community: Located in a senior community (RoadRunner Club)
Exterior
- Parking: 2 parking spaces
- Utilities: Public water; Shared septic
- Home design: Single-story mobile home; Residential property in a senior community (RoadRunner Club, Borrego Springs)
- Construction: Metal roof
- Exterior features: Partial fencing; Community pool
Interior
- Kitchen: Includes dishwasher, refrigerator, gas oven, gas range
- Bedrooms: 2 possible bedrooms
- Bathrooms: 2 full bathrooms
- Heating & cooling: Central air conditioning; Forced air heating (natural gas)
- Interior features: Dishwasher; Refrigerator; Gas oven; Gas range
- Laundry & utility: Washer hookup
Neighborhood map
What this means for you Summary
Snapshot
- This is a 2-bed/2.0-bath manufactured listed at $40k.
Deal economics
- At list price, monthly cash flow is $2k ($18k/yr) — positive.
- The deal already cash-flows at list — no discount required.
- Meets the 1% rule at list price ($2k rent vs $40k).
- Cap rate 51.7% vs local median 6.0% in Borrego Springs — top-decile yield for the area; either an underpriced asset or a hidden risk that comps aren't pricing in. Stress-test before assuming the spread holds.
Location & tenants
- Location reads 58/100 on livability (#712 in CA) — a working-class tenant base; expect higher turnover. Strengths: crime A+, employment A+, housing A+; Watch: schools F, amenities F, commute F.
- Borrego Springs Unified (rural): math 20% / reading 35% proficiency, ranked #1,120 of 1,400 in CA (top 80%) — low school quality limits family demand, transient renter base, plan for 1-2y turnover; 72% free/reduced lunch — lower-income household profile, screen leases tightly.
- Market conditions: 174 active listings in the ZIP; 11,759 units permitted in San Diego County in 2024 (7,244 in 5+ unit buildings).
Forward outlook
- Local home prices are declining (-3.0%/yr); year-one equity from $276 of loan paydown is wiped out by about $1k of value loss. Plan a longer hold.
- San Diego County population projected at +20% by 2050 — long-run rental-demand tailwind backs the buy-and-hold thesis.
- At projected returns (-3.0% appreciation + 3.0% rent growth), your $11k cash investment doubles in ~1 year — after that, you're playing with house money.
Negotiation context
- Only 2 days on market — expect competitive offers; lowballing is unlikely to land.
- 2 sale attempts with the ask held roughly flat each time — persistent listings suggest the price (not the market) is what's stuck; bring a comps-based counter.
Questions for the listing agent
- Built in 1971 — when were the roof, HVAC, electrical panel, plumbing, and water heater last replaced?
- Is there a deadline driving the sale (1031 exchange, divorce, estate, relocation)? That informs how much negotiation room exists.
- Schools are F-rated, which usually means shorter tenancies and higher turnover. Who's the typical renter profile here, and what's been the actual vacancy rate?
- What's the average days-on-market for RENTAL listings here right now (not sales)? A rising rental-DOM trend means longer vacancies and softer asking-rent achievability than the comps imply.
- What's the recent tenant-quality profile in this submarket — average credit score on applications, eviction rate, late-payment / NSF rate, and stable-employment percentage? A property-management company in the area should have these aggregated.
- How much new for-sale + rental construction is in the pipeline within 1–3 miles? Heavy new supply typically softens prices + rents 12–24 months out; constrained supply supports both.
Investment metrics
- 1% rule
- 5.67% ✓
- Cap rate
- 51.74%
- Cash-on-cash
- 162.33%
- DSCR
- 8.22
- GRM
- 1.5
CMA / ARV
- ARV (on-the-fly)
- $57,393
- Comps found
- 2
Show comp detail 2 sales within ~0.75 mi
| Address | Dist | Beds/Ba | Sqft | Sold | Price | $/sf | Match |
|---|---|---|---|---|---|---|---|
| 1010 Palm Canyon Dr #7 | 0.00mi | 2/2.0 | 960 (+5%) | 4mo | $60,000 | $63 | 88 |
| 1010 Palm Canyon Dr #90 | 0.28mi | 2/2.0 | 940 (+3%) | 10mo | $34,000 | $36 | 73 |
Match score weights: distance 35% · size 25% · config 20% · recency 20%. Top-matched comps best support the ARV.
Projected returns pro-forma
-3.0% appreciation · 3.0% rent growth · sell at horizon
- IRR
- —
- Equity multiple
- 9.04×
- Total profit
- $89,822
- Equity at exit
- $5,949
- IRR
- —
- Equity multiple
- 19.11×
- Total profit
- $202,295
- Equity at exit
- $3,450
Cash invested: $11,172 (down + closing). Projections, not guarantees.
Landlord ↔ Tenant lean methodology
- Overall (STATE)
- 18 Strongly Tenant-Friendly
- State California
- 18 Strongly Tenant-Friendly · D+13
- County
- — inherits STATE
- City
- — inherits STATE
ZIP-level market 92004
- Home prices YoY
- -18.4%
- Active inventory
- 174
- Price-to-rent
- 1.5×
Monthly cashflow live
- Estimated rent
- $2,262 medium interval (Pro) →
- Mortgage (P&I)
- −$209
- Tax est. 1.5%
- −$50 /mo · $598/yr
- Insurance
- −$17
- HOA
- −$0
- Vacancy / Maint / Mgmt
- −$475
- Net cashflow
- $1,511
Break-even live
UW: 25.0% down · 7.5% · 30yr · 1.5% tax · 5.0% vac · 8.0% maint · 8.0% mgmt
Financing live
Cash to close
- Down payment
- $9,975
- Closing costs
- $1,197
- Reserves months
- —
- Total cash needed
- —
Loan-product check · same deal, 3 products live
Conventional
25% down · 7.5% · 30yr
- Down + closing
- —
- Monthly P&I
- —
- Monthly cashflow
- —
- DSCR
- —
- Eligible?
- —
Personal DTI + credit; lowest rate.
DSCR
20% down · 8.5% · 30yr
- Down + closing
- —
- Monthly P&I
- —
- Monthly cashflow
- —
- DSCR
- —
- Eligible?
- —
No personal income docs; deal must DSCR.
Hard money
10% down · 12.0% · 12mo
- Down + closing
- —
- Monthly P&I
- —
- Monthly cashflow
- —
- DSCR
- —
- Eligible?
- —
Short-term bridge; refi at stabilization.
Listing history 3 events
-
2026-06-19days on market $39,900 Active 2 DOM
-
2026-06-18remarks 699-char remark
-
2026-06-18$39,900 Active 1 DOM
ⓘ Source: listings_history table (triggers on properties + properties_extension) + one-shot
backfill from property_details.listing_events for pre-trigger history.
Nearby sold comps map
Loading sold comps map…
Walkable amenities ~0.75 mi
Loading nearby amenities…
Taxation est. · year 1
- Rental income
- $27,144
- − Mortgage interest
- −$2,235
- − Property taxes
- −$598
- − Insurance
- −$200
- − Repairs & maintenance
- −$2,172
- − Management
- −$2,172
- − Depreciation
- −$1,161
- Taxable income
- $18,608
- Est. tax owed @ 24.0%
- −$4,466
- After-tax cash flow
- $13,669/yr
For passive investors: Depreciation is non-cash, so a rental often shows a tax loss while cash-flowing — sheltering income. Rental losses are passive: they offset passive income freely, and up to $25,000/yr can offset ordinary (W-2) income if you actively participate and your MAGI is under $100k (phasing out to $0 by $150k); unused losses carry forward. On sale, claimed depreciation is recaptured at up to 25%, and gains may owe capital-gains tax (a 1031 exchange can defer both). Figures are a year-1 estimate at your 24.0% rate — not tax advice; consult a CPA.
Schools (NCES district)
- District
- Borrego Springs Unified
- NCES district ID
- 0605700
- Math proficiency
- 20% ▼ -6.00%
- Reading proficiency
- 35% ▼ -6.00%
- Median HH income
- $42,330
- Composite
- 26.31/100
- National rank
- #12684
- State rank
- #1120 of 1400 in CA
Livability — Borrego Springs
- Score
- 58/100
- State rank
- #712
- US rank
- #21334
Category grades
Schools grade is shown separately in the Schools card above.
Census & demographics
- Census place
- Borrego Springs, CA
- Population (ZIP)
- 3,030
Population outlook (San Diego County) Hauer SSP2
- Today (2025)
- 3,678,185 people
- By 2030
- 3,856,546 · +4.8%
- By 2040
- 4,171,407 · +13.4%
- By 2050
- 4,421,607 · +20.2%
- By 2075
- 4,831,599 · +31.4%
- By 2100
- 4,832,502 · +31.4%
Race, ethnicity, and origin ACS 2023
- Neighborhood character
- Predominantly White (66%)
- Race & ethnicity
- White 66% Hispanic / Latino 33% Two or more races 24%
- Hispanic origin (detail)
- Mexican 29%
- Common ancestry
- Lithuanian 10% Slovak 5% Scotch-Irish 1%
- Foreign-born
- 27% · Canada
- Languages at home
- 70% English-only · Spanish 30%
Political lean MEDSL · San Diego
- 2024 margin
- D (+16.8) · D 56.9% · R 40.1% · Other 2.9%
- 2008→2024 swing
- +6.6pp toward D · 2008: 10.2pp · 2024: 16.8pp
- All cycles
- 2024: D+16.8 2020: D+22.8 2016: D+17.8 2012: D+5.1 2008: D+10.2
Not yet ingested
- Civics
- —
Market trends
- HPI YoY
- ▼ -50.39%
- Current HPI
- 222.8196
- Rent YoY
- —
- Metro
- —
- State GDP YoY
- ▲ 3.21%
- F500 in state
- 116
Industry mix (Fortune 500 HQ in CA)
| Industry | F500 HQs | Revenue |
|---|---|---|
| Technology | 27 | $1,492B |
|
||
| Financial Services | 3 | $174B |
|
||
| Retail | 3 | $44B |
|
||
| Insurance | 3 | $26B |
|
||
| Media / Entertainment | 2 | $115B |
|
||
| Pharmaceuticals / Biotech | 2 | $62B |
|
||
Price history
-42.2% since first listed13 events — show timeline
- 2026-06-02 Listed $39,900 SDMLS
- 2026-04-04 Listing Removed — CRMLS
- 2026-04-03 Price Changed $59,000 CRMLS
- 2026-02-07 Price Changed $51,000 CRMLS
- 2026-01-26 Price Changed $59,000 CRMLS
- 2026-01-17 Price Changed $63,000 CRMLS
- 2026-01-06 Price Changed $64,000 CRMLS
- 2025-12-29 Price Changed $65,000 CRMLS
- 2025-12-11 Price Changed $69,000 CRMLS
- 2025-12-07 Price Changed $72,000 CRMLS
- 2025-11-21 Price Changed $75,000 CRMLS
- 2025-09-01 Price Changed $77,000 CRMLS
- 2025-08-06 Listed $69,000 CRMLS
Cash-flow waterfall
monthlySold comps — $/sqft
last 12 mo · ≤1 miLoading sold comps…