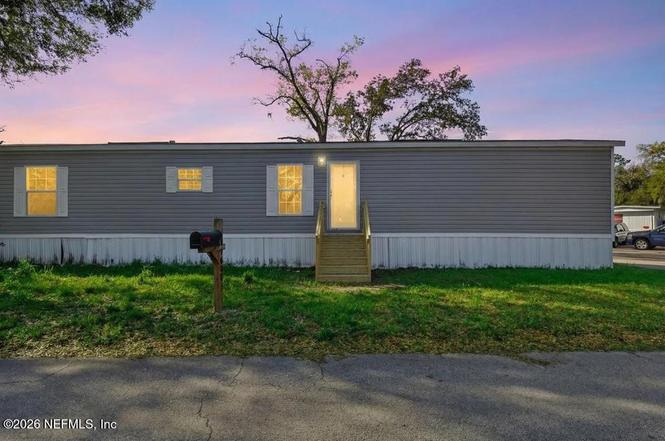
7600 Timberwood Dr · Jacksonville, FL
Flood risk 1/10 · Minimal
- FEMA flood zone
- X (unshaded)
- Chance of flooding over 30 yrs
- 0.0%
- Est. flood insurance / yr
- $507 – $1,088
Fire risk 6/10 · Moderate
- Est. fire insurance / yr
- $947 – $1,759
Heat risk 9/10 · Severe
- Hot days now (above 107°F)
- 7 days/yr
- Hot days in 30 yrs
- 20 days/yr
Wind risk 10/10 · Severe
- Chance of severe wind over 30 yrs
- 99.0%
Air-quality risk 4/10 · Minor
- Unhealthy air days now
- 5 days/yr
- Unhealthy air days in 30 yrs
- 5 days/yr
Risk factors via First Street. Map © Google.
Why this score? — see what drove the B- grade
The composite is a weighted blend of 9 inputs, each scored 0–100. Each bar is that input's sub-score; the figure is the points it added to the 100-point composite (weight × sub-score).
- Cash flow +25.4/30.0
- DSCR +8.4/10.0
- 1% rule +7.7/10.0
- ARV discount +7.5/15.0
- Appreciation +4.2/10.0
- Livability +4.2/5.0
- Schools +3.9/10.0
- Rent growth +2.6/5.0
- Condition / age +2.5/5.0
$145,000
🖨 Deal sheet 📄 Offer letter ✓ Due diligence
Listing remarks MLS
GREAT LOCATION, CLOSE TO AVENUE MALL & ANYTHING YOU NEED OR WANT. THIS MANUF. HOME FEATURES SPLIT BR, FORMAL LR & DR, PLUS A DEN. LOCATED ON A CORNER LOT JUST A 1/2 BLOCK FROM COMMUNITY CLUBHOUSE & POOL. SELLER WILL GIVE CARPET ALLOWANCE & REPLACE CENTRAL HEAT. APPROX. 2 YRS OLD. PLS NO EARLY AM SHOWINGS. SELLER 95 YRS OLD & MOM IS LIVING WITH HIM AND IT IS DIFFICULT TO GET UP & ABOUT EARLY.
Key facts
- Updated kitchen
- New roof
- Remodeled home
Tags
Property features AI
Finance
- HOA & community: Association: Southern Oaks; Monthly association fee of $40; Community clubhouse; Playground; Not a senior community
Exterior
- Parking: Additional parking / Other parking
- Security: Smoke detector(s)
- Utilities: Public sewer; Cable available and connected; Electricity available and connected; Water available and connected; Sewer available and connected
- Home design: Manufactured home; One story; Entry level: 1
- Construction: Aluminum siding; Vinyl siding; Shingle roof
- Exterior features: Community pool (not private); Cleared lot; City street frontage; Asphalt road surface; Smoke detectors
Interior
- Kitchen: Dishwasher; Electric cooktop; Electric oven; Electric range; Microwave; Refrigerator
- Bedrooms: 3 bedrooms
- Flooring: Vinyl
- Bathrooms: 2 full bathrooms
- Heating & cooling: Central heating; Central air conditioning
- Interior features: Ceiling fans; Open floorplan; Primary bathroom with tub and shower; Split bedroom layout; Walk-in closet(s)
- Laundry & utility: In-unit laundry hookups for washer and electric dryer
Neighborhood map
What this means for you Summary
Snapshot
- This is a 3-bed/2.0-bath manufactured listed at $145k.
Deal economics
- At list price, monthly cash flow is $336 ($4k/yr) — positive.
- The deal already cash-flows at list — no discount required.
- Meets the 1% rule at list price ($2k rent vs $145k).
- Recommended offer: $132k (9.0% below list) — sets the bar for market timing.
- Cap rate 9.1% vs local median 4.0% in Jacksonville — top-decile yield for the area; either an underpriced asset or a hidden risk that comps aren't pricing in. Stress-test before assuming the spread holds.
Location & tenants
- Location reads 83/100 on livability (#50 in FL, #911 nationally) — a professional / high-income tenant draw. Strengths: amenities A+, commute A+, housing A+.
- Duval (urban): math 46% / reading 45% proficiency, ranked #48 of 73 in FL (top 66%) — families likely to look elsewhere, expect single-tenant / working-renter base with shorter leases.
- Zoned schools: Mandarin Oaks Elementary School (math 70% / reading 63%, grade B+, #473 of 2,144 statewide, top 23%, 988 students, 32% FRL); Twin Lakes Academy Middle School (math 43% / reading 38%, grade F, #360 of 571 statewide, top 64%, 1,076 students, 44% FRL).
- Market conditions: Rents flat; 513 active listings in the ZIP; 4 comparable units currently listed for rent nearby; rentals leasing fast (median 4d on market — plan ~1-2 weeks tenant-placement turnaround); 6,503 units permitted in Duval County in 2024 (1,131 in 5+ unit buildings).
- This rent runs 30% of the median local income ($74k/yr) — at the standard rent-burdened threshold; future hikes will face affordability resistance.
Forward outlook
- Local home prices are declining (-1.6%/yr); year-one equity from $1k of loan paydown is wiped out by about $2k of value loss. Plan a longer hold.
- Duval County population projected at +19% by 2050 — long-run rental-demand tailwind backs the buy-and-hold thesis.
Negotiation context
- It's been on market 96 days — a 9% lower offer ($132k) is reasonable based on typical stale-listing flexibility.
- 2 sale attempts since 23y ago; this cycle's ask has dropped $44k (23%) from the opening price — seller is motivated, your offer sets the floor, not the list.
- Current owner paid $36k; list at $145k implies a 308% gain — meaningful room to come down on a strong offer.
Risks & watch-outs
- Climate carrying-cost: severe wind risk, 99% chance of damaging wind over 30y; major wildfire risk; extreme-heat days projected 7→20/yr by 2055 (HVAC capex compounding) — expect insurance premiums to compound above CPI over the hold.
Questions for the listing agent
- It's been on market 96 days. Have you received any prior offers? Is the seller open to a 9% concession, seller financing, or rate buy-down credit?
- What does the HOA fee cover, when was the last increase, and are there any pending special assessments or reserve-fund shortfalls?
- Why hasn't it sold? Are there any deal-killer items the seller is aware of (foundation, flood, title, zoning, code violations)?
- Is there a deadline driving the sale (1031 exchange, divorce, estate, relocation)? That informs how much negotiation room exists.
- Schools are B-rated — typically a magnet for longer-tenancy family renters. What's the average tenant stay here, and is there a school-zone premium baked into asking?
- What's the average days-on-market for RENTAL listings here right now (not sales)? A rising rental-DOM trend means longer vacancies and softer asking-rent achievability than the comps imply.
- What's the recent tenant-quality profile in this submarket — average credit score on applications, eviction rate, late-payment / NSF rate, and stable-employment percentage? A property-management company in the area should have these aggregated.
- How much new for-sale + rental construction is in the pipeline within 1–3 miles? Heavy new supply typically softens prices + rents 12–24 months out; constrained supply supports both.
Investment metrics
- 1% rule
- 1.27% ✓
- Cap rate
- 9.07%
- Cash-on-cash
- 9.93%
- DSCR
- 1.44
- GRM
- 6.6
CMA / ARV
No comps found within radius.
Projected returns pro-forma
-1.58% appreciation · 0.39% rent growth · sell at horizon
- IRR
- 1.3%
- Equity multiple
- 1.05×
- Total profit
- $2,119
- Equity at exit
- $31,020
- IRR
- 6.0%
- Equity multiple
- 1.48×
- Total profit
- $19,490
- Equity at exit
- $29,291
Cash invested: $40,600 (down + closing). Projections, not guarantees.
Landlord ↔ Tenant lean methodology
- Overall (STATE)
- 87 Strongly Landlord-Friendly
- State Florida
- 87 Strongly Landlord-Friendly · R+3
- County
- — inherits STATE
- City
- — inherits STATE
ZIP-level market 32256
- Home prices YoY
- -0.7%
- Rents YoY
- 0.4%
- Active inventory
- 513
- Price-to-rent
- 6.6×
Monthly cashflow live
- Estimated rent
- $1,842 medium interval (Pro) →
- Mortgage (P&I)
- −$760
- Tax from tax record
- −$259 /mo · $3,105/yr
- Insurance
- −$60
- HOA
- −$40
- Vacancy / Maint / Mgmt
- −$387
- Net cashflow
- $336
Break-even live
UW: 25.0% down · 7.5% · 30yr · 1.5% tax · 5.0% vac · 8.0% maint · 8.0% mgmt
Financing live
Cash to close
- Down payment
- $36,250
- Closing costs
- $4,350
- Reserves months
- —
- Total cash needed
- —
Loan-product check · same deal, 3 products live
Conventional
25% down · 7.5% · 30yr
- Down + closing
- —
- Monthly P&I
- —
- Monthly cashflow
- —
- DSCR
- —
- Eligible?
- —
Personal DTI + credit; lowest rate.
DSCR
20% down · 8.5% · 30yr
- Down + closing
- —
- Monthly P&I
- —
- Monthly cashflow
- —
- DSCR
- —
- Eligible?
- —
No personal income docs; deal must DSCR.
Hard money
10% down · 12.0% · 12mo
- Down + closing
- —
- Monthly P&I
- —
- Monthly cashflow
- —
- DSCR
- —
- Eligible?
- —
Short-term bridge; refi at stabilization.
Rent comps 4 comps
| Address | Beds | Baths | Sqft | Rent | $/sqft | DOM | Units | Dist |
|---|---|---|---|---|---|---|---|---|
| 10906 Olivewood Ln Jacksonville, FL | 2.0 | 1.0 | 784 | $1,495 | $1.91 | 17d | 1 | 0.18mi |
| 7703 Erinwood Ct E Jacksonville, FL | 3.0 | 2.0 | 1123 | $1,800 | $1.60 | 4d | 1 | 0.22mi |
| 10598 Cordgrass Ln Jacksonville, FL | 1.0–3.0 | 1.0–2.0 | 1131 | $2,305 | $2.04 | 1d | 29 | 0.59mi |
| 11100 Domain Dr Jacksonville, FL | 1.0–2.0 | 1.0–2.5 | 1000 | $2,645 | $2.64 | 1d | 5 | 1.50mi |
HOA detail
- Monthly dues
- $40 · $480/yr
- Likely covers
- pool
Listing history 22 events
-
2026-06-18days on market $145,000 Active 96 DOM
-
2026-06-17days on market $145,000 Active 95 DOM
-
2026-06-16days on market $145,000 Active 94 DOM
-
2026-06-15days on market $145,000 Active 93 DOM
-
2026-06-13days on market $145,000 Active 90 DOM
-
2026-06-10days on market $145,000 Active 87 DOM
-
2026-06-08days on market $145,000 Active 86 DOM
-
2026-06-07pricedays on market $145,000 Active 85 DOM
-
2026-06-03days on market $150,000 Active 81 DOM
-
2026-06-02days on market $150,000 Active 80 DOM
-
2026-06-01days on market $150,000 Active 79 DOM
-
2026-05-31days on market $150,000 Active 78 DOM
-
2026-05-22historical Active Under Contract
-
2026-05-08price $150,000
-
2026-04-25price $164,500
-
2026-04-12price $165,000
-
2026-03-29price $175,000
-
2026-03-14$189,000 Active
-
2003-07-30historical 418-char remark
Show marketing remark (418 chars)
GREAT LOCATION, CLOSE TO AVENUE MALL & ANYTHING YOU NEED OR WANT. THIS MANUF. HOME FEATURES SPLIT BR, FORMAL LR & DR, PLUS A DEN. LOCATED ON A CORNER LOT JUST A 1/2 BLOCK FROM COMMUNITY CLUBHOUSE & POOL. SELLER WILL GIVE CARPET ALLOWANCE & REPLACE CENTRAL HEAT. APPROX. 2 YRS OLD. PLS NO EARLY AM SHOWINGS. SELLER 95 YRS OLD & MOM IS LIVING WITH HIM AND IT IS DIFFICULT TO GET UP & ABOUT EARLY.
-
2003-01-31$59,900 418-char remark
Show marketing remark (418 chars)
GREAT LOCATION, CLOSE TO AVENUE MALL & ANYTHING YOU NEED OR WANT. THIS MANUF. HOME FEATURES SPLIT BR, FORMAL LR & DR, PLUS A DEN. LOCATED ON A CORNER LOT JUST A 1/2 BLOCK FROM COMMUNITY CLUBHOUSE & POOL. SELLER WILL GIVE CARPET ALLOWANCE & REPLACE CENTRAL HEAT. APPROX. 2 YRS OLD. PLS NO EARLY AM SHOWINGS. SELLER 95 YRS OLD & MOM IS LIVING WITH HIM AND IT IS DIFFICULT TO GET UP & ABOUT EARLY.
-
2001-12-06soldstatus $35,500
-
1983-09-01soldstatus $45,800
ⓘ Source: listings_history table (triggers on properties + properties_extension) + one-shot
backfill from property_details.listing_events for pre-trigger history.
Tax reassessment forecast FL · Resets to sale price
- Current annual tax
- $3,105 · $259/mo
- Projected year-2 tax
- $3,105 · $259/mo
- Expected delta
- $0/yr ($0/mo · 0.0%)
ⓘ Screening estimate from a state-policy table — verify with the county assessor before closing.
Climate risk First Street
- Flood 1/10 Low FEMA zone X (unshaded) · 0% chance over 30 yrs
- Wildfire 6/10 Major
- Heat 9/10 Extreme 7 d/yr ≥107°F today · 20 d/yr by 30 yrs out
- Wind 10/10 Extreme 99% chance of damaging wind over 30 yrs
- Air quality 4/10 Moderate 5 unhealthy d/yr today · 5 by 30 yrs out
Nearby sold comps map
Loading sold comps map…
Walkable amenities ~0.75 mi
Loading nearby amenities…
Taxation est. · year 1
- Rental income
- $22,109
- − Mortgage interest
- −$8,122
- − Property taxes
- −$3,105
- − Insurance
- −$725
- − Repairs & maintenance
- −$1,769
- − Management
- −$1,769
- − HOA
- −$480
- − Depreciation
- −$4,218
- Taxable income
- $1,921
- Est. tax owed @ 24.0%
- −$461
- After-tax cash flow
- $3,570/yr
For passive investors: Depreciation is non-cash, so a rental often shows a tax loss while cash-flowing — sheltering income. Rental losses are passive: they offset passive income freely, and up to $25,000/yr can offset ordinary (W-2) income if you actively participate and your MAGI is under $100k (phasing out to $0 by $150k); unused losses carry forward. On sale, claimed depreciation is recaptured at up to 25%, and gains may owe capital-gains tax (a 1031 exchange can defer both). Figures are a year-1 estimate at your 24.0% rate — not tax advice; consult a CPA.
Schools (NCES district)
- District
- Duval
- NCES district ID
- 1200480
- Math proficiency
- 46% ▼ -11.00%
- Reading proficiency
- 45% ▼ -4.00%
- Median HH income
- $48,987
- Composite
- 38.97/100
- National rank
- #4076
- State rank
- #48 of 73 in FL
Livability — Jacksonville
- Score
- 83/100
- State rank
- #50
- US rank
- #911
Category grades
Schools grade is shown separately in the Schools card above.
Census & demographics
- Census place
- Jacksonville, FL
- County
- Duval County · 1,015,274 people
- City population
- 979,034
- Metro
- Jacksonville, FL
- Population (ZIP)
- 58,192
- Household income
- $73,570
- Rent vs Own
- Severe rent burden
- 2706.0
Population outlook (Duval County) Hauer SSP2
- Today (2025)
- 1,013,010 people
- By 2030
- 1,059,228 · +4.6%
- By 2040
- 1,141,439 · +12.7%
- By 2050
- 1,205,258 · +19.0%
- By 2075
- 1,324,282 · +30.7%
- By 2100
- 1,319,620 · +30.3%
Race, ethnicity, and origin ACS 2023
- Neighborhood character
- Diverse neighborhood (Simpson 0.68)
- Race & ethnicity
- White 51% Black 18% Asian 13% Hispanic / Latino 11% Two or more races 10%
- Hispanic origin (detail)
- Puerto Rican 4% Cuban 1%
- Common ancestry
- Italian 4% Lithuanian 2% Romanian 2%
- Foreign-born
- 22% · Canada, Jamaica, China
- Languages at home
- 73% English-only · Spanish 9% Other Indo-European 6% Other Asian/Pacific 3%
Political lean MEDSL · Duval
- 2024 margin
- Toss-up / Even · D 48.7% · R 50.1% · Other 1.2%
- 2008→2024 swing
- +0.4pp no change · 2008: -1.9pp · 2024: -1.5pp
- All cycles
- 2024: R+1.5 2020: D+3.8 2016: R+1.5 2012: R+3.6 2008: R+1.9
Not yet ingested
- Civics
- —
Market trends
- HPI YoY
- ▼ -1.58%
- Current HPI
- 216.5115
- Rent YoY
- ▲ 0.39%
- Metro
- Jacksonville, FL
- State GDP YoY
- ▲ 3.28%
- F500 in state
- 36
Industry mix (Fortune 500 HQ in FL)
| Industry | F500 HQs | Revenue |
|---|---|---|
| Industrial Technology | 2 | $29B |
|
||
| Insurance | 2 | $17B |
|
||
| Retail | 1 | $60B |
|
||
| Technology Distribution | 1 | $58B |
|
||
| Homebuilding | 1 | $35B |
|
||
| Technology Manufacturing | 1 | $35B |
|
||
Price history
+227.5% since first listed10 events — show timeline
- 2026-05-22 Contingent — realMLS
- 2026-05-08 Price Changed $150,000 realMLS
- 2026-04-25 Price Changed $164,500 realMLS
- 2026-04-12 Price Changed $165,000 realMLS
- 2026-03-29 Price Changed $175,000 realMLS
- 2026-03-14 Listed $189,000 realMLS
- 2003-07-30 Listing Removed — realMLS
- 2003-01-31 Listed $59,900 realMLS
- 2001-12-06 Sold (Public Records) $35,500 Public Records
- 1983-09-01 Sold (Public Records) $45,800 Public Records
Property tax history
+28.9%/yrLatest (2025): $3,105 · +11.0% YoY. Source: county tax records.
Cash-flow waterfall
monthlySold comps — $/sqft
last 12 mo · ≤1 miLoading sold comps…