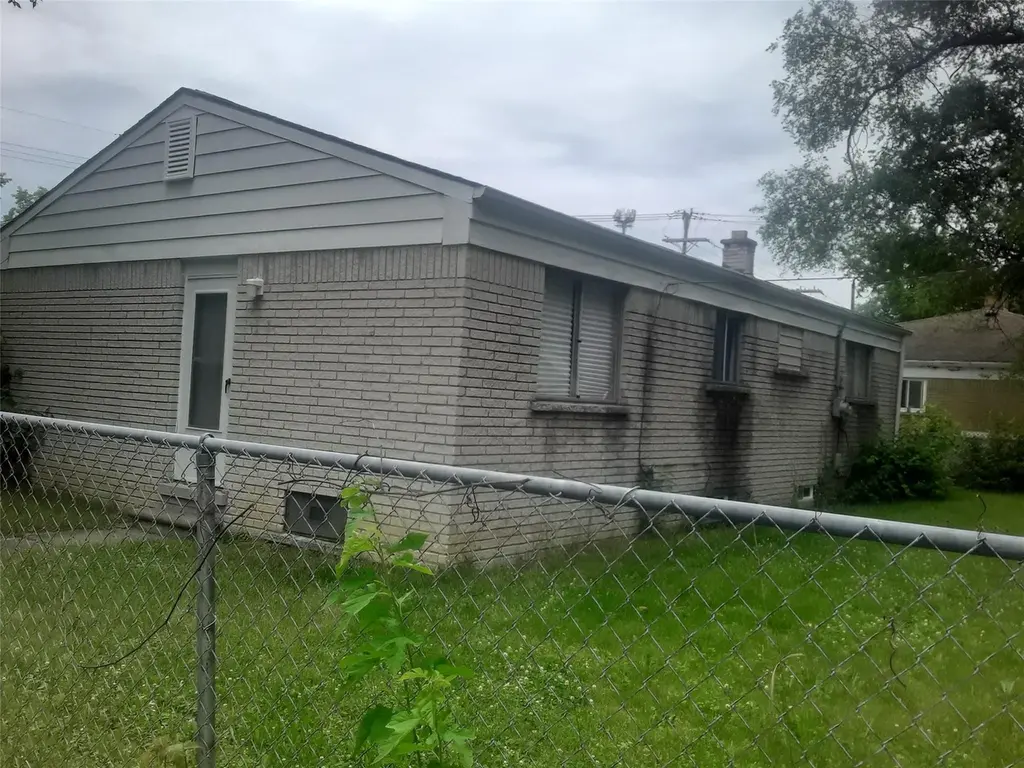
27455 Avondale St · Inkster, MI
Flood risk 1/10 · Minimal
- FEMA flood zone
- X (unshaded)
- Chance of flooding over 30 yrs
- 0.0%
- Est. flood insurance / yr
- $473 – $860
Fire risk 1/10 · Minimal
- Est. fire insurance / yr
- $784 – $1,456
Heat risk 3/10 · Minor
- Hot days now (above 98°F)
- 7 days/yr
- Hot days in 30 yrs
- 15 days/yr
Wind risk 2/10 · Minimal
- Chance of severe wind over 30 yrs
- —
Air-quality risk 2/10 · Minimal
- Unhealthy air days now
- 1 days/yr
- Unhealthy air days in 30 yrs
- 2 days/yr
Risk factors via First Street. Map © Google.
Why this score? — see what drove the B+ grade
The composite is a weighted blend of 9 inputs, each scored 0–100. Each bar is that input's sub-score; the figure is the points it added to the 100-point composite (weight × sub-score).
- Cash flow +30.0/30.0
- ARV discount +15.0/15.0
- DSCR +10.0/10.0
- 1% rule +9.5/10.0
- Livability +3.4/5.0
- Rent growth +3.2/5.0
- Condition / age +2.5/5.0
- Schools +1.6/10.0
- Appreciation +0.0/10.0
$100,000
🖨 Deal sheet (PDF) 📄 Offer letter ✓ Due diligence
Listing remarks MLS
DO NOT MISS THIS ONE ! NICE RANCH, PLENTY OF STORAGE SPACE, 1 BLOCK FROM MAJOR TRANSPORTATION, NEW FURNACE, NEW HOT WATER HEATER, NEW BASEMENT WINDOWS, CLEAN BIG BASEMENT LOTS OF SPACE, NEWER GUTTERS, LARGE GARAGE, WITH SPACE FOR WORK SHOP ! THIS IS IT !
Key facts
- 6,534 sq ft lot
- 2 garage spots
- Built 1970
Neighborhood map
What this means for you Summary
Snapshot
- This is a 3-bed/1.0-bath single-family listed at $100k.
Deal economics
- At list price, monthly cash flow is $390 ($5k/yr) — positive.
- The deal already cash-flows at list — no discount required.
- Meets the 1% rule at list price ($1k rent vs $100k).
- Recommended offer: $88k (12.0% below list) — sets the bar for market timing.
Location & tenants
- Location reads 67/100 on livability (#406 in MI) — a middle-class / working-renter tenant base. Strengths: commute A+, cost of living A+, housing A+; Watch: health & safety D, crime F, amenities F.
- Wayne-Westland Community School District (suburban): math 11% / reading 27% proficiency, ranked #474 of 540 in MI (top 88%) — low school quality limits family demand, transient renter base, plan for 1-2y turnover.
- Zoned schools: David Hicks School (math 2% / reading 8%, grade F, #1,325 of 1,397 statewide, top 99%, 407 students, 89% FRL); Wayne Memorial High School (math 12% / reading 37%, grade F, #481 of 713 statewide, top 81%, 1,361 students, 63% FRL) — zoned schools average 76% FRL vs 56% district-wide (21 pts higher); higher-poverty schools than district average — tighter screening recommended.
- Market conditions: Rents rising (+3.0%/yr); 147 active listings in the ZIP; 20 comparable units currently listed for rent nearby; rentals at typical pace (median 14d on market — plan ~3-4 weeks tenant-placement turnaround); lower-income renter base — watch delinquency; 2,639 units permitted in Wayne County in 2024 (1,216 in 5+ unit buildings).
- This rent runs 44% of the median local income ($39k/yr) — at the standard rent-burdened threshold; future hikes will face affordability resistance.
Forward outlook
- Local home prices are declining (-3.0%/yr); year-one equity from $691 of loan paydown is wiped out by about $3k of value loss. Plan a longer hold.
- Wayne County population projected at -17% by 2050 — secular population decline; favor cash flow + early exit over multi-decade hold.
- At projected returns (-3.0% appreciation + 3.0% rent growth), your $28k cash investment doubles in ~8 years — after that, you're playing with house money.
Negotiation context
- It's been on market 150 days — a 12% lower offer ($88k) is reasonable based on typical stale-listing flexibility.
- 12 sale attempts since 11y ago with the ask held roughly flat each time — persistent listings suggest the price (not the market) is what's stuck; bring a comps-based counter.
Questions for the listing agent
- It's been on market 150 days. Have you received any prior offers? Is the seller open to a 12% concession, seller financing, or rate buy-down credit?
- Built in 1970 — when were the roof, HVAC, electrical panel, plumbing, and water heater last replaced?
- Why hasn't it sold? Are there any deal-killer items the seller is aware of (foundation, flood, title, zoning, code violations)?
- Is there a deadline driving the sale (1031 exchange, divorce, estate, relocation)? That informs how much negotiation room exists.
- Schools are F-rated, which usually means shorter tenancies and higher turnover. Who's the typical renter profile here, and what's been the actual vacancy rate?
- Crime grade is F in this area — have there been break-ins, vandalism, or insurance claims at this property in the last 3 years? What carrier currently insures it and at what premium?
- What's the average days-on-market for RENTAL listings here right now (not sales)? A rising rental-DOM trend means longer vacancies and softer asking-rent achievability than the comps imply.
- What's the recent tenant-quality profile in this submarket — average credit score on applications, eviction rate, late-payment / NSF rate, and stable-employment percentage? A property-management company in the area should have these aggregated.
- How much new for-sale + rental construction is in the pipeline within 1–3 miles? Heavy new supply typically softens prices + rents 12–24 months out; constrained supply supports both.
Investment metrics
- 1% rule
- 1.45% ✓
- Cap rate
- 10.97%
- Cash-on-cash
- 16.72%
- DSCR
- 1.74
- GRM
- 5.7
CMA / ARV
- ARV (on-the-fly)
- $144,525
- Comps found
- 12
Show comp detail 12 sales within ~0.75 mi
| Address | Dist | Beds/Ba | Sqft | Sold | Price | $/sf | Match |
|---|---|---|---|---|---|---|---|
| 363 Sherbourne St | 0.39mi | 3/1.5 | 1,030 (+0%) | 2mo | $160,000 | $155 | 78 |
| 28005 Avondale St | 0.27mi | 3/1.0 | 962 (-6%) | 2mo | $107,500 | $112 | 75 |
| 28521 Oakwood St | 0.54mi | 3/1.0 | 1,025 (0%) | 1mo | $145,000 | $141 | 74 |
| 1058 Magnolia Dr | 0.40mi | 3/1.0 | 1,000 (-2%) | 3mo | $77,257 | $77 | 74 |
| 1248 Colonial Dr | 0.24mi | 3/1.0 | 1,120 (+9%) | 6mo | $105,000 | $94 | 68 |
| 1088 Arlington St | 0.47mi | 3/1.0 | 1,076 (+5%) | 4mo | $137,500 | $128 | 66 |
| 112 Brentwood St | 0.60mi | 3/1.0 | 994 (-3%) | 1mo | $164,000 | $165 | 66 |
| 291 Arlington St | 0.47mi | 3/1.0 | 966 (-6%) | 5mo | $139,000 | $144 | 65 |
| 216 Helen St | 0.64mi | 3/1.0 | 958 (-6%) | 6mo | $178,866 | $187 | 54 |
| 26628 Oakland St | 0.74mi | 3/1.0 | 921 (-10%) | 6mo | $111,610 | $121 | 43 |
| 26723 W Hills Dr | 0.69mi | 3/1.5 | 890 (-13%) | 3mo | $110,000 | $124 | 41 |
| 784 Patterson Ct | 0.72mi | 3/2.0 | 1,140 (+11%) | 6mo | $170,000 | $149 | 39 |
Match score weights: distance 35% · size 25% · config 20% · recency 20%. Top-matched comps best support the ARV.
Projected returns pro-forma
-3.0% appreciation · 2.95% rent growth · sell at horizon
- IRR
- 7.9%
- Equity multiple
- 1.31×
- Total profit
- $8,627
- Equity at exit
- $14,910
- IRR
- 17.1%
- Equity multiple
- 2.41×
- Total profit
- $39,455
- Equity at exit
- $8,646
Cash invested: $28,000 (down + closing). Projections, not guarantees.
Landlord ↔ Tenant lean methodology
- Overall (STATE)
- 62 Landlord-Friendly
- State Michigan
- 62 Landlord-Friendly · EVEN
- County
- — inherits STATE
- City
- — inherits STATE
ZIP-level market 48141
- Home prices YoY
- -2.9%
- Rents YoY
- 3.0%
- Active inventory
- 147
- Price-to-rent
- 5.7×
Monthly cashflow live
- Estimated rent
- $1,453 high interval (Pro) →
- Mortgage (P&I)
- −$524
- Tax from tax record
- −$192 /mo · $2,301/yr
- Insurance
- −$42
- HOA
- −$0
- Vacancy / Maint / Mgmt
- −$305
- Net cashflow
- $390
Break-even live
Sensitivity live
| Price | -10% $447 | -5% $418 | +0% $390 | +5% $362 | +10% $333 |
|---|---|---|---|---|---|
| Rent | -10% $275 | -5% $333 | +0% $390 | +5% $447 | +10% $505 |
| Rate | -1.0pp $440 | -0.5pp $415 | base $390 | +0.5pp $364 | +1.0pp $338 |
UW: 25.0% down · 7.5% · 30yr · 1.5% tax · 5.0% vac · 8.0% maint · 8.0% mgmt
Financing live
Cash to close
- Down payment
- $25,000
- Closing costs
- $3,000
- Reserves months
- —
- Total cash needed
- —
Loan-product check · same deal, 3 products live
Conventional
25% down · 7.5% · 30yr
- Down + closing
- —
- Monthly P&I
- —
- Monthly cashflow
- —
- DSCR
- —
- Eligible?
- —
Personal DTI + credit; lowest rate.
DSCR
20% down · 8.5% · 30yr
- Down + closing
- —
- Monthly P&I
- —
- Monthly cashflow
- —
- DSCR
- —
- Eligible?
- —
No personal income docs; deal must DSCR.
Hard money
10% down · 12.0% · 12mo
- Down + closing
- —
- Monthly P&I
- —
- Monthly cashflow
- —
- DSCR
- —
- Eligible?
- —
Short-term bridge; refi at stabilization.
Rent comps 20 comps
| Address | Beds | Baths | Sqft | Rent | $/sqft | DOM | Units | Dist |
|---|---|---|---|---|---|---|---|---|
| 27184 Lucerne Dr Inkster, MI | 3.0 | 1.0 | 1100 | $1,250 | $1.14 | 45d | 1 | 0.19mi |
| 1189 Woodland Dr Inkster, MI | 3.0 | 1.0 | 994 | $1,400 | $1.41 | 0d | 1 | 0.29mi |
| 1150 Magnolia Dr Inkster, MI | 3.0 | 1.0 | 900 | $1,300 | $1.44 | 25d | 1 | 0.38mi |
| 238 Yorkshire Blvd Dearborn Heights, MI | 1.0–2.0 | 1.0 | 741 | $1,424 | $1.92 | 0d | 15 | 0.65mi |
| 29203 Oakwood St Inkster, MI | 3.0 | 1.5 | 912 | $1,600 | $1.75 | 0d | 1 | 0.87mi |
| 641 Gilman St Garden City, MI | 3.0 | 1.0 | 1300 | $2,600 | $2.00 | 18d | 1 | 0.89mi |
| 26322 Westphal St Dearborn Heights, MI | 1.0–2.0 | 1.0 | 762 | $1,455 | $1.91 | 0d | 25 | 0.91mi |
| 167 Cherry Valley Dr Inkster, MI | 1.0–2.0 | 1.0 | 784 | $1,395 | $1.78 | 16d | 12 | 0.99mi |
| 572 Tobin Dr Inkster, MI | 1.0–3.0 | 1.0–2.0 | 936 | $1,600 | $1.71 | 0d | 20 | 1.03mi |
| 29800 Oakwood St Inkster, MI | 3.0 | 1.0 | 1040 | $1,400 | $1.35 | 14d | 1 | 1.12mi |
| 3236 Walnut St Inkster, MI | 3.0 | 1.0 | 1096 | $1,495 | $1.36 | 0d | 1 | 1.23mi |
| 30010 Hazelwood St Inkster, MI | 3.0 | 1.0 | 1044 | $1,300 | $1.25 | 45d | 1 | 1.24mi |
| 30043 Grandview St Unit 1 Inkster, MI | 3.0 | 1.5 | 1004 | $1,275 | $1.27 | 45d | 1 | 1.29mi |
| 1713 Gilman St Garden City, MI | 3.0 | 1.0 | 860 | $1,600 | $1.86 | 0d | 1 | 1.33mi |
| 29971 Brooklane St Inkster, MI | 3.0 | 1.0 | 974 | $1,450 | $1.49 | 45d | 1 | 1.37mi |
| 27139 Penn St Inkster, MI | 3.0 | 1.0 | 832 | $675 | $0.81 | 19d | 1 | 1.38mi |
| 536 N Leona Ave Garden City, MI | 3.0 | 1.0 | 1000 | $1,440 | $1.44 | 14d | 1 | 1.41mi |
| 26742 Penn St Inkster, MI | 3.0 | 1.0 | 1000 | $1,300 | $1.30 | 18d | 1 | 1.41mi |
| 26707 Penn St Inkster, MI | 3.0 | 1.0 | 900 | $1,400 | $1.56 | 6d | 1 | 1.45mi |
| 25745 Princeton St Dearborn Heights, MI | 3.0 | 1.0 | 1080 | $1,500 | $1.39 | 12d | 1 | 1.49mi |
Listing history 28 events
-
2025-06-27status Pending
-
2025-03-25historical
-
2024-12-17status Pending
-
2022-04-07soldstatus $98,000
-
2022-04-05status Pending 254-char remark
Show marketing remark (254 chars)
DO NOT MISS THIS ONE ! NICE RANCH, PLENTY OF STORAGE SPACE, 1 BLOCK FROM MAJOR TRANSPORTATION, NEW FURNACE, NEW HOT WATER HEATER, NEW BASEMENT WINDOWS, CLEAN BIG BASEMENT LOTS OF SPACE, NEWER GUTTERS, LARGE GARAGE, WITH SPACE FOR WORK SHOP ! THIS IS IT !
-
2022-04-05status Pending
Show marketing remark (254 chars)
DO NOT MISS THIS ONE ! NICE RANCH, PLENTY OF STORAGE SPACE, 1 BLOCK FROM MAJOR TRANSPORTATION, NEW FURNACE, NEW HOT WATER HEATER, NEW BASEMENT WINDOWS, CLEAN BIG BASEMENT LOTS OF SPACE, NEWER GUTTERS, LARGE GARAGE, WITH SPACE FOR WORK SHOP ! THIS IS IT !
-
2021-11-05$100,000 Active
Show marketing remark (254 chars)
DO NOT MISS THIS ONE ! NICE RANCH, PLENTY OF STORAGE SPACE, 1 BLOCK FROM MAJOR TRANSPORTATION, NEW FURNACE, NEW HOT WATER HEATER, NEW BASEMENT WINDOWS, CLEAN BIG BASEMENT LOTS OF SPACE, NEWER GUTTERS, LARGE GARAGE, WITH SPACE FOR WORK SHOP ! THIS IS IT !
-
2021-11-05$100,000 Active 254-char remark
Show marketing remark (254 chars)
DO NOT MISS THIS ONE ! NICE RANCH, PLENTY OF STORAGE SPACE, 1 BLOCK FROM MAJOR TRANSPORTATION, NEW FURNACE, NEW HOT WATER HEATER, NEW BASEMENT WINDOWS, CLEAN BIG BASEMENT LOTS OF SPACE, NEWER GUTTERS, LARGE GARAGE, WITH SPACE FOR WORK SHOP ! THIS IS IT !
-
2021-10-29historical
-
2021-10-28historical
-
2021-09-28status Active
-
2021-09-28status Active
-
2021-08-11status Pending
-
2021-08-11status Pending
-
2021-06-29$89,900 Active
-
2021-06-29$89,900 Active
-
2019-08-16historical
-
2019-08-15historical
-
2019-08-14status Active
-
2019-08-14status Active
-
2019-08-07historical
-
2019-08-06historical
-
2019-06-21status Active
-
2019-06-13historical
-
2019-02-15$45,000 Active
-
2019-02-15$45,000 Active
-
2016-01-30historical
-
2015-07-30$750
ⓘ Source: listings_history table (triggers on properties + properties_extension) + one-shot
backfill from property_details.listing_events for pre-trigger history.
Tax reassessment forecast MI · Partial reset (capped growth)
- Current annual tax
- $2,301 · $192/mo
- Projected year-2 tax
- $2,301 · $192/mo
- Expected delta
- $0/yr ($0/mo · 0.0%)
ⓘ Screening estimate from a state-policy table — verify with the county assessor before closing.
Climate risk First Street
- Flood 1/10 Low FEMA zone X (unshaded) · 0% chance over 30 yrs
- Wildfire 1/10 Low
- Heat 3/10 Moderate 7 d/yr ≥98°F today · 15 d/yr by 30 yrs out
- Wind 2/10 Low
- Air quality 2/10 Low 1 unhealthy d/yr today · 2 by 30 yrs out
Nearby sold comps map
Loading sold comps map…
Walkable amenities ~0.75 mi
Loading nearby amenities…
Taxation est. · year 1
- Rental income
- $17,436
- − Mortgage interest
- −$5,602
- − Property taxes
- −$2,301
- − Insurance
- −$500
- − Repairs & maintenance
- −$1,395
- − Management
- −$1,395
- − Depreciation
- −$2,909
- Taxable income
- $3,334
- Est. tax owed @ 24.0%
- −$800
- After-tax cash flow
- $3,880/yr
For passive investors: Depreciation is non-cash, so a rental often shows a tax loss while cash-flowing — sheltering income. Rental losses are passive: they offset passive income freely, and up to $25,000/yr can offset ordinary (W-2) income if you actively participate and your MAGI is under $100k (phasing out to $0 by $150k); unused losses carry forward. On sale, claimed depreciation is recaptured at up to 25%, and gains may owe capital-gains tax (a 1031 exchange can defer both). Figures are a year-1 estimate at your 24.0% rate — not tax advice; consult a CPA.
Schools (NCES district)
- District
- Wayne-Westland Community School District
- NCES district ID
- 2600015
- Math proficiency
- 11% ▼ -6.00%
- Reading proficiency
- 27% ▼ -2.00%
- Median HH income
- $43,524
- Composite
- 16.4/100
- National rank
- #9195
- State rank
- #474 of 540 in MI
Livability — Inkster
- Score
- 67/100
- State rank
- #406
- US rank
- #11087
Category grades
Schools grade is shown separately in the Schools card above.
Census & demographics
- Census place
- Inkster, MI
- County
- Wayne County · 1,562,939 people
- City population
- 25,428
- Metro
- Detroit-Warren-Dearborn, MI
- Population (ZIP)
- 25,428
- Household income
- $39,252
- Rent vs Own
- Severe rent burden
- 1558.0
Population outlook (Wayne County) Hauer SSP2
- Today (2025)
- 1,675,273 people
- By 2030
- 1,620,300 · -3.3%
- By 2040
- 1,502,341 · -10.3%
- By 2050
- 1,384,039 · -17.4%
- By 2075
- 1,124,592 · -32.9%
- By 2100
- 881,193 · -47.4%
Race, ethnicity, and origin ACS 2023
- Neighborhood character
- Predominantly Black (72%)
- Race & ethnicity
- Black 72% White 17% Two or more races 7% Hispanic / Latino 2% Asian 1%
- Common ancestry
- Romanian 3% Slovak 1% Italian 1%
- Foreign-born
- 5% · Canada, China
- Languages at home
- 92% English-only · Arabic 3% Other Asian/Pacific 1% Spanish 1%
Political lean MEDSL · Wayne
- 2024 margin
- Strong D (+29.0) · D 62.7% · R 33.7% · Other 3.6%
- 2008→2024 swing
- -20.5pp toward R · 2008: 49.5pp · 2024: 29.0pp
- All cycles
- 2024: D+29.0 2020: D+38.1 2016: D+37.3 2012: D+46.9 2008: D+49.5
Not yet ingested
- Civics
- —
Market trends
- HPI YoY
- ▼ -11.74%
- Current HPI
- 390.2139
- Rent YoY
- ▲ 2.95%
- Metro
- Detroit-Warren-Dearborn, MI
- State GDP YoY
- ▲ 1.37%
- F500 in state
- 28
Industry mix (Fortune 500 HQ in MI)
| Industry | F500 HQs | Revenue |
|---|---|---|
| Automotive Parts | 3 | $48B |
|
||
| Automotive | 2 | $372B |
|
||
| Chemicals | 1 | $45B |
|
||
| Automotive Retail | 1 | $29B |
|
||
| Healthcare / Medical Devices | 1 | $23B |
|
||
| Automotive Technology | 1 | $20B |
|
||
Price history
+117.8% since first listed28 events — show timeline
- 2025-06-27 Pending — REALCOMP
- 2025-03-25 Listing Removed — REALCOMP
- 2024-12-17 Pending — REALCOMP
- 2022-04-07 Sold (Public Records) $98,000 Public Records
- 2022-04-05 Pending — MiRealSource-MiMLS
- 2022-04-05 Pending — REALCOMP
- 2021-11-05 Listed $100,000 MiRealSource-MiMLS
- 2021-11-05 Listed $100,000 REALCOMP
- 2021-10-29 Listing Removed — REALCOMP
- 2021-10-28 Listing Removed — MiRealSource-MiMLS
- 2021-09-28 Relisted — MiRealSource-MiMLS
- 2021-09-28 Relisted — REALCOMP
- 2021-08-11 Pending — MiRealSource-MiMLS
- 2021-08-11 Pending — REALCOMP
- 2021-06-29 Listed $89,900 MiRealSource-MiMLS
- 2021-06-29 Listed $89,900 REALCOMP
- 2019-08-16 Listing Removed — REALCOMP
- 2019-08-15 Listing Removed — MiRealSource-MiMLS
- 2019-08-14 Relisted — MiRealSource-MiMLS
- 2019-08-14 Relisted — REALCOMP
- 2019-08-07 Listing Removed — REALCOMP
- 2019-08-06 Listing Removed — MiRealSource-MiMLS
- 2019-06-21 Relisted — REALCOMP
- 2019-06-13 Listing Removed — REALCOMP
- 2019-02-15 Listed $45,000 MiRealSource-MiMLS
- 2019-02-15 Listed $45,000 REALCOMP
- 2016-01-30 Listing Removed — MiRealSource-MiMLS
- 2015-07-30 Listed $750 MiRealSource-MiMLS
Property tax history
-3.8%/yrLatest (2025): $2,301 · -17.2% YoY. Source: county tax records.
Cash-flow waterfall
monthlySold comps — $/sqft
last 12 mo · ≤1 miLoading sold comps…