12727 W Glendale Ave #42 · Glendale, AZ
Flood risk 1/10 · Minimal
- FEMA flood zone
- X (shaded)
- Chance of flooding over 30 yrs
- 0.0%
- Est. flood insurance / yr
- $507 – $1,088
Fire risk 4/10 · Minor
- Est. fire insurance / yr
- $610 – $1,132
Heat risk 9/10 · Severe
- Hot days now (above 113°F)
- 7 days/yr
- Hot days in 30 yrs
- 19 days/yr
Wind risk 1/10 · Minimal
- Chance of severe wind over 30 yrs
- —
Air-quality risk 1/10 · Minimal
- Unhealthy air days now
- 0 days/yr
- Unhealthy air days in 30 yrs
- 0 days/yr
Risk factors via First Street. Map © Google.
Why this score? — see what drove the B- grade
The composite is a weighted blend of 9 inputs, each scored 0–100. Each bar is that input's sub-score; the figure is the points it added to the 100-point composite (weight × sub-score).
- Cash flow +30.0/30.0
- 1% rule +10.0/10.0
- DSCR +10.0/10.0
- ARV discount +7.5/15.0
- Livability +3.8/5.0
- Condition / age +3.8/5.0
- Schools +2.8/10.0
- Rent growth +1.8/5.0
- Appreciation +0.0/10.0
$60,000
🖨 Deal sheet 📄 Offer letter ✓ Due diligence
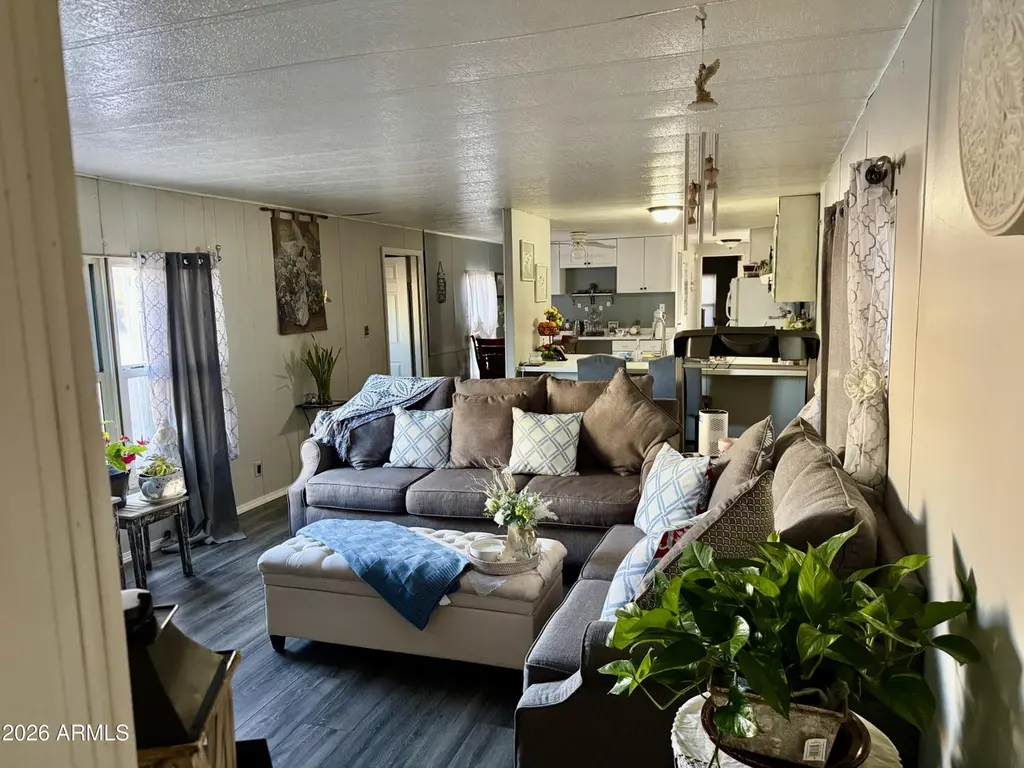
Listing remarks
Great starter Mobile home in the desirable community of Hacienda Del Sol 2 bed plus Den 2 bath. Great amenities at Hacienda Del Sol swimming pool, Fitness Center, Basketball court. kids playground, Laundromat and event hall with kitchen. RV Parking for tenants available.
Key facts
- 3 parking spots
- Community pool
- Built 1982
Property features AI
Finance
- Other: Lot size source: owner; Building area source: owner
- HOA & community: Land lease: $900 per month; Association fees include sewer, trash, and water; Community pool
Exterior
- Parking: 3 covered parking spaces; 3 carport spaces
- Utilities: Onsite well (water); Septic tank (sewer)
- Home design: Manufactured/Mobile home; Leasehold ownership
- Construction: Steel frame construction; Foam roof
- Exterior features: Chain link fencing; Gravel/stone front; Private maintained road; City maintained road
Interior
- Kitchen: Built-in gas oven
- Bedrooms: 3 possible bedrooms
- Bathrooms: 2 full bathrooms
- Heating & cooling: Electric heating; Central air; Ceiling fans
- Interior features: Eat-in kitchen; Breakfast bar; Master bedroom with 3/4 bathroom
- Laundry & utility: Septic tank (sewer)
Neighborhood map
What this means for you Summary
Snapshot
- This is a 2-bed/2.0-bath manufactured listed at $60k. Condition is rated good.
Deal economics
- At list price, monthly cash flow is $836 ($10k/yr) — positive.
- The deal already cash-flows at list — no discount required.
- Meets the 1% rule at list price ($2k rent vs $60k).
- Recommended offer: $56k (6.0% below list) — sets the bar for market timing.
- Cap rate 23.0% vs local median 3.5% in Glendale — top-decile yield for the area; either an underpriced asset or a hidden risk that comps aren't pricing in. Stress-test before assuming the spread holds.
Location & tenants
- Location reads 76/100 on livability (#12 in AZ, #3,235 nationally) — a middle-class / working-renter tenant base. Strengths: commute A+, housing A+, amenities B; Watch: health & safety D+, crime F.
- Agua Fria Union High School District (4289) (suburban): math 24% / reading 37% proficiency, ranked #99 of 249 in AZ (top 40%) — families likely to look elsewhere, expect single-tenant / working-renter base with shorter leases.
- Zoned schools: Agua Fria High School (math 15% / reading 26%, grade F, #222 of 381 statewide, top 59%, 1,652 students, 62% FRL).
- Market conditions: Rents soft (-2.8%/yr); 119 active listings in the ZIP; 5 comparable units currently listed for rent nearby; rentals leasing fast (median 3d on market — plan ~1-2 weeks tenant-placement turnaround); solid renter incomes; 36,011 units permitted in Maricopa County in 2024 (12,801 in 5+ unit buildings).
Forward outlook
- Local home prices are declining (-3.0%/yr); year-one equity from $415 of loan paydown is wiped out by about $2k of value loss. Plan a longer hold.
- Maricopa County population projected at +38% by 2050 — long-run rental-demand tailwind backs the buy-and-hold thesis.
- At projected returns (-3.0% appreciation + 0.0% rent growth), your $17k cash investment doubles in ~2 years — after that, you're playing with house money.
Negotiation context
- It's been on market 84 days — a 6% lower offer ($56k) is reasonable based on typical stale-listing flexibility.
Risks & watch-outs
- Climate carrying-cost: extreme-heat days projected 7→19/yr by 2055 (HVAC capex compounding) — expect insurance premiums to compound above CPI over the hold.
Questions for the listing agent
- It's been on market 84 days. Have you received any prior offers? Is the seller open to a 6% concession, seller financing, or rate buy-down credit?
- Why hasn't it sold? Are there any deal-killer items the seller is aware of (foundation, flood, title, zoning, code violations)?
- Is there a deadline driving the sale (1031 exchange, divorce, estate, relocation)? That informs how much negotiation room exists.
- Crime grade is F in this area — have there been break-ins, vandalism, or insurance claims at this property in the last 3 years? What carrier currently insures it and at what premium?
- What's the average days-on-market for RENTAL listings here right now (not sales)? A rising rental-DOM trend means longer vacancies and softer asking-rent achievability than the comps imply.
- What's the recent tenant-quality profile in this submarket — average credit score on applications, eviction rate, late-payment / NSF rate, and stable-employment percentage? A property-management company in the area should have these aggregated.
- How much new for-sale + rental construction is in the pipeline within 1–3 miles? Heavy new supply typically softens prices + rents 12–24 months out; constrained supply supports both.
Investment metrics
- 1% rule
- 2.64% ✓
- Cap rate
- 23.01%
- Cash-on-cash
- 59.69%
- DSCR
- 3.66
- GRM
- 3.2
CMA / ARV
No comps found within radius.
Projected returns pro-forma
-3.0% appreciation · 0.0% rent growth · sell at horizon
- IRR
- 55.0%
- Equity multiple
- 3.31×
- Total profit
- $38,886
- Equity at exit
- $8,946
- IRR
- 58.9%
- Equity multiple
- 6.03×
- Total profit
- $84,566
- Equity at exit
- $5,188
Cash invested: $16,800 (down + closing). Projections, not guarantees.
Landlord ↔ Tenant lean methodology
- Overall (STATE)
- 87 Strongly Landlord-Friendly
- State Arizona
- 87 Strongly Landlord-Friendly · R+3
- County
- — inherits STATE
- City
- — inherits STATE
ZIP-level market 85305
- Home prices YoY
- -29.0%
- Rents YoY
- -2.8%
- Active inventory
- 119
- Price-to-rent
- 3.2×
Monthly cashflow live
- Estimated rent
- $1,583 high interval (Pro) →
- Mortgage (P&I)
- −$315
- Tax est. 1.5%
- −$75 /mo · $900/yr
- Insurance
- −$25
- HOA
- −$0
- Vacancy / Maint / Mgmt
- −$332
- Net cashflow
- $836
Break-even live
UW: 25.0% down · 7.5% · 30yr · 1.5% tax · 5.0% vac · 8.0% maint · 8.0% mgmt
Financing live
Cash to close
- Down payment
- $15,000
- Closing costs
- $1,800
- Reserves months
- —
- Total cash needed
- —
Loan-product check · same deal, 3 products live
Conventional
25% down · 7.5% · 30yr
- Down + closing
- —
- Monthly P&I
- —
- Monthly cashflow
- —
- DSCR
- —
- Eligible?
- —
Personal DTI + credit; lowest rate.
DSCR
20% down · 8.5% · 30yr
- Down + closing
- —
- Monthly P&I
- —
- Monthly cashflow
- —
- DSCR
- —
- Eligible?
- —
No personal income docs; deal must DSCR.
Hard money
10% down · 12.0% · 12mo
- Down + closing
- —
- Monthly P&I
- —
- Monthly cashflow
- —
- DSCR
- —
- Eligible?
- —
Short-term bridge; refi at stabilization.
Rent comps 5 comps
| Address | Beds | Baths | Sqft | Rent | $/sqft | DOM | Units | Dist |
|---|---|---|---|---|---|---|---|---|
| 6706 N Dysart Rd Glendale, AZ | 1.0–2.0 | 1.0–2.0 | 727 | $1,439 | $1.98 | 1d | 42 | 0.56mi |
| 12303 W Vista Ave Glendale, AZ | 1.0 | 1.0 | 700 | $1,600 | $2.29 | 43d | 1 | 0.91mi |
| 13621 W Glendale Ave Glendale, AZ | 2.0–3.0 | 1.0–2.0 | 1279 | $1,195 | $0.93 | 1d | 13 | 1.11mi |
| 13444 W Rhine Ln Litchfield Park, AZ | 3.0 | 2.0 | 1323 | $1,699 | $1.28 | 16d | 1 | 1.11mi |
| 13826 W Keim Dr Litchfield Park, AZ | 3.0 | 2.0 | 1306 | $2,050 | $1.57 | 2d | 1 | 1.46mi |
Listing history 15 events
-
2026-06-18days on market $60,000 Active 84 DOM
-
2026-06-17days on market $60,000 Active 83 DOM
-
2026-06-16days on market $60,000 Active 82 DOM
-
2026-06-15days on market $60,000 Active 81 DOM
-
2026-06-13days on market $60,000 Active 79 DOM
-
2026-06-09days on market $60,000 Active 75 DOM
-
2026-06-08days on market $60,000 Active 74 DOM
-
2026-06-07days on market $60,000 Active 73 DOM
-
2026-06-04days on market $60,000 Active 70 DOM
-
2026-06-03days on market $60,000 Active 69 DOM
-
2026-06-02days on market $60,000 Active 68 DOM
-
2026-06-01days on market $60,000 Active 67 DOM
-
2026-05-31days on market $60,000 Active 66 DOM
-
2026-05-12price $60,000
-
2026-03-25$65,000 Active
ⓘ Source: listings_history table (triggers on properties + properties_extension) + one-shot
backfill from property_details.listing_events for pre-trigger history.
Climate risk First Street
- Flood 1/10 Low FEMA zone X (shaded) · 0% chance over 30 yrs
- Wildfire 4/10 Moderate
- Heat 9/10 Extreme 7 d/yr ≥113°F today · 19 d/yr by 30 yrs out
- Wind 1/10 Low
- Air quality 1/10 Low 0 unhealthy d/yr today · 0 by 30 yrs out
Nearby sold comps map
Loading sold comps map…
Walkable amenities ~0.75 mi
Loading nearby amenities…
Taxation est. · year 1
- Rental income
- $18,992
- − Mortgage interest
- −$3,361
- − Property taxes
- −$900
- − Insurance
- −$300
- − Repairs & maintenance
- −$1,519
- − Management
- −$1,519
- − Depreciation
- −$1,745
- Taxable income
- $9,647
- Est. tax owed @ 24.0%
- −$2,315
- After-tax cash flow
- $7,712/yr
For passive investors: Depreciation is non-cash, so a rental often shows a tax loss while cash-flowing — sheltering income. Rental losses are passive: they offset passive income freely, and up to $25,000/yr can offset ordinary (W-2) income if you actively participate and your MAGI is under $100k (phasing out to $0 by $150k); unused losses carry forward. On sale, claimed depreciation is recaptured at up to 25%, and gains may owe capital-gains tax (a 1031 exchange can defer both). Figures are a year-1 estimate at your 24.0% rate — not tax advice; consult a CPA.
Condition & rehab AI · 13 photos
This mobile home is in good condition with a good condition score of 75. It has a cosmetic rehab level and requires minor maintenance and repairs. The highest-ROI updates would be painting the exterior walls and cleaning the pool area to enhance curb appeal and resale value.
Value-add opportunities
- Both Paint the exterior walls — Enhances curb appeal and resale value.
- Both Clean the pool area — Improves the overall appearance and appeal of the property, making it more attractive for both resale and rental.
Renovation cost estimate screening
Value-add ROI direction
- Both Paint the exterior walls — Enhances curb appeal and resale value. ↑
- Both Clean the pool area — Improves the overall appearance and appeal of the property, making it more attractive for both resale and rental. ↑
ⓘ Cost ranges are severity-bucket heuristics (US national rule-of-thumb). Get contractor quotes + a written scope before underwriting a rehab budget.
Schools (NCES district)
- District
- Agua Fria Union High School District (4289)
- NCES district ID
- 0400450
- Math proficiency
- 24% ▼ -32.00%
- Reading proficiency
- 37% ▼ -12.00%
- Median HH income
- $64,107
- Composite
- 27.92/100
- National rank
- #6865
- State rank
- #99 of 249 in AZ
Livability — Glendale
- Score
- 76/100
- State rank
- #12
- US rank
- #3235
Category grades
Schools grade is shown separately in the Schools card above.
Census & demographics
- County
- Maricopa County · 4,537,380 people
- City population
- 294,586
- Metro
- Phoenix-Mesa-Chandler, AZ
- Population (ZIP)
- 18,043
- Household income
- $88,167
- Rent vs Own
- Severe rent burden
- 832.0
Population outlook (Maricopa County) Hauer SSP2
- Today (2025)
- 4,979,203 people
- By 2030
- 5,378,229 · +8.0%
- By 2040
- 6,156,598 · +23.6%
- By 2050
- 6,872,376 · +38.0%
- By 2075
- 8,401,270 · +68.7%
- By 2100
- 9,247,439 · +85.7%
Race, ethnicity, and origin ACS 2023
- Neighborhood character
- Diverse neighborhood (Simpson 0.67)
- Race & ethnicity
- Hispanic / Latino 47% White 31% Two or more races 23% Black 10% Asian 6% Native American 2%
- Hispanic origin (detail)
- Mexican 39% Cuban 1% Dominican 2%
- Common ancestry
- Lithuanian 1% Portuguese 1% Slovak 1%
- Foreign-born
- 19% · Canada, Vietnam
- Languages at home
- 58% English-only · Spanish 32% Other Indo-European 2% French/Haitian/Cajun 1%
Political lean MEDSL · Maricopa
- 2024 margin
- Toss-up / Even · D 47.7% · R 51.2% · Other 1.1%
- 2008→2024 swing
- +7.1pp toward D · 2008: -10.6pp · 2024: -3.5pp
- All cycles
- 2024: R+3.5 2020: D+2.2 2016: R+3.5 2012: R+12.0 2008: R+10.6
Not yet ingested
- Civics
- —
Market trends
- HPI YoY
- ▼ -114.07%
- Current HPI
- 278.8051
- Rent YoY
- ▼ -2.78%
- Metro
- Phoenix-Mesa-Chandler, AZ
- State GDP YoY
- ▲ 4.54%
- F500 in state
- 20
Industry mix (Fortune 500 HQ in AZ)
| Industry | F500 HQs | Revenue |
|---|---|---|
| Technology | 2 | $13B |
|
||
| Mining / Metals | 1 | $23B |
|
||
| Environmental Services | 1 | $16B |
|
||
| Metals / Steel | 1 | $14B |
|
||
| Technology Distribution | 1 | $9B |
|
||
| Homebuilding | 1 | $8B |
|
||
Price history
-7.7% since first listed2 events — show timeline
- 2026-05-12 Price Changed $60,000 ARMLS
- 2026-03-25 Listed $65,000 ARMLS
Cash-flow waterfall
monthlySold comps — $/sqft
last 12 mo · ≤1 miLoading sold comps…