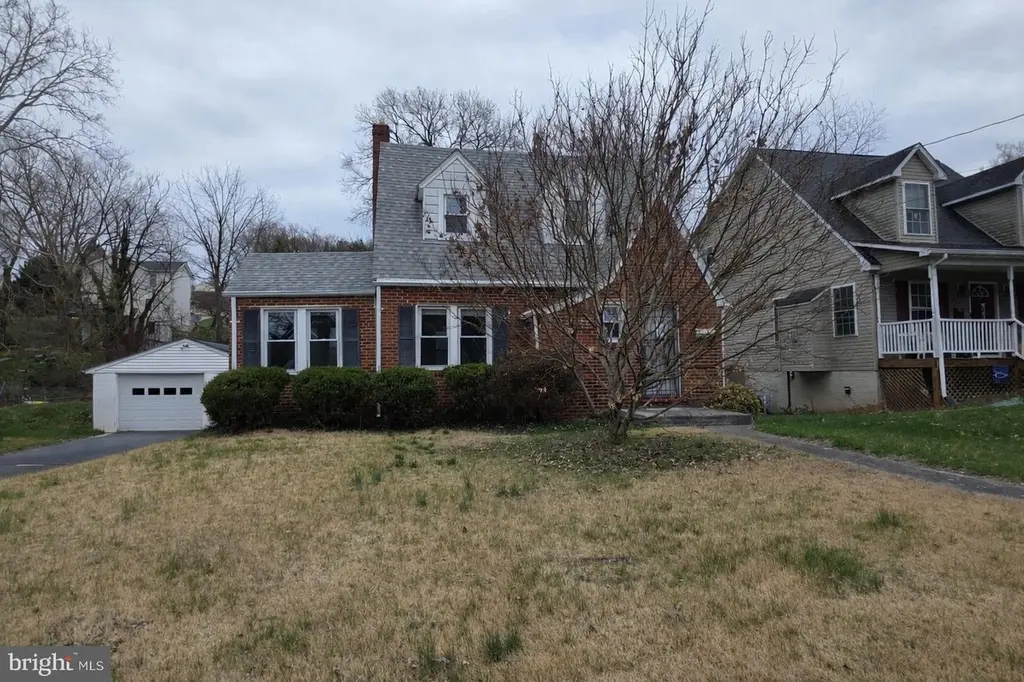
411 Kerfoot Ave · Front Royal, VA
Flood risk 1/10 · Minimal
- FEMA flood zone
- X (unshaded)
- Chance of flooding over 30 yrs
- 0.0%
- Est. flood insurance / yr
- $473 – $860
Fire risk 2/10 · Minimal
- Est. fire insurance / yr
- $666 – $1,236
Heat risk 6/10 · Moderate
- Hot days now (above 102°F)
- 7 days/yr
- Hot days in 30 yrs
- 16 days/yr
Wind risk 2/10 · Minimal
- Chance of severe wind over 30 yrs
- 2.0%
Air-quality risk 2/10 · Minimal
- Unhealthy air days now
- 0 days/yr
- Unhealthy air days in 30 yrs
- 1 days/yr
Risk factors via First Street. Map © Google.
Why this score? — see what drove the D grade
The composite is a weighted blend of 9 inputs, each scored 0–100. Each bar is that input's sub-score; the figure is the points it added to the 100-point composite (weight × sub-score).
- ARV discount +12.6/15.0
- Cash flow +10.4/30.0
- Schools +4.9/10.0
- Rent growth +4.6/5.0
- Livability +3.7/5.0
- DSCR +3.0/10.0
- Condition / age +2.5/5.0
- 1% rule +2.0/10.0
- Appreciation +0.0/10.0
$282,000
🖨 Deal sheet (PDF) 📄 Offer letter ✓ Due diligence
Listing remarks MLS
This delightful Cape Cod home exudes warmth and character. Built in 1950, it offers a perfect blend of classic architecture and modern comfort. With 1,322 sq. ft. of thoughtfully designed living space, this 2-bedroom, 2-bathroom residence is ideal for those seeking a cozy retreat. Step inside to discover a welcoming interior that invites relaxation. The spacious layout features a rear entrance leading to a versatile basement, perfect for storage or a creative workspace. Enjoy the convenience of a detached garage with space for two vehicles, ensuring easy access and ample parking. Set on a generous 0.26-acre lot, the outdoor space provides endless possibilities for gardening, entertaining, or simply unwinding in the fresh air.
Key facts
- Versatile basement
- Cape cod home
- Classic architecture
Tags
Neighborhood map
What this means for you Summary
Snapshot
- This is a 2-bed/2.0-bath single-family listed at $282k.
Deal economics
- At list price, monthly cash flow is $-151 ($-2k/yr) — negative.
- To cash-flow at today's rent, offer at most $255k (9.5% below list).
- To meet the 1% rule (rent ≥ 1% of price), the offer needs to be $198k (29.8% below list).
- Recommended offer: $198k (29.8% below list) — sets the bar for 1% rule.
- Cap rate 5.6% vs local median 3.1% in Front Royal — top-decile yield for the area; either an underpriced asset or a hidden risk that comps aren't pricing in. Stress-test before assuming the spread holds.
Location & tenants
- Location reads 73/100 on livability (#162 in VA) — a middle-class / working-renter tenant base. Strengths: health & safety A+, housing A, cost of living B+; Watch: commute F, employment D-.
- Warren County Public School District (town): math 49% / reading 64% proficiency, ranked #70 of 131 in VA (top 53%) — acceptable for families but not a draw, mixed tenant base, ~2y average lease.
- Zoned schools: Ressie Jeffries Elementary (math 56% / reading 64%, grade B-, #533 of 1,108 statewide, top 48%, 639 students, 66% FRL); Skyline High (math 36% / reading 77%, grade C, #270 of 319 statewide, top 86%, 893 students, 66% FRL) — zoned schools average 66% FRL vs 34% district-wide (32 pts higher); higher-poverty schools than district average — tighter screening recommended.
- Market conditions: Rents rising fast (+8.3%/yr); 283 active listings in the ZIP; 9 comparable units currently listed for rent nearby; rentals at typical pace (median 22d on market — plan ~3-4 weeks tenant-placement turnaround); solid renter incomes; 170 units permitted in Warren County in 2024 (0 in 5+ unit buildings).
Forward outlook
- Local home prices are declining (-3.0%/yr); year-one equity from $2k of loan paydown is wiped out by about $8k of value loss. Plan a longer hold.
- Warren County population projected at +8% by 2050 — modest demand growth; plan on rents tracking national, not racing it.
Negotiation context
- It's been on market 72 days — a 6% lower offer ($265k) is reasonable based on typical stale-listing flexibility.
- 2 sale attempts with the ask held roughly flat each time — persistent listings suggest the price (not the market) is what's stuck; bring a comps-based counter.
Risks & watch-outs
- Watch-outs: built in 1950 — expect roof / HVAC / electrical / plumbing capex.
- Climate carrying-cost: extreme-heat days projected 7→16/yr by 2055 (HVAC capex compounding) — expect insurance premiums to compound above CPI over the hold.
Questions for the listing agent
- What do current leases actually rent for vs. the listed asking? Can we see a recent rent roll and the last 12 months of T-12 income?
- It's been on market 72 days. Have you received any prior offers? Is the seller open to a 30% concession, seller financing, or rate buy-down credit?
- Built in 1950 — when were the roof, HVAC, electrical panel, plumbing, and water heater last replaced?
- Why hasn't it sold? Are there any deal-killer items the seller is aware of (foundation, flood, title, zoning, code violations)?
- Is there a deadline driving the sale (1031 exchange, divorce, estate, relocation)? That informs how much negotiation room exists.
- Schools are B-rated — typically a magnet for longer-tenancy family renters. What's the average tenant stay here, and is there a school-zone premium baked into asking?
- The area grade is low — what's the realistic commute time and amenity access for the typical tenant pool here? Any planned neighborhood developments (good or bad) we should know about?
- What's the average days-on-market for RENTAL listings here right now (not sales)? A rising rental-DOM trend means longer vacancies and softer asking-rent achievability than the comps imply.
- What's the recent tenant-quality profile in this submarket — average credit score on applications, eviction rate, late-payment / NSF rate, and stable-employment percentage? A property-management company in the area should have these aggregated.
- How much new for-sale + rental construction is in the pipeline within 1–3 miles? Heavy new supply typically softens prices + rents 12–24 months out; constrained supply supports both.
Investment metrics
- 1% rule
- 0.70% ✗
- Cap rate
- 5.65%
- Cash-on-cash
- -2.30%
- DSCR
- 0.90
- GRM
- 11.9
CMA / ARV
- ARV (median comp)
- $317,694
- List price
- $282,000
- Delta
- -11.24%
- Verdict
- UNDERPRICED
- Comps
- 20 within 1.0 mi
Show comp detail 6 sales within ~0.75 mi
| Address | Dist | Beds/Ba | Sqft | Sold | Price | $/sf | Match |
|---|---|---|---|---|---|---|---|
| 334 Brown Ave | 0.10mi | 3/2.0 (+1) | 1,428 (+8%) | 9mo | $370,000 | $259 | 70 |
| 308 W Main St | 0.44mi | 3/1.5 (+1) | 1,344 (+2%) | 4mo | $315,000 | $234 | 66 |
| 203 Short St | 0.75mi | 2/1.5 | 1,306 (-1%) | 16mo | $280,000 | $214 | 48 |
| 250 Rivermont Acres Rd | 0.50mi | 3/2.0 (+1) | 1,248 (-6%) | 20mo | $615,400 | $493 | 46 |
| 107 Scott St | 0.73mi | 3/2.5 (+1) | 1,400 (+6%) | 9mo | $389,900 | $279 | 42 |
| 314 Pine St | 0.68mi | 3/1.5 (+1) | 1,132 (-14%) | 18mo | $265,000 | $234 | 22 |
Match score weights: distance 35% · size 25% · config 20% · recency 20%. Top-matched comps best support the ARV.
Projected returns pro-forma
-3.0% appreciation · 8.0% rent growth · sell at horizon
- IRR
- -15.4%
- Equity multiple
- 0.43×
- Total profit
- $-44,979
- Equity at exit
- $42,047
- IRR
- -0.7%
- Equity multiple
- 0.94×
- Total profit
- $-4,398
- Equity at exit
- $24,382
Cash invested: $78,960 (down + closing). Projections, not guarantees.
Landlord ↔ Tenant lean methodology
- Overall (STATE)
- 55 Moderately Landlord-Leaning
- State Virginia
- 55 Moderately Landlord-Leaning · D+2
- County
- — inherits STATE
- City
- — inherits STATE
ZIP-level market 22630
- Home prices YoY
- -27.1%
- Rents YoY
- 8.3%
- Active inventory
- 283
- Price-to-rent
- 11.9×
Monthly cashflow live
- Estimated rent
- $1,980 high interval (Pro) →
- Mortgage (P&I)
- −$1,479
- Tax from tax record
- −$120 /mo · $1,435/yr
- Insurance
- −$118
- HOA
- −$0
- Vacancy / Maint / Mgmt
- −$416
- Net cashflow
- $-151
Break-even live
Sensitivity live
| Price | -10% $8 | -5% $-71 | +0% $-151 | +5% $-231 | +10% $-311 |
|---|---|---|---|---|---|
| Rent | -10% $-308 | -5% $-230 | +0% $-151 | +5% $-73 | +10% $5 |
| Rate | -1.0pp $-9 | -0.5pp $-80 | base $-151 | +0.5pp $-224 | +1.0pp $-299 |
UW: 25.0% down · 7.5% · 30yr · 1.5% tax · 5.0% vac · 8.0% maint · 8.0% mgmt
Financing live
Cash to close
- Down payment
- $70,500
- Closing costs
- $8,460
- Reserves months
- —
- Total cash needed
- —
Loan-product check · same deal, 3 products live
Conventional
25% down · 7.5% · 30yr
- Down + closing
- —
- Monthly P&I
- —
- Monthly cashflow
- —
- DSCR
- —
- Eligible?
- —
Personal DTI + credit; lowest rate.
DSCR
20% down · 8.5% · 30yr
- Down + closing
- —
- Monthly P&I
- —
- Monthly cashflow
- —
- DSCR
- —
- Eligible?
- —
No personal income docs; deal must DSCR.
Hard money
10% down · 12.0% · 12mo
- Down + closing
- —
- Monthly P&I
- —
- Monthly cashflow
- —
- DSCR
- —
- Eligible?
- —
Short-term bridge; refi at stabilization.
Rent comps 9 comps
| Address | Beds | Baths | Sqft | Rent | $/sqft | DOM | Units | Dist |
|---|---|---|---|---|---|---|---|---|
| 228 Cloud St Unit UPPER Front Royal, VA | 2.0 | 1.0 | 884 | $1,200 | $1.36 | 22d | 1 | 0.78mi |
| 291 Acton St Front Royal, VA | 3.0 | 2.5 | 1560 | $2,500 | $1.60 | 0d | 1 | 0.80mi |
| 436 Acton St Front Royal, VA | 3.0 | 1.0 | 1198 | $1,850 | $1.54 | 18d | 1 | 0.82mi |
| 310 Frazer Pl Front Royal, VA | 2.0 | 2.0 | 1104 | $2,000 | $1.81 | 45d | 1 | 0.92mi |
| 221 Fletcher St #2 Front Royal, VA | 3.0 | 1.0 | 980 | $1,440 | $1.47 | 7d | 1 | 0.93mi |
| 352 W 11th St Front Royal, VA | 2.0 | 2.5 | 1560 | $2,600 | $1.67 | 45d | 1 | 1.10mi |
| 350 W 11th St Front Royal, VA | 3.0 | 2.5 | 1560 | $2,600 | $1.67 | 45d | 1 | 1.10mi |
| 1127 N Royal Ave Unit B Front Royal, VA | 2.0 | 2.0 | 900 | $1,500 | $1.67 | 26d | 1 | 1.31mi |
| 1127 N Royal Ave Unit B Front Royal, VA | 2.0 | 2.0 | 900 | $1,500 | $1.67 | 13d | 1 | 1.31mi |
Listing history 17 events
-
2026-06-21days on market $282,000 Active 72 DOM
-
2026-06-18days on market $282,000 Active 69 DOM
-
2026-06-17days on market $282,000 Active 68 DOM
-
2026-06-16days on market $282,000 Active 67 DOM
-
2026-06-15days on market $282,000 Active 66 DOM
-
2026-06-13days on market $282,000 Active 64 DOM
-
2026-06-09days on market $282,000 Active 60 DOM
-
2026-06-08days on market $282,000 Active 59 DOM
-
2026-06-07days on market $282,000 Active 58 DOM
-
2026-06-04days on market $282,000 Active 55 DOM
-
2026-06-03days on market $282,000 Active 54 DOM
-
2026-06-02days on market $282,000 Active 53 DOM
-
2026-06-01days on market $282,000 Active 52 DOM
-
2026-05-31days on market $282,000 Active 51 DOM
-
2026-05-14status Active 735-char remark
Show marketing remark (735 chars)
This delightful Cape Cod home exudes warmth and character. Built in 1950, it offers a perfect blend of classic architecture and modern comfort. With 1,322 sq. ft. of thoughtfully designed living space, this 2-bedroom, 2-bathroom residence is ideal for those seeking a cozy retreat. Step inside to discover a welcoming interior that invites relaxation. The spacious layout features a rear entrance leading to a versatile basement, perfect for storage or a creative workspace. Enjoy the convenience of a detached garage with space for two vehicles, ensuring easy access and ample parking. Set on a generous 0.26-acre lot, the outdoor space provides endless possibilities for gardening, entertaining, or simply unwinding in the fresh air.
-
2026-04-27status Pending 735-char remark
Show marketing remark (735 chars)
This delightful Cape Cod home exudes warmth and character. Built in 1950, it offers a perfect blend of classic architecture and modern comfort. With 1,322 sq. ft. of thoughtfully designed living space, this 2-bedroom, 2-bathroom residence is ideal for those seeking a cozy retreat. Step inside to discover a welcoming interior that invites relaxation. The spacious layout features a rear entrance leading to a versatile basement, perfect for storage or a creative workspace. Enjoy the convenience of a detached garage with space for two vehicles, ensuring easy access and ample parking. Set on a generous 0.26-acre lot, the outdoor space provides endless possibilities for gardening, entertaining, or simply unwinding in the fresh air.
-
2026-03-24$282,000 Active 735-char remark
Show marketing remark (735 chars)
This delightful Cape Cod home exudes warmth and character. Built in 1950, it offers a perfect blend of classic architecture and modern comfort. With 1,322 sq. ft. of thoughtfully designed living space, this 2-bedroom, 2-bathroom residence is ideal for those seeking a cozy retreat. Step inside to discover a welcoming interior that invites relaxation. The spacious layout features a rear entrance leading to a versatile basement, perfect for storage or a creative workspace. Enjoy the convenience of a detached garage with space for two vehicles, ensuring easy access and ample parking. Set on a generous 0.26-acre lot, the outdoor space provides endless possibilities for gardening, entertaining, or simply unwinding in the fresh air.
ⓘ Source: listings_history table (triggers on properties + properties_extension) + one-shot
backfill from property_details.listing_events for pre-trigger history.
Tax reassessment forecast VA · Resets to sale price
- Current annual tax
- $1,435 · $120/mo
- Projected year-2 tax
- $2,312 · $193/mo
- Expected delta
- +$878/yr (+$73/mo · 61.2%)
ⓘ Screening estimate from a state-policy table — verify with the county assessor before closing.
Climate risk First Street
- Flood 1/10 Low FEMA zone X (unshaded) · 0% chance over 30 yrs
- Wildfire 2/10 Low
- Heat 6/10 Major 7 d/yr ≥102°F today · 16 d/yr by 30 yrs out
- Wind 2/10 Low 2% chance of damaging wind over 30 yrs
- Air quality 2/10 Low 0 unhealthy d/yr today · 1 by 30 yrs out
Nearby sold comps map
Loading sold comps map…
Walkable amenities ~0.75 mi
Loading nearby amenities…
Taxation est. · year 1
- Rental income
- $23,766
- − Mortgage interest
- −$15,796
- − Property taxes
- −$1,435
- − Insurance
- −$1,410
- − Repairs & maintenance
- −$1,901
- − Management
- −$1,901
- − Depreciation
- −$8,204
- Taxable loss
- −$6,881
- Est. tax savings @ 24.0%
- +$1,651
- After-tax cash flow
- $-164/yr
For passive investors: Depreciation is non-cash, so a rental often shows a tax loss while cash-flowing — sheltering income. Rental losses are passive: they offset passive income freely, and up to $25,000/yr can offset ordinary (W-2) income if you actively participate and your MAGI is under $100k (phasing out to $0 by $150k); unused losses carry forward. On sale, claimed depreciation is recaptured at up to 25%, and gains may owe capital-gains tax (a 1031 exchange can defer both). Figures are a year-1 estimate at your 24.0% rate — not tax advice; consult a CPA.
Schools (NCES district)
- District
- Warren County Public School District
- NCES district ID
- 5103870
- Math proficiency
- 49% ▼ -29.00%
- Reading proficiency
- 64% ▼ -10.00%
- Median HH income
- $61,504
- Composite
- 49.22/100
- National rank
- #2039
- State rank
- #70 of 131 in VA
Livability — Front Royal
- Score
- 73/100
- State rank
- #162
- US rank
- #5050
Category grades
Schools grade is shown separately in the Schools card above.
Census & demographics
- Census place
- Front Royal, VA
- County
- Warren County · 35,615 people
- City population
- 35,615
- Metro
- Washington-Arlington-Alexandria, DC-VA-MD-WV
- Population (ZIP)
- 35,615
- Household income
- $84,631
- Rent vs Own
- Severe rent burden
- 460.0
Population outlook (Warren County) Hauer SSP2
- Today (2025)
- 42,045 people
- By 2030
- 43,257 · +2.9%
- By 2040
- 45,088 · +7.2%
- By 2050
- 45,567 · +8.4%
- By 2075
- 46,081 · +9.6%
- By 2100
- 42,093 · +0.1%
Race, ethnicity, and origin ACS 2023
- Neighborhood character
- Predominantly White (81%)
- Race & ethnicity
- White 81% Hispanic / Latino 7% Black 6% Two or more races 5% Asian 2%
- Hispanic origin (detail)
- Mexican 1%
- Common ancestry
- Slovak 3% Lithuanian 2% Romanian 2%
- Foreign-born
- 6% · Canada
- Languages at home
- 92% English-only · Spanish 5% Other Indo-European 1%
Political lean MEDSL · Warren
- 2024 margin
- Solid R (+37.6) · D 30.6% · R 68.3% · Other 1.1%
- 2008→2024 swing
- -26.0pp toward R · 2008: -11.7pp · 2024: -37.6pp
- All cycles
- 2024: R+37.6 2020: R+35.3 2016: R+37.1 2012: R+20.5 2008: R+11.7
Not yet ingested
- Civics
- —
Market trends
- HPI YoY
- ▼ -118.82%
- Current HPI
- 319.8136
- Rent YoY
- ▲ 8.30%
- Metro
- Washington-Arlington-Alexandria, DC-VA-MD-WV
- State GDP YoY
- ▲ 2.40%
- F500 in state
- 50
Industry mix (Fortune 500 HQ in VA)
| Industry | F500 HQs | Revenue |
|---|---|---|
| Aerospace / Defense | 4 | $236B |
|
||
| Technology / Defense | 3 | $32B |
|
||
| Financial Services | 2 | $176B |
|
||
| Utilities | 2 | $27B |
|
||
| Insurance | 2 | $25B |
|
||
| Technology | 2 | $15B |
|
||
Price history
3 events — show timeline
- 2026-05-14 Relisted — BRIGHT MLS
- 2026-04-27 Pending — BRIGHT MLS
- 2026-03-24 Listed $282,000 BRIGHT MLS
Property tax history
+5.8%/yrLatest (2025): $1,435 · +22.5% YoY. Source: county tax records.
Cash-flow waterfall
monthlySold comps — $/sqft
last 12 mo · ≤1 miLoading sold comps…