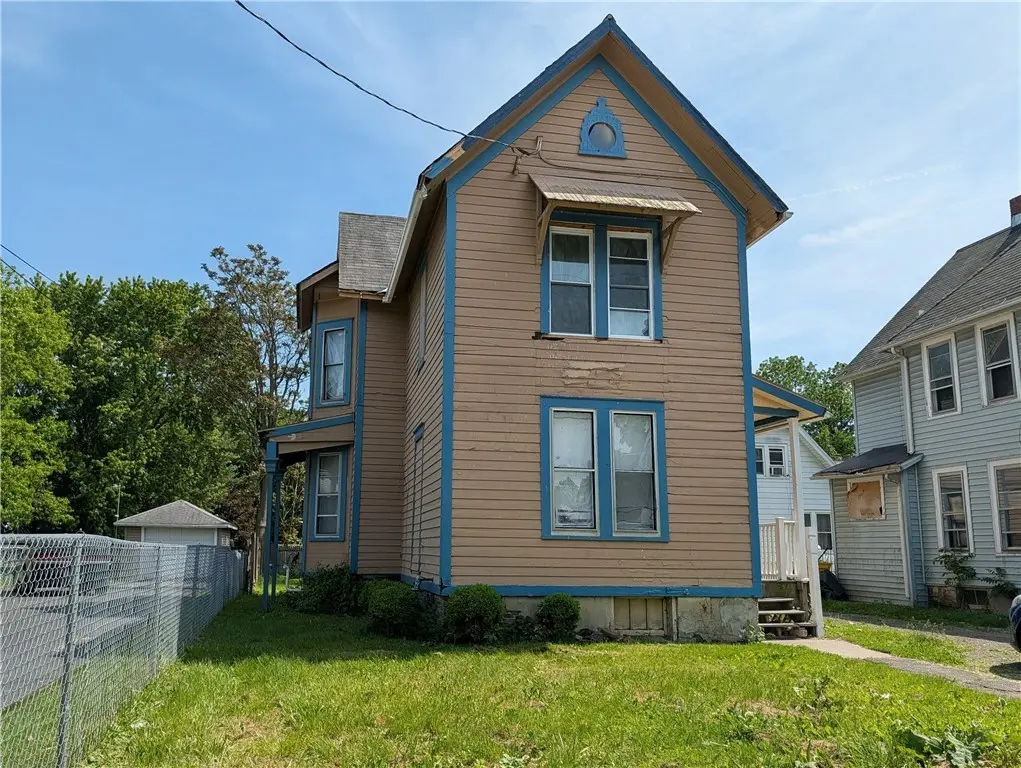
223 Mount Zoar St · Elmira, NY
Flood risk 5/10 · Moderate
- FEMA flood zone
- X (shaded)
- Chance of flooding over 30 yrs
- 0.51%
- Est. flood insurance / yr
- $473 – $860
Fire risk 2/10 · Minimal
- Est. fire insurance / yr
- $691 – $1,283
Heat risk 3/10 · Minor
- Hot days now (above 96°F)
- 7 days/yr
- Hot days in 30 yrs
- 16 days/yr
Wind risk 1/10 · Minimal
- Chance of severe wind over 30 yrs
- 1.0%
Air-quality risk 1/10 · Minimal
- Unhealthy air days now
- 0 days/yr
- Unhealthy air days in 30 yrs
- 0 days/yr
Risk factors via First Street. Map © Google.
Why this score? — see what drove the B+ grade
The composite is a weighted blend of 9 inputs, each scored 0–100. Each bar is that input's sub-score; the figure is the points it added to the 100-point composite (weight × sub-score).
- Cash flow +30.0/30.0
- ARV discount +15.0/15.0
- 1% rule +10.0/10.0
- DSCR +10.0/10.0
- Livability +3.1/5.0
- Rent growth +2.5/5.0
- Condition / age +2.5/5.0
- Schools +2.4/10.0
- Appreciation +0.0/10.0
$65,000
🖨 Deal sheet 📄 Offer letter ✓ Due diligence
Listing remarks MLS
Large single family home previously used as a rental. With some TLC this could be a great income property or primary residence. Square footage is per real-info.
Key facts
- Fully functional
- Brand new furnace
- Added insulation
Tags
Property features AI
Exterior
- Parking: No garage
- Utilities: Public water connected; Sewer connected
- Home design: 2-story house; Existing/resale property
- Construction: Wood siding; Poured foundation
- Exterior features: Blacktop driveway; Rectangular lot (approx. 40 x 135)
Interior
- Kitchen: Free-standing range; Oven; Refrigerator
- Bedrooms: Total rooms: 10 (includes bedrooms and living spaces)
- Flooring: Carpet; Vinyl; Varies
- Bathrooms: 2 full bathrooms; 1 main-level bathroom
- Heating & cooling: Gas forced-air heating
- Interior features: Separate/formal living room; Separate/formal dining room; Full basement
- Laundry & utility: Gas water heater
Neighborhood map
What this means for you Summary
Snapshot
- This is a 4-bed/2.0-bath single-family listed at $65k.
Deal economics
- At list price, monthly cash flow is $458 ($5k/yr) — positive.
- The deal already cash-flows at list — no discount required.
- Meets the 1% rule at list price ($1k rent vs $65k).
- Cap rate 14.7% vs local median 10.1% in Elmira — top-decile yield for the area; either an underpriced asset or a hidden risk that comps aren't pricing in. Stress-test before assuming the spread holds.
Location & tenants
- Location reads 62/100 on livability (#832 in NY) — a middle-class / working-renter tenant base. Strengths: cost of living A+, housing A+, health & safety A+; Watch: schools F, crime F, amenities F.
- Elmira City School District (urban): math 23% / reading 35% proficiency, ranked #580 of 590 in NY (top 98%) — low school quality limits family demand, transient renter base, plan for 1-2y turnover.
- Market conditions: 101 active listings in the ZIP; 4 comparable units currently listed for rent nearby; rentals lingering (median 44d on market — plan ~5-8 weeks vacancy on turnover, expect pricing pressure); 100% of comp listings sitting > 30 days — soft ceiling on asking rent; 91 units permitted in Chemung County in 2024 (63 in 5+ unit buildings).
Forward outlook
- Local home prices are declining (-3.0%/yr); year-one equity from $449 of loan paydown is wiped out by about $2k of value loss. Plan a longer hold.
- Chemung County population projected at -17% by 2050 — secular population decline; favor cash flow + early exit over multi-decade hold.
- At projected returns (-3.0% appreciation + 3.0% rent growth), your $18k cash investment doubles in ~4 years — after that, you're playing with house money.
Negotiation context
- Only 12 days on market — expect competitive offers; lowballing is unlikely to land.
- 7 sale attempts since 21y ago with the ask held roughly flat each time — persistent listings suggest the price (not the market) is what's stuck; bring a comps-based counter.
- Current owner paid $30k; list at $65k implies a 117% gain — meaningful room to come down on a strong offer.
Risks & watch-outs
- Watch-outs: property tax is 4.1% of price; built in 1800 — expect roof / HVAC / electrical / plumbing capex.
- Climate carrying-cost: moderate flood risk — expect insurance premiums to compound above CPI over the hold.
Questions for the listing agent
- Built in 1800 — when were the roof, HVAC, electrical panel, plumbing, and water heater last replaced?
- Property tax is high relative to price — has the assessment been appealed recently, and will the sale trigger a re-assessment?
- Is there a deadline driving the sale (1031 exchange, divorce, estate, relocation)? That informs how much negotiation room exists.
- Schools are F-rated, which usually means shorter tenancies and higher turnover. Who's the typical renter profile here, and what's been the actual vacancy rate?
- Crime grade is F in this area — have there been break-ins, vandalism, or insurance claims at this property in the last 3 years? What carrier currently insures it and at what premium?
- What's the average days-on-market for RENTAL listings here right now (not sales)? A rising rental-DOM trend means longer vacancies and softer asking-rent achievability than the comps imply.
- What's the recent tenant-quality profile in this submarket — average credit score on applications, eviction rate, late-payment / NSF rate, and stable-employment percentage? A property-management company in the area should have these aggregated.
- How much new for-sale + rental construction is in the pipeline within 1–3 miles? Heavy new supply typically softens prices + rents 12–24 months out; constrained supply supports both.
Investment metrics
- 1% rule
- 2.04% ✓
- Cap rate
- 14.75%
- Cash-on-cash
- 30.20%
- DSCR
- 2.34
- GRM
- 4.1
CMA / ARV
- ARV (on-the-fly)
- $104,386
- Comps found
- 12
Show comp detail 12 sales within ~0.75 mi
| Address | Dist | Beds/Ba | Sqft | Sold | Price | $/sf | Match |
|---|---|---|---|---|---|---|---|
| 309 Broadway St | 0.19mi | 4/1.0 | 1,468 (-6%) | 3mo | $78,000 | $53 | 75 |
| 507 Partridge St | 0.37mi | 3/1.5 (-1) | 1,592 (+2%) | 3mo | $106,500 | $67 | 70 |
| 478 Mount Zoar St | 0.34mi | 4/1.0 | 1,456 (-6%) | 2mo | $35,000 | $24 | 68 |
| 421 Jefferson St | 0.27mi | 3/1.5 (-1) | 1,688 (+8%) | 5mo | $85,106 | $50 | 62 |
| 558 Coburn St | 0.43mi | 4/1.5 | 1,716 (+10%) | 0mo | $125,020 | $73 | 61 |
| 551 Lyon St | 0.57mi | 3/1.0 (-1) | 1,586 (+2%) | 3mo | $158,000 | $100 | 59 |
| 609 Chester St | 0.56mi | 3/1.5 (-1) | 1,618 (+4%) | 7mo | $110,000 | $68 | 55 |
| 631 Pennsylvania Ave | 0.45mi | 4/1.0 | 1,787 (+15%) | 2mo | $67,000 | $37 | 49 |
| 704 Maple Ave | 0.71mi | 3/1.0 (-1) | 1,674 (+7%) | 1mo | $69,000 | $41 | 45 |
| 461 W Hudson St | 0.40mi | 3/1.5 (-1) | 1,331 (-15%) | 6mo | $93,906 | $71 | 44 |
| 310 Sly St | 0.54mi | 3/1.5 (-1) | 1,359 (-13%) | 6mo | $75,000 | $55 | 41 |
| 626 Decker Ave | 0.66mi | 3/2.0 (-1) | 1,335 (-14%) | 2mo | $142,000 | $106 | 38 |
Match score weights: distance 35% · size 25% · config 20% · recency 20%. Top-matched comps best support the ARV.
Projected returns pro-forma
-3.0% appreciation · 3.0% rent growth · sell at horizon
- IRR
- 24.9%
- Equity multiple
- 2.03×
- Total profit
- $18,747
- Equity at exit
- $9,692
- IRR
- 32.7%
- Equity multiple
- 3.98×
- Total profit
- $54,322
- Equity at exit
- $5,620
Cash invested: $18,200 (down + closing). Projections, not guarantees.
Landlord ↔ Tenant lean methodology
- Overall (STATE)
- 15 Strongly Tenant-Friendly
- State New York
- 15 Strongly Tenant-Friendly · D+10
- County
- — inherits STATE
- City
- — inherits STATE
ZIP-level market 14904
- Home prices YoY
- -9.6%
- Active inventory
- 101
- Price-to-rent
- 4.1×
Monthly cashflow live
- Estimated rent
- $1,326 medium interval (Pro) →
- Mortgage (P&I)
- −$341
- Tax from tax record
- −$222 /mo · $2,663/yr
- Insurance
- −$27
- HOA
- −$0
- Vacancy / Maint / Mgmt
- −$279
- Net cashflow
- $458
Break-even live
UW: 25.0% down · 7.5% · 30yr · 1.5% tax · 5.0% vac · 8.0% maint · 8.0% mgmt
Financing live
Cash to close
- Down payment
- $16,250
- Closing costs
- $1,950
- Reserves months
- —
- Total cash needed
- —
Loan-product check · same deal, 3 products live
Conventional
25% down · 7.5% · 30yr
- Down + closing
- —
- Monthly P&I
- —
- Monthly cashflow
- —
- DSCR
- —
- Eligible?
- —
Personal DTI + credit; lowest rate.
DSCR
20% down · 8.5% · 30yr
- Down + closing
- —
- Monthly P&I
- —
- Monthly cashflow
- —
- DSCR
- —
- Eligible?
- —
No personal income docs; deal must DSCR.
Hard money
10% down · 12.0% · 12mo
- Down + closing
- —
- Monthly P&I
- —
- Monthly cashflow
- —
- DSCR
- —
- Eligible?
- —
Short-term bridge; refi at stabilization.
Rent comps 4 comps
| Address | Beds | Baths | Sqft | Rent | $/sqft | DOM | Units | Dist |
|---|---|---|---|---|---|---|---|---|
| 363 W Water St #2 Elmira, NY | 3.0 | 1.0 | 1084 | $1,250 | $1.15 | 44d | 1 | 0.59mi |
| 106 W 2nd St Unit A Elmira, NY | 3.0 | 1.0 | 1395 | $1,400 | $1.00 | 44d | 1 | 0.90mi |
| 514 W 1st St Unit A Elmira, NY | 4.0 | 1.0 | 1416 | $1,275 | $0.90 | 44d | 1 | 0.91mi |
| 355 W Clinton St Unit 1 Elmira, NY | 3.0 | 1.5 | 1650 | $1,400 | $0.85 | 44d | 1 | 1.02mi |
Listing history 10 events
-
2026-06-19days on market $65,000 Active 12 DOM
-
2026-06-18days on market $65,000 Active 11 DOM
-
2026-06-17days on market $65,000 Active 10 DOM
-
2026-06-16days on market $65,000 Active 9 DOM
-
2026-06-15days on market $65,000 Active 8 DOM
-
2026-06-14days on market $65,000 Active 6 DOM
-
2026-06-12days on market $65,000 Active 5 DOM
-
2026-06-09days on market $65,000 Active 2 DOM
-
2026-06-07remarks 496-char remark
-
2026-06-07$65,000 Active 1 DOM
ⓘ Source: listings_history table (triggers on properties + properties_extension) + one-shot
backfill from property_details.listing_events for pre-trigger history.
Tax reassessment forecast NY · Partial reset (capped growth)
- Current annual tax
- $2,663 · $222/mo
- Projected year-2 tax
- $2,663 · $222/mo
- Expected delta
- $0/yr ($0/mo · 0.0%)
ⓘ Screening estimate from a state-policy table — verify with the county assessor before closing.
Climate risk First Street
- Flood 5/10 Major FEMA zone X (shaded) · 51% chance over 30 yrs
- Wildfire 2/10 Low
- Heat 3/10 Moderate 7 d/yr ≥96°F today · 16 d/yr by 30 yrs out
- Wind 1/10 Low 100% chance of damaging wind over 30 yrs
- Air quality 1/10 Low 0 unhealthy d/yr today · 0 by 30 yrs out
Nearby sold comps map
Loading sold comps map…
Walkable amenities ~0.75 mi
Loading nearby amenities…
Taxation est. · year 1
- Rental income
- $15,918
- − Mortgage interest
- −$3,641
- − Property taxes
- −$2,663
- − Insurance
- −$325
- − Repairs & maintenance
- −$1,273
- − Management
- −$1,273
- − Depreciation
- −$1,891
- Taxable income
- $4,851
- Est. tax owed @ 24.0%
- −$1,164
- After-tax cash flow
- $4,332/yr
For passive investors: Depreciation is non-cash, so a rental often shows a tax loss while cash-flowing — sheltering income. Rental losses are passive: they offset passive income freely, and up to $25,000/yr can offset ordinary (W-2) income if you actively participate and your MAGI is under $100k (phasing out to $0 by $150k); unused losses carry forward. On sale, claimed depreciation is recaptured at up to 25%, and gains may owe capital-gains tax (a 1031 exchange can defer both). Figures are a year-1 estimate at your 24.0% rate — not tax advice; consult a CPA.
Schools (NCES district)
- District
- Elmira City School District
- NCES district ID
- 3610560
- Math proficiency
- 23% ▼ -7.00%
- Reading proficiency
- 35% ▲ 7.00%
- Median HH income
- $40,180
- Composite
- 24.39/100
- National rank
- #7688
- State rank
- #580 of 590 in NY
Livability — Elmira
- Score
- 62/100
- State rank
- #832
- US rank
- #16139
Category grades
Schools grade is shown separately in the Schools card above.
Census & demographics
- Census place
- Elmira, NY
- City population
- 14,276
- Population (ZIP)
- 14,276
Population outlook (Chemung County) Hauer SSP2
- Today (2025)
- 82,931 people
- By 2030
- 80,356 · -3.1%
- By 2040
- 74,745 · -9.9%
- By 2050
- 69,012 · -16.8%
- By 2075
- 55,689 · -32.8%
- By 2100
- 41,428 · -50.0%
Race, ethnicity, and origin ACS 2023
- Neighborhood character
- Predominantly White (83%)
- Race & ethnicity
- White 83% Two or more races 7% Black 7% Hispanic / Latino 5% Native American 1%
- Common ancestry
- Romanian 7% Lithuanian 3% Slovak 2%
- Foreign-born
- 2% · Canada, Jamaica, Dominican Republic
- Languages at home
- 97% English-only · Spanish 2%
Political lean MEDSL · Chemung
- 2024 margin
- R (+16.8) · D 41.6% · R 58.4%
- 2008→2024 swing
- -15.6pp toward R · 2008: -1.2pp · 2024: -16.8pp
- All cycles
- 2024: R+16.8 2020: R+13.4 2016: R+20.0 2012: R+2.9 2008: R+1.2
Not yet ingested
- Civics
- —
Market trends
- HPI YoY
- ▼ -23.33%
- Current HPI
- 220.688
- Rent YoY
- —
- Metro
- —
- State GDP YoY
- ▲ 2.60%
- F500 in state
- 92
Industry mix (Fortune 500 HQ in NY)
| Industry | F500 HQs | Revenue |
|---|---|---|
| Financial Services | 10 | $950B |
|
||
| Consumer Goods | 9 | $162B |
|
||
| Insurance | 4 | $225B |
|
||
| Telecommunications | 2 | $144B |
|
||
| Pharmaceuticals | 2 | $112B |
|
||
| Media / Entertainment | 2 | $69B |
|
||
Price history
+62.9% since first listed15 events — show timeline
- 2026-06-06 Listed $65,000 UNYREIS
- 2025-07-31 Listing Removed — UNYREIS
- 2025-05-27 Price Changed $43,000 UNYREIS
- 2025-01-21 Listed $50,000 UNYREIS
- 2011-10-14 Sold (MLS) $30,000 UNYREIS
- 2011-08-09 Listed $32,500 UNYREIS
- 2010-06-23 Sold (Public Records) $9,900 Public Records
- 2008-09-30 Listing Removed — UNYREIS
- 2008-03-24 Listed $19,900 UNYREIS
- 2007-12-31 Listing Removed — UNYREIS
- 2007-03-25 Listed $25,900 UNYREIS
- 2005-12-31 Listing Removed — UNYREIS
- 2005-07-01 Listed $34,900 UNYREIS
- 2005-03-24 Listing Removed — UNYREIS
- 2005-02-01 Listed $39,900 UNYREIS
Property tax history
+6.9%/yrLatest (2025): $2,663 · -11.7% YoY. Source: county tax records.
Cash-flow waterfall
monthlySold comps — $/sqft
last 12 mo · ≤1 miLoading sold comps…