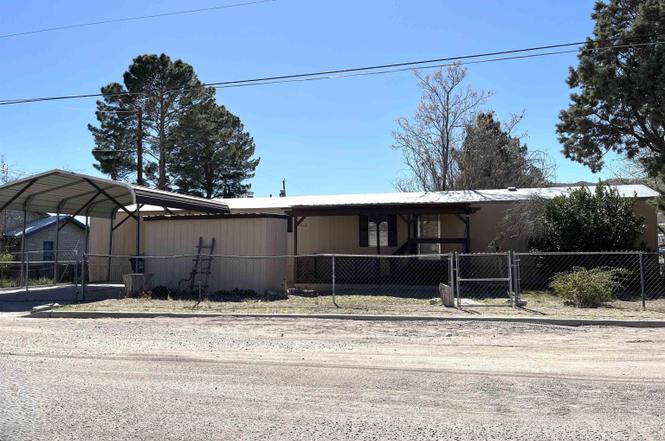
700 Carmen St · Williamsburg, NM
Flood risk 1/10 · Minimal
- FEMA flood zone
- X
- Chance of flooding over 30 yrs
- 0.0%
- Est. flood insurance / yr
- $507 – $1,088
Fire risk 4/10 · Minor
- Est. fire insurance / yr
- $706 – $1,312
Heat risk 5/10 · Moderate
- Hot days now (above 99°F)
- 7 days/yr
- Hot days in 30 yrs
- 20 days/yr
Wind risk 1/10 · Minimal
- Chance of severe wind over 30 yrs
- —
Air-quality risk 1/10 · Minimal
- Unhealthy air days now
- 0 days/yr
- Unhealthy air days in 30 yrs
- 0 days/yr
Risk factors via First Street. Map © Google.
Why this score? — see what drove the B grade
The composite is a weighted blend of 9 inputs, each scored 0–100. Each bar is that input's sub-score; the figure is the points it added to the 100-point composite (weight × sub-score).
- Cash flow +30.0/30.0
- 1% rule +10.0/10.0
- DSCR +10.0/10.0
- ARV discount +7.5/15.0
- Appreciation +5.7/10.0
- Livability +2.9/5.0
- Rent growth +2.5/5.0
- Condition / age +2.2/5.0
- Schools +2.0/10.0
$95,000
🖨 Deal sheet (PDF) 📄 Offer letter ✓ Due diligence
Listing remarks
Room to Spare in this split bedroom 1997, 16'x80' MFH on a great corner location. This 3BRS, 2BA, home offers 1280 sq. ft. of spacious living from the inviting living room that flows into an impressive, cabinet-filled kitchen complete with all appliances, including a French-door refrigerator, serving counter, and formal dining area with breakfront - perfect for everyday living or entertaining. The primary suite is generously sized and includes a walk-in closet and a private full bath with dual sinks, a separate shower, and a relaxing garden tub. Additional highlights include refrigerated A/C, detached carport, covered deck entry, and workshop/storage building for projects or extra space. Si
Key facts
- Corner location
- Formal dining area
- Walk in closet
Tags
Property features AI
Exterior
- Parking: 1 total parking space; 1 covered space; 1-car garage; Detached carport
- Utilities: Public water; Sewer connected; Electricity connected; Natural gas available and connected
- Home design: Manufactured house (single wide); One story; Faces Central Ave; Residential property
- Construction: Built with frame and wood siding; Other/unknown construction materials; Metal roof; Single-story structure
- Exterior features: Covered patio/porch; Fenced yard (front and back); Chain link fence; Workshop (other structure)
Interior
- Kitchen: Dishwasher; Free-standing range; Refrigerator
- Bathrooms: 2 full bathrooms
- Heating & cooling: Central air; Ceiling fan(s); Forced air heating; Natural gas heating
- Interior features: Ceiling fans; Pantry; Walk-in closet(s)
- Laundry & utility: Washer; Dryer; Gas water heater; Water heater
Neighborhood map
What this means for you Summary
Snapshot
- This is a 3-bed/2.0-bath manufactured listed at $95k. Condition is rated fair.
Deal economics
- At list price, monthly cash flow is $982 ($12k/yr) — positive.
- The deal already cash-flows at list — no discount required.
- Meets the 1% rule at list price ($2k rent vs $95k).
- Recommended offer: $86k (9.0% below list) — sets the bar for market timing.
Location & tenants
- Location reads 58/100 on livability (#151 in NM) — a working-class tenant base; expect higher turnover. Strengths: cost of living A+, housing B+; Watch: employment D+, commute D, crime F.
- T Or C Municipal Schools (town): math 25% / reading 25% proficiency, ranked #29 of 29 in NM (top 100%) — low school quality limits family demand, transient renter base, plan for 1-2y turnover; 70% free/reduced lunch — lower-income household profile, screen leases tightly.
- Zoned schools: T Or C Elementary (389 students, 100% FRL); T Or C Middle (283 students, 100% FRL) — zoned schools average 100% FRL vs 70% district-wide (30 pts higher); higher-poverty schools than district average — tighter screening recommended.
- Market conditions: 19 active listings in the ZIP.
Forward outlook
- In year one you build about $2k of equity ($657 loan paydown + $1k appreciation (1.3% local appreciation)).
- Sierra County population projected at -38% by 2050 — secular population decline; favor cash flow + early exit over multi-decade hold.
- At projected returns (1.3% appreciation + 3.0% rent growth), your $27k cash investment doubles in ~2 years — after that, you're playing with house money.
Negotiation context
- It's been on market 97 days — a 9% lower offer ($86k) is reasonable based on typical stale-listing flexibility.
Risks & watch-outs
- Climate carrying-cost: extreme-heat days projected 7→20/yr by 2055 (HVAC capex compounding) — expect insurance premiums to compound above CPI over the hold.
Questions for the listing agent
- It's been on market 97 days. Have you received any prior offers? Is the seller open to a 9% concession, seller financing, or rate buy-down credit?
- Have any recent inspections been done? Can we get a copy of the seller's disclosures and any deferred-maintenance estimates?
- Why hasn't it sold? Are there any deal-killer items the seller is aware of (foundation, flood, title, zoning, code violations)?
- Is there a deadline driving the sale (1031 exchange, divorce, estate, relocation)? That informs how much negotiation room exists.
- Schools are F-rated, which usually means shorter tenancies and higher turnover. Who's the typical renter profile here, and what's been the actual vacancy rate?
- Crime grade is F in this area — have there been break-ins, vandalism, or insurance claims at this property in the last 3 years? What carrier currently insures it and at what premium?
- What's the average days-on-market for RENTAL listings here right now (not sales)? A rising rental-DOM trend means longer vacancies and softer asking-rent achievability than the comps imply.
- What's the recent tenant-quality profile in this submarket — average credit score on applications, eviction rate, late-payment / NSF rate, and stable-employment percentage? A property-management company in the area should have these aggregated.
- How much new for-sale + rental construction is in the pipeline within 1–3 miles? Heavy new supply typically softens prices + rents 12–24 months out; constrained supply supports both.
Investment metrics
- 1% rule
- 2.18% ✓
- Cap rate
- 18.70%
- Cash-on-cash
- 44.31%
- DSCR
- 2.97
- GRM
- 3.8
CMA / ARV
No comps found within radius.
Projected returns pro-forma
1.31% appreciation · 3.0% rent growth · sell at horizon
- IRR
- 47.3%
- Equity multiple
- 3.47×
- Total profit
- $65,811
- Equity at exit
- $33,972
- IRR
- 48.8%
- Equity multiple
- 6.93×
- Total profit
- $157,630
- Equity at exit
- $46,362
Cash invested: $26,600 (down + closing). Projections, not guarantees.
Landlord ↔ Tenant lean methodology
- Overall (STATE)
- 55 Moderately Landlord-Leaning
- State New Mexico
- 55 Moderately Landlord-Leaning · D+3
- County
- — inherits STATE
- City
- — inherits STATE
ZIP-level market 87942
- Home prices YoY
- 1.0%
- Active inventory
- 19
- Price-to-rent
- 3.8×
Monthly cashflow live
- Estimated rent
- $2,074 medium interval (Pro) →
- Mortgage (P&I)
- −$498
- Tax est. 1.5%
- −$119 /mo · $1,425/yr
- Insurance
- −$40
- HOA
- −$0
- Vacancy / Maint / Mgmt
- −$436
- Net cashflow
- $982
Break-even live
Sensitivity live
| Price | -10% $1,048 | -5% $1,015 | +0% $982 | +5% $949 | +10% $917 |
|---|---|---|---|---|---|
| Rent | -10% $818 | -5% $900 | +0% $982 | +5% $1,064 | +10% $1,146 |
| Rate | -1.0pp $1,030 | -0.5pp $1,006 | base $982 | +0.5pp $958 | +1.0pp $933 |
UW: 25.0% down · 7.5% · 30yr · 1.5% tax · 5.0% vac · 8.0% maint · 8.0% mgmt
Financing live
Cash to close
- Down payment
- $23,750
- Closing costs
- $2,850
- Reserves months
- —
- Total cash needed
- —
Loan-product check · same deal, 3 products live
Conventional
25% down · 7.5% · 30yr
- Down + closing
- —
- Monthly P&I
- —
- Monthly cashflow
- —
- DSCR
- —
- Eligible?
- —
Personal DTI + credit; lowest rate.
DSCR
20% down · 8.5% · 30yr
- Down + closing
- —
- Monthly P&I
- —
- Monthly cashflow
- —
- DSCR
- —
- Eligible?
- —
No personal income docs; deal must DSCR.
Hard money
10% down · 12.0% · 12mo
- Down + closing
- —
- Monthly P&I
- —
- Monthly cashflow
- —
- DSCR
- —
- Eligible?
- —
Short-term bridge; refi at stabilization.
Listing history 17 events
-
2026-06-18days on market $95,000 Active 97 DOM
-
2026-06-17days on market $95,000 Active 96 DOM
-
2026-06-16days on market $95,000 Active 95 DOM
-
2026-06-15days on market $95,000 Active 94 DOM
-
2026-06-14days on market $95,000 Active 92 DOM
-
2026-06-13days on market $95,000 Active 91 DOM
-
2026-06-10days on market $95,000 Active 89 DOM
-
2026-06-09days on market $95,000 Active 88 DOM
-
2026-06-08days on market $95,000 Active 87 DOM
-
2026-06-07days on market $95,000 Active 86 DOM
-
2026-06-02days on market $95,000 Active 81 DOM
-
2026-06-01days on market $95,000 Active 80 DOM
-
2026-05-31days on market $95,000 Active 79 DOM
-
2026-05-30days on market $95,000 Active 78 DOM
-
2026-04-13price $110,000
-
2026-04-04price $115,000
-
2026-03-13$129,900 Active
ⓘ Source: listings_history table (triggers on properties + properties_extension) + one-shot
backfill from property_details.listing_events for pre-trigger history.
Climate risk First Street
- Flood 1/10 Low FEMA zone X · 0% chance over 30 yrs
- Wildfire 4/10 Moderate
- Heat 5/10 Major 7 d/yr ≥99°F today · 20 d/yr by 30 yrs out
- Wind 1/10 Low
- Air quality 1/10 Low 0 unhealthy d/yr today · 0 by 30 yrs out
Nearby sold comps map
Loading sold comps map…
Walkable amenities ~0.75 mi
Loading nearby amenities…
Taxation est. · year 1
- Rental income
- $24,891
- − Mortgage interest
- −$5,321
- − Property taxes
- −$1,425
- − Insurance
- −$475
- − Repairs & maintenance
- −$1,991
- − Management
- −$1,991
- − Depreciation
- −$2,764
- Taxable income
- $10,924
- Est. tax owed @ 24.0%
- −$2,622
- After-tax cash flow
- $9,164/yr
For passive investors: Depreciation is non-cash, so a rental often shows a tax loss while cash-flowing — sheltering income. Rental losses are passive: they offset passive income freely, and up to $25,000/yr can offset ordinary (W-2) income if you actively participate and your MAGI is under $100k (phasing out to $0 by $150k); unused losses carry forward. On sale, claimed depreciation is recaptured at up to 25%, and gains may owe capital-gains tax (a 1031 exchange can defer both). Figures are a year-1 estimate at your 24.0% rate — not tax advice; consult a CPA.
Condition & rehab AI · 14 photos
This manufactured home requires moderate repairs and updates to its interior and exterior to improve its condition and value. Key areas for improvement include new flooring, kitchen and bathroom updates, and exterior painting and landscaping.
Repairs flagged
- Major Carpet — Worn and in need of replacement.
- Moderate Kitchen cabinets — Dated appearance and wear.
- Moderate Bathroom fixtures — Worn and dated appearance.
- Moderate Exterior siding — Weathered appearance.
- Moderate Carport — Rust and wear visible.
Value-add opportunities
- Resale New flooring (carpet) — Fresh carpet will improve the home's appearance and appeal to potential buyers.
- Resale Kitchen and bathroom updates — Modernizing the kitchen and bathrooms will significantly enhance the home's value and appeal.
- Both Exterior painting and landscaping — A fresh coat of paint and improved landscaping will boost both resale and rental value.
Renovation cost estimate screening
| Repair item | Severity | Est. cost |
|---|---|---|
| Carpet · Worn and in need of replacement. | Major | $15,000–50,000 |
| Kitchen cabinets · Dated appearance and wear. | Moderate | $3,000–15,000 |
| Bathroom fixtures · Worn and dated appearance. | Moderate | $3,000–15,000 |
| Exterior siding · Weathered appearance. | Moderate | $3,000–15,000 |
| Carport · Rust and wear visible. | Moderate | $3,000–15,000 |
| Total estimated repair cost · 5 items | $27,000–110,000 |
Value-add ROI direction
- Resale New flooring (carpet) — Fresh carpet will improve the home's appearance and appeal to potential buyers. ↑
- Resale Kitchen and bathroom updates — Modernizing the kitchen and bathrooms will significantly enhance the home's value and appeal. ↑
- Both Exterior painting and landscaping — A fresh coat of paint and improved landscaping will boost both resale and rental value. ↑
ⓘ Cost ranges are severity-bucket heuristics (US national rule-of-thumb). Get contractor quotes + a written scope before underwriting a rehab budget.
Schools (NCES district)
- District
- T Or C Municipal Schools
- NCES district ID
- 3502610
- Math proficiency
- 25% ▲ 1.00%
- Reading proficiency
- 25% ▼ -7.00%
- Median HH income
- $28,449
- Composite
- 20.0/100
- National rank
- #8666
- State rank
- #29 of 29 in NM
Livability — Williamsburg
- Score
- 58/100
- State rank
- #151
- US rank
- #21342
Category grades
Schools grade is shown separately in the Schools card above.
Census & demographics
- Census place
- Williamsburg, NM
- Population (ZIP)
- 1,114
Population outlook (Sierra County) Hauer SSP2
- Today (2025)
- 9,498 people
- By 2030
- 8,580 · -9.7%
- By 2040
- 6,994 · -26.4%
- By 2050
- 5,914 · -37.7%
- By 2075
- 4,083 · -57.0%
- By 2100
- 2,499 · -73.7%
Race, ethnicity, and origin ACS 2023
- Neighborhood character
- Majority White (58%)
- Race & ethnicity
- White 58% Hispanic / Latino 41% Two or more races 16%
- Hispanic origin (detail)
- Mexican 36%
- Common ancestry
- Slovak 11% German 1% Romanian 1%
- Foreign-born
- 20% · Canada
- Languages at home
- 65% English-only · Spanish 35%
Political lean MEDSL · Sierra
- 2024 margin
- R (+19.2) · D 39.2% · R 58.3% · Other 2.5%
- 2008→2024 swing
- -7.1pp toward R · 2008: -12.1pp · 2024: -19.2pp
- All cycles
- 2024: R+19.2 2020: R+21.5 2016: R+27.2 2012: R+18.9 2008: R+12.1
Not yet ingested
- Civics
- —
Market trends
- HPI YoY
- ▲ 1.31%
- Current HPI
- 128.8108
- Rent YoY
- —
- Metro
- —
- State GDP YoY
- —
- F500 in state
- 0
Price history
-15.3% since first listed3 events — show timeline
- 2026-04-13 Price Changed $110,000 NMMLS
- 2026-04-04 Price Changed $115,000 NMMLS
- 2026-03-13 Listed $129,900 NMMLS
Cash-flow waterfall
monthlySold comps — $/sqft
last 12 mo · ≤1 miLoading sold comps…