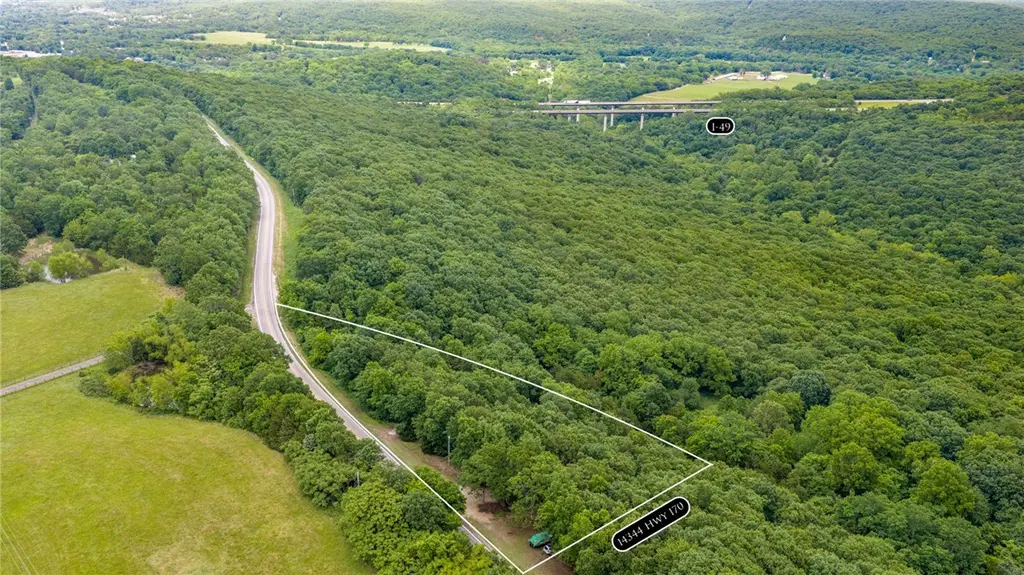
14344 S Hwy 170 · West Fork, AR
Flood risk 1/10 · Minimal
- FEMA flood zone
- X (unshaded)
- Chance of flooding over 30 yrs
- 0.0%
- Est. flood insurance / yr
- $507 – $1,088
Fire risk 5/10 · Moderate
- Est. fire insurance / yr
- $1,499 – $2,785
Heat risk 4/10 · Minor
- Hot days now (above 104°F)
- 7 days/yr
- Hot days in 30 yrs
- 19 days/yr
Wind risk 2/10 · Minimal
- Chance of severe wind over 30 yrs
- 2.0%
Air-quality risk 2/10 · Minimal
- Unhealthy air days now
- 0 days/yr
- Unhealthy air days in 30 yrs
- 1 days/yr
Risk factors via First Street. Map © Google.
Why this score? — see what drove the B- grade
The composite is a weighted blend of 9 inputs, each scored 0–100. Each bar is that input's sub-score; the figure is the points it added to the 100-point composite (weight × sub-score).
- Cash flow +30.0/30.0
- 1% rule +10.0/10.0
- DSCR +10.0/10.0
- ARV discount +7.5/15.0
- Livability +3.3/5.0
- Rent growth +2.5/5.0
- Condition / age +2.5/5.0
- Schools +2.1/10.0
- Appreciation +0.0/10.0
$199,000
🖨 Deal sheet (PDF) 📄 Offer letter ✓ Due diligence
Listing remarks
Unique opportunity just minutes from town and a short drive to Devil's Den State Park. Situated along Highway 170 with hillside views of the surrounding countryside, this property features two separate living structures, each offering 1 bedroom and 1 bathroom. The main home includes approximately 529 square feet, while the detached ADU offers 576 square feet. Each has its own heating and cooling system, providing flexibility for guests, rental income, a home office, or multi-generational living. Enjoy the convenience of easy access to town while still being close to some of Northwest Arkansas's best outdoor recreation. A cistern currently serves the property, and a water tap is conveniently
Key facts
- Easy access to town
- Hillside views
- 2 acre lot
Tags
Property features AI
Finance
- HOA & community: Monthly association fee; Near state park; Trails/paths nearby
Exterior
- Utilities: Septic available; Septic tank; Rural water
- Home design: Single-story home; Metal roof; Wood siding; Has view
- Construction: Built with wood siding; Metal roof
- Exterior features: Deck; Gravel driveway; Views; Wooded lot; Sloped terrain; Not in a subdivision; Public road frontage
Interior
- Kitchen: Dishwasher; Microwave; Electric water heater
- Flooring: Carpet; Luxury vinyl plank
- Bathrooms: 1 full bathroom
- Heating & cooling: Ductless cooling; Ductless heating; Propane heating
- Interior features: Living room fireplace; Media room
- Laundry & utility: Washer hookup; Dryer hookup
Neighborhood map
What this means for you Summary
Snapshot
- This is a 1-bed/1.0-bath single-family listed at $199k.
Deal economics
- At list price, monthly cash flow is $3k ($34k/yr) — positive.
- The deal already cash-flows at list — no discount required.
- Meets the 1% rule at list price ($5k rent vs $199k).
- Recommended offer: $196k (1.5% below list) — sets the bar for market timing.
- Cap rate 23.1% vs local median 5.5% in West Fork — top-decile yield for the area; either an underpriced asset or a hidden risk that comps aren't pricing in. Stress-test before assuming the spread holds.
Location & tenants
- Location reads 66/100 on livability (#126 in AR) — a middle-class / working-renter tenant base. Strengths: crime A+, cost of living A+, housing A+; Watch: amenities F, commute F, health & safety F.
- West Fork School District (rural): math 23% / reading 26% proficiency, ranked #182 of 238 in AR (top 76%) — low school quality limits family demand, transient renter base, plan for 1-2y turnover.
- Zoned schools: West Fork Elementary School (math 37% / reading 22%, grade F, #305 of 454 statewide, top 71%, 340 students, 54% FRL); West Fork Middle School (math 24% / reading 24%, grade F, #170 of 201 statewide, top 86%, 241 students, 47% FRL); West Fork High School (math 12% / reading 32%, grade F, #213 of 292 statewide, top 77%, 291 students, 42% FRL) — zoned schools at 47% FRL track the district average.
- Market conditions: 74 active listings in the ZIP; 1 comparable units currently listed for rent nearby; 3,494 units permitted in Washington County in 2024 (1,497 in 5+ unit buildings).
Forward outlook
- Local home prices are declining (-3.0%/yr); year-one equity from $1k of loan paydown is wiped out by about $6k of value loss. Plan a longer hold.
- Washington County population projected at +47% by 2050 — long-run rental-demand tailwind backs the buy-and-hold thesis.
- At projected returns (-3.0% appreciation + 3.0% rent growth), your $56k cash investment doubles in ~2 years — after that, you're playing with house money.
Negotiation context
- It's been on market 16 days — a 2% lower offer ($196k) is reasonable based on typical stale-listing flexibility.
Risks & watch-outs
- Climate carrying-cost: moderate wildfire risk — expect insurance premiums to compound above CPI over the hold.
Questions for the listing agent
- Is there a deadline driving the sale (1031 exchange, divorce, estate, relocation)? That informs how much negotiation room exists.
- Schools are D-rated, which usually means shorter tenancies and higher turnover. Who's the typical renter profile here, and what's been the actual vacancy rate?
- What's the average days-on-market for RENTAL listings here right now (not sales)? A rising rental-DOM trend means longer vacancies and softer asking-rent achievability than the comps imply.
- What's the recent tenant-quality profile in this submarket — average credit score on applications, eviction rate, late-payment / NSF rate, and stable-employment percentage? A property-management company in the area should have these aggregated.
- How much new for-sale + rental construction is in the pipeline within 1–3 miles? Heavy new supply typically softens prices + rents 12–24 months out; constrained supply supports both.
Investment metrics
- 1% rule
- 2.65% ✓
- Cap rate
- 23.14%
- Cash-on-cash
- 60.16%
- DSCR
- 3.68
- GRM
- 3.1
CMA / ARV
No comps found within radius.
Projected returns pro-forma
-3.0% appreciation · 3.0% rent growth · sell at horizon
- IRR
- 58.9%
- Equity multiple
- 3.62×
- Total profit
- $145,758
- Equity at exit
- $29,672
- IRR
- 63.7%
- Equity multiple
- 7.40×
- Total profit
- $356,354
- Equity at exit
- $17,206
Cash invested: $55,720 (down + closing). Projections, not guarantees.
Landlord ↔ Tenant lean methodology
- Overall (STATE)
- 92 Strongly Landlord-Friendly
- State Arkansas
- 92 Strongly Landlord-Friendly · R+14
- County
- — inherits STATE
- City
- — inherits STATE
ZIP-level market 72774
- Home prices YoY
- -16.0%
- Active inventory
- 74
- Price-to-rent
- 3.1×
Monthly cashflow live
- Estimated rent
- $5,277 medium interval (Pro) →
- Mortgage (P&I)
- −$1,044
- Tax est. 1.5%
- −$249 /mo · $2,985/yr
- Insurance
- −$83
- HOA
- −$0
- Vacancy / Maint / Mgmt
- −$1,108
- Net cashflow
- $2,794
Break-even live
Sensitivity live
| Price | -10% $2,931 | -5% $2,862 | +0% $2,794 | +5% $2,725 | +10% $2,656 |
|---|---|---|---|---|---|
| Rent | -10% $2,377 | -5% $2,585 | +0% $2,794 | +5% $3,002 | +10% $3,210 |
| Rate | -1.0pp $2,894 | -0.5pp $2,844 | base $2,794 | +0.5pp $2,742 | +1.0pp $2,690 |
UW: 25.0% down · 7.5% · 30yr · 1.5% tax · 5.0% vac · 8.0% maint · 8.0% mgmt
Financing live
Cash to close
- Down payment
- $49,750
- Closing costs
- $5,970
- Reserves months
- —
- Total cash needed
- —
Loan-product check · same deal, 3 products live
Conventional
25% down · 7.5% · 30yr
- Down + closing
- —
- Monthly P&I
- —
- Monthly cashflow
- —
- DSCR
- —
- Eligible?
- —
Personal DTI + credit; lowest rate.
DSCR
20% down · 8.5% · 30yr
- Down + closing
- —
- Monthly P&I
- —
- Monthly cashflow
- —
- DSCR
- —
- Eligible?
- —
No personal income docs; deal must DSCR.
Hard money
10% down · 12.0% · 12mo
- Down + closing
- —
- Monthly P&I
- —
- Monthly cashflow
- —
- DSCR
- —
- Eligible?
- —
Short-term bridge; refi at stabilization.
Rent comps 1 comps
| Address | Beds | Baths | Sqft | Rent | $/sqft | DOM | Units | Dist |
|---|---|---|---|---|---|---|---|---|
| 10512 Wooton Rd Unit 1221867P West Fork, AR | 1.0 | 1.0 | 645 | $5,277 | $8.18 | 14d | 1 | 0.20mi |
Listing history 13 events
-
2026-06-18days on market $199,000 Active 16 DOM
-
2026-06-17days on market $199,000 Active 15 DOM
-
2026-06-16days on market $199,000 Active 14 DOM
-
2026-06-15days on market $199,000 Active 13 DOM
-
2026-06-14days on market $199,000 Active 11 DOM
-
2026-06-13days on market $199,000 Active 10 DOM
-
2026-06-10days on market $199,000 Active 8 DOM
-
2026-06-09days on market $199,000 Active 7 DOM
-
2026-06-08days on market $199,000 Active 6 DOM
-
2026-06-07days on market $199,000 Active 5 DOM
-
2026-06-05days on market $199,000 Active 2 DOM
-
2026-06-03remarks 699-char remark
-
2026-06-03$199,000 Active 1 DOM
ⓘ Source: listings_history table (triggers on properties + properties_extension) + one-shot
backfill from property_details.listing_events for pre-trigger history.
Climate risk First Street
- Flood 1/10 Low FEMA zone X (unshaded) · 0% chance over 30 yrs
- Wildfire 5/10 Major
- Heat 4/10 Moderate 7 d/yr ≥104°F today · 19 d/yr by 30 yrs out
- Wind 2/10 Low 2% chance of damaging wind over 30 yrs
- Air quality 2/10 Low 0 unhealthy d/yr today · 1 by 30 yrs out
Nearby sold comps map
Loading sold comps map…
Walkable amenities ~0.75 mi
Loading nearby amenities…
Taxation est. · year 1
- Rental income
- $63,324
- − Mortgage interest
- −$11,147
- − Property taxes
- −$2,985
- − Insurance
- −$995
- − Repairs & maintenance
- −$5,066
- − Management
- −$5,066
- − Depreciation
- −$5,789
- Taxable income
- $32,276
- Est. tax owed @ 24.0%
- −$7,746
- After-tax cash flow
- $25,777/yr
For passive investors: Depreciation is non-cash, so a rental often shows a tax loss while cash-flowing — sheltering income. Rental losses are passive: they offset passive income freely, and up to $25,000/yr can offset ordinary (W-2) income if you actively participate and your MAGI is under $100k (phasing out to $0 by $150k); unused losses carry forward. On sale, claimed depreciation is recaptured at up to 25%, and gains may owe capital-gains tax (a 1031 exchange can defer both). Figures are a year-1 estimate at your 24.0% rate — not tax advice; consult a CPA.
Schools (NCES district)
- District
- West Fork School District
- NCES district ID
- 0514010
- Math proficiency
- 23% ▼ -20.00%
- Reading proficiency
- 26% ▼ -16.00%
- Median HH income
- $46,044
- Composite
- 21.26/100
- National rank
- #8396
- State rank
- #182 of 238 in AR
Livability — West Fork
- Score
- 66/100
- State rank
- #126
- US rank
- #11748
Category grades
Schools grade is shown separately in the Schools card above.
Census & demographics
- Population (ZIP)
- 7,298
Population outlook (Washington County) Hauer SSP2
- Today (2025)
- 271,748 people
- By 2030
- 296,414 · +9.1%
- By 2040
- 346,874 · +27.6%
- By 2050
- 398,552 · +46.7%
- By 2075
- 523,309 · +92.6%
- By 2100
- 615,280 · +126.4%
Race, ethnicity, and origin ACS 2023
- Neighborhood character
- Predominantly White (73%)
- Race & ethnicity
- White 73% Two or more races 19% Hispanic / Latino 6% Asian 2% Native American 2%
- Hispanic origin (detail)
- Mexican 4%
- Common ancestry
- Slovak 6% Italian 5% Iranian 3%
- Foreign-born
- 4% · China, Canada, South Korea
- Languages at home
- 97% English-only · Spanish 1% Chinese 1%
Political lean MEDSL · Washington
- 2024 margin
- Lean R (+6.7) · D 45.1% · R 51.7% · Other 3.2%
- 2008→2024 swing
- +6.4pp toward D · 2008: -13.1pp · 2024: -6.7pp
- All cycles
- 2024: R+6.7 2020: R+3.9 2016: R+10.4 2012: R+16.3 2008: R+13.1
Not yet ingested
- Civics
- —
Market trends
- HPI YoY
- ▼ -50.93%
- Current HPI
- 267.4622
- Rent YoY
- —
- Metro
- —
- State GDP YoY
- ▲ 3.80%
- F500 in state
- 10
Industry mix (Fortune 500 HQ in AR)
| Industry | F500 HQs | Revenue |
|---|---|---|
| Retail | 1 | $681B |
|
||
| Food / Agriculture | 1 | $53B |
|
||
| Retail / Energy | 1 | $22B |
|
||
| Transportation / Logistics | 1 | $12B |
|
||
| Energy | 1 | $4B |
|
||
Price history
1 event — show timeline
- 2026-06-01 Listed $199,000 NWARMLS
Property tax history
+5.8%/yrLatest (2025): $236 · -21.8% YoY. Source: county tax records.
Cash-flow waterfall
monthlySold comps — $/sqft
last 12 mo · ≤1 miLoading sold comps…