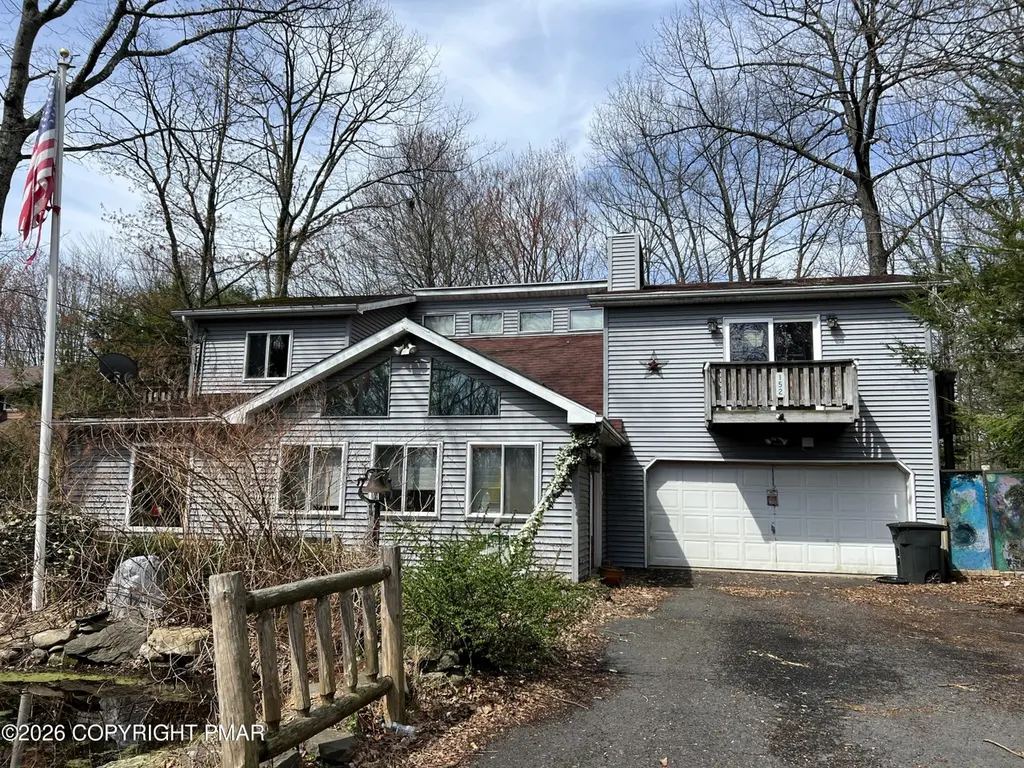
152 Fairview Ave · Mount Pocono, PA
Flood risk 1/10 · Minimal
- FEMA flood zone
- X (unshaded)
- Chance of flooding over 30 yrs
- 0.0%
- Est. flood insurance / yr
- $507 – $1,088
Fire risk 4/10 · Minor
- Est. fire insurance / yr
- $511 – $949
Heat risk 2/10 · Minimal
- Hot days now (above 90°F)
- 7 days/yr
- Hot days in 30 yrs
- 15 days/yr
Wind risk 4/10 · Minor
- Chance of severe wind over 30 yrs
- 8.0%
Air-quality risk 2/10 · Minimal
- Unhealthy air days now
- 1 days/yr
- Unhealthy air days in 30 yrs
- 2 days/yr
Risk factors via First Street. Map © Google.
Why this score? — see what drove the C+ grade
The composite is a weighted blend of 9 inputs, each scored 0–100. Each bar is that input's sub-score; the figure is the points it added to the 100-point composite (weight × sub-score).
- Cash flow +18.1/30.0
- ARV discount +15.0/15.0
- 1% rule +5.8/10.0
- DSCR +5.7/10.0
- Appreciation +5.3/10.0
- Schools +4.0/10.0
- Livability +3.9/5.0
- Rent growth +2.5/5.0
- Condition / age +2.5/5.0
$259,900
🖨 Deal sheet (PDF) 📄 Offer letter ✓ Due diligence
Listing remarks
Outdoor lovers can enjoy huge deck and patio. You could practically live outside when the weather permits. Kitchen has alot of cabinets for storage. Huge bedroom suite with two walk in closets. Versatile floorplan with a layout that allows for both privacy and connection. Two car garage and paved driveway. Peaceful location on the outskirts of town of Mount Pocono, where there is shopping and dining, healthcare. Property must be on market for 7 days before any owner-occupant offer is countered/accepted and Investor offers after 30 DOM. Awesome opportunity for rehab loan available to make property stunning again.
Key facts
- Huge patio
- Paved driveway
- Kitchen cabinets
Tags
Neighborhood map
What this means for you Summary
Snapshot
- This is a 3-bed/2.0-bath single-family listed at $260k.
Deal economics
- At list price, monthly cash flow is $228 ($3k/yr) — positive.
- The deal already cash-flows at list — no discount required.
- Meets the 1% rule at list price ($3k rent vs $260k).
- Recommended offer: $256k (1.5% below list) — sets the bar for market timing.
- Cap rate 7.3% vs local median 5.1% in Mount Pocono — top-decile yield for the area; either an underpriced asset or a hidden risk that comps aren't pricing in. Stress-test before assuming the spread holds.
Location & tenants
- Location reads 77/100 on livability (#362 in PA, #3,166 nationally) — a middle-class / working-renter tenant base. Strengths: crime A+, cost of living A+, housing A+; Watch: schools F, commute F.
- Pocono Mountain SD (rural): math 37% / reading 55% proficiency, ranked #245 of 539 in PA (top 46%) — families likely to look elsewhere, expect single-tenant / working-renter base with shorter leases.
- Market conditions: 47 active listings in the ZIP; 1 comparable units currently listed for rent nearby; 278 units permitted in Monroe County in 2024 (52 in 5+ unit buildings).
Forward outlook
- In year one you build about $3k of equity ($2k loan paydown + $2k appreciation (0.6% local appreciation)).
- Monroe County population projected at -11% by 2050 — secular population decline; favor cash flow + early exit over multi-decade hold.
- At projected returns (0.6% appreciation + 3.0% rent growth), your $73k cash investment doubles in ~9 years — after that, you're playing with house money.
- By year 9, paydown + projected appreciation supports a ~$34k cash-out refi (75% LTV) — recoverable capital for the next deal without selling this one.
Negotiation context
- It's been on market 21 days — a 2% lower offer ($256k) is reasonable based on typical stale-listing flexibility.
- 7 sale attempts since 2y ago with the ask held roughly flat each time — persistent listings suggest the price (not the market) is what's stuck; bring a comps-based counter.
Questions for the listing agent
- What does the HOA fee cover, when was the last increase, and are there any pending special assessments or reserve-fund shortfalls?
- Is there a deadline driving the sale (1031 exchange, divorce, estate, relocation)? That informs how much negotiation room exists.
- Schools are F-rated, which usually means shorter tenancies and higher turnover. Who's the typical renter profile here, and what's been the actual vacancy rate?
- What's the average days-on-market for RENTAL listings here right now (not sales)? A rising rental-DOM trend means longer vacancies and softer asking-rent achievability than the comps imply.
- What's the recent tenant-quality profile in this submarket — average credit score on applications, eviction rate, late-payment / NSF rate, and stable-employment percentage? A property-management company in the area should have these aggregated.
- How much new for-sale + rental construction is in the pipeline within 1–3 miles? Heavy new supply typically softens prices + rents 12–24 months out; constrained supply supports both.
Investment metrics
- 1% rule
- 1.08% ✓
- Cap rate
- 7.34%
- Cash-on-cash
- 3.75%
- DSCR
- 1.17
- GRM
- 7.7
CMA / ARV
- ARV (on-the-fly)
- $335,298
- Comps found
- 11
Show comp detail 11 sales within ~0.75 mi
| Address | Dist | Beds/Ba | Sqft | Sold | Price | $/sf | Match |
|---|---|---|---|---|---|---|---|
| 43 Reeder St | 0.41mi | 3/2.5 | 2,366 (-0%) | 22mo | $365,000 | $154 | 60 |
| 47 Moutain Dr | 0.57mi | 3/2.5 | 2,275 (-4%) | 7mo | $373,000 | $164 | 58 |
| 3 Pointe St | 0.43mi | 4/2.5 (+1) | 2,340 (-2%) | 15mo | $299,000 | $128 | 58 |
| 74 Center Ave | 0.44mi | 3/2.0 | 2,605 (+10%) | 10mo | $320,000 | $123 | 55 |
| 441 Manor View Ave | 0.66mi | 3/3.0 | 2,400 (+1%) | 12mo | $245,000 | $102 | 54 |
| 6 Cobblewood Dr | 0.33mi | 3/2.0 | 2,064 (-13%) | 11mo | $340,000 | $165 | 53 |
| 22 Fairview Ave | 0.62mi | 4/1.5 (+1) | 2,490 (+5%) | 4mo | $252,500 | $101 | 53 |
| 25 Cobblewood Dr | 0.39mi | 4/3.0 (+1) | 2,208 (-7%) | 10mo | $345,000 | $156 | 52 |
| 101 Church Ave | 0.34mi | 4/3.5 (+1) | 2,150 (-10%) | 11mo | $332,000 | $154 | 48 |
| 12 Pointe St | 0.46mi | 3/1.5 | 2,114 (-11%) | 13mo | $298,500 | $141 | 47 |
| 40 Fairview Ave | 0.54mi | 3/1.5 | 2,130 (-10%) | 19mo | $215,000 | $101 | 40 |
Match score weights: distance 35% · size 25% · config 20% · recency 20%. Top-matched comps best support the ARV.
Projected returns pro-forma
0.63% appreciation · 3.0% rent growth · sell at horizon
- IRR
- 4.1%
- Equity multiple
- 1.20×
- Total profit
- $14,857
- Equity at exit
- $83,775
- IRR
- 8.9%
- Equity multiple
- 2.04×
- Total profit
- $75,406
- Equity at exit
- $107,596
Cash invested: $72,772 (down + closing). Projections, not guarantees.
Landlord ↔ Tenant lean methodology
- Overall (STATE)
- 62 Landlord-Friendly
- State Pennsylvania
- 62 Landlord-Friendly · EVEN
- County
- — inherits STATE
- City
- — inherits STATE
ZIP-level market 18344
- Home prices YoY
- 0.3%
- Active inventory
- 47
- Price-to-rent
- 7.7×
Monthly cashflow live
- Estimated rent
- $2,800 medium interval (Pro) →
- Mortgage (P&I)
- −$1,363
- Tax from tax record
- −$498 /mo · $5,979/yr
- Insurance
- −$108
- HOA
- −$15
- Vacancy / Maint / Mgmt
- −$588
- Net cashflow
- $228
Break-even live
Sensitivity live
| Price | -10% $375 | -5% $301 | +0% $228 | +5% $154 | +10% $80 |
|---|---|---|---|---|---|
| Rent | -10% $6 | -5% $117 | +0% $228 | +5% $338 | +10% $449 |
| Rate | -1.0pp $358 | -0.5pp $294 | base $228 | +0.5pp $160 | +1.0pp $92 |
UW: 25.0% down · 7.5% · 30yr · 1.5% tax · 5.0% vac · 8.0% maint · 8.0% mgmt
Financing live
Cash to close
- Down payment
- $64,975
- Closing costs
- $7,797
- Reserves months
- —
- Total cash needed
- —
Loan-product check · same deal, 3 products live
Conventional
25% down · 7.5% · 30yr
- Down + closing
- —
- Monthly P&I
- —
- Monthly cashflow
- —
- DSCR
- —
- Eligible?
- —
Personal DTI + credit; lowest rate.
DSCR
20% down · 8.5% · 30yr
- Down + closing
- —
- Monthly P&I
- —
- Monthly cashflow
- —
- DSCR
- —
- Eligible?
- —
No personal income docs; deal must DSCR.
Hard money
10% down · 12.0% · 12mo
- Down + closing
- —
- Monthly P&I
- —
- Monthly cashflow
- —
- DSCR
- —
- Eligible?
- —
Short-term bridge; refi at stabilization.
Rent comps 1 comps
| Address | Beds | Baths | Sqft | Rent | $/sqft | DOM | Units | Dist |
|---|---|---|---|---|---|---|---|---|
| 5 Deerfield Dr Mt Pocono, PA | 3.0 | 2.5 | 1686 | $2,800 | $1.66 | 44d | 1 | 0.20mi |
HOA detail
- Monthly dues
- $15 · $180/yr
Listing history 15 events
-
2026-04-10status Pending
-
2026-03-17$259,900 Active
-
2025-05-02price $299,900
-
2025-03-27$305,000 Active
-
2025-03-24historical
-
2025-03-07status Active
-
2025-01-31price $307,500
-
2025-01-22price $315,000
-
2025-01-02price $320,000
-
2025-01-02status Active
-
2024-10-15$325,000 Active
-
2024-07-02status Active
-
2024-05-01price $349,000
-
2024-04-26price $369,000
-
2024-04-09$379,000 Active
ⓘ Source: listings_history table (triggers on properties + properties_extension) + one-shot
backfill from property_details.listing_events for pre-trigger history.
Tax reassessment forecast PA · Partial reset (capped growth)
- Current annual tax
- $5,979 · $498/mo
- Projected year-2 tax
- $5,979 · $498/mo
- Expected delta
- $0/yr ($0/mo · 0.0%)
ⓘ Screening estimate from a state-policy table — verify with the county assessor before closing.
Climate risk First Street
- Flood 1/10 Low FEMA zone X (unshaded) · 0% chance over 30 yrs
- Wildfire 4/10 Moderate
- Heat 2/10 Low 7 d/yr ≥90°F today · 15 d/yr by 30 yrs out
- Wind 4/10 Moderate 8% chance of damaging wind over 30 yrs
- Air quality 2/10 Low 1 unhealthy d/yr today · 2 by 30 yrs out
Nearby sold comps map
Loading sold comps map…
Walkable amenities ~0.75 mi
Loading nearby amenities…
Taxation est. · year 1
- Rental income
- $33,600
- − Mortgage interest
- −$14,558
- − Property taxes
- −$5,979
- − Insurance
- −$1,300
- − Repairs & maintenance
- −$2,688
- − Management
- −$2,688
- − HOA
- −$180
- − Depreciation
- −$7,561
- Taxable loss
- −$1,353
- Est. tax savings @ 24.0%
- +$325
- After-tax cash flow
- $3,055/yr
For passive investors: Depreciation is non-cash, so a rental often shows a tax loss while cash-flowing — sheltering income. Rental losses are passive: they offset passive income freely, and up to $25,000/yr can offset ordinary (W-2) income if you actively participate and your MAGI is under $100k (phasing out to $0 by $150k); unused losses carry forward. On sale, claimed depreciation is recaptured at up to 25%, and gains may owe capital-gains tax (a 1031 exchange can defer both). Figures are a year-1 estimate at your 24.0% rate — not tax advice; consult a CPA.
Schools (NCES district)
- District
- Pocono Mountain SD
- NCES district ID
- 4219500
- Math proficiency
- 37% ▼ -5.00%
- Reading proficiency
- 55% ▲ 1.00%
- Median HH income
- $55,317
- Composite
- 39.91/100
- National rank
- #3856
- State rank
- #245 of 539 in PA
Livability — Mount Pocono
- Score
- 77/100
- State rank
- #362
- US rank
- #3166
Category grades
Schools grade is shown separately in the Schools card above.
Census & demographics
- Census place
- Mount Pocono, PA
- Population (ZIP)
- 3,472
Population outlook (Monroe County) Hauer SSP2
- Today (2025)
- 164,099 people
- By 2030
- 161,412 · -1.6%
- By 2040
- 154,616 · -5.8%
- By 2050
- 146,710 · -10.6%
- By 2075
- 140,830 · -14.2%
- By 2100
- 138,472 · -15.6%
Race, ethnicity, and origin ACS 2023
- Neighborhood character
- Highly diverse neighborhood (Simpson 0.70)
- Race & ethnicity
- White 47% Hispanic / Latino 22% Black 15% Asian 9% Two or more races 8%
- Hispanic origin (detail)
- Puerto Rican 7% Dominican 1%
- Common ancestry
- Romanian 3% Italian 2% Hispanic 1%
- Foreign-born
- 17% · Canada
- Languages at home
- 67% English-only · Spanish 19% Other Indo-European 7% Tagalog/Filipino 3%
Political lean MEDSL · Monroe
- 2024 margin
- Toss-up / Even · D 49.1% · R 49.9%
- 2008→2024 swing
- -17.1pp toward R · 2008: 16.3pp · 2024: -0.8pp
- All cycles
- 2024: R+0.8 2020: D+6.4 2016: D+0.3 2012: D+14.0 2008: D+16.3
Not yet ingested
- Civics
- —
Market trends
- HPI YoY
- ▲ 0.63%
- Current HPI
- 179.2541
- Rent YoY
- —
- Metro
- —
- State GDP YoY
- ▲ 1.68%
- F500 in state
- 34
Industry mix (Fortune 500 HQ in PA)
| Industry | F500 HQs | Revenue |
|---|---|---|
| Healthcare | 2 | $309B |
|
||
| Insurance | 2 | $27B |
|
||
| Telecommunications / Media | 1 | $124B |
|
||
| Industrial Distribution | 1 | $22B |
|
||
| Financial Services | 1 | $20B |
|
||
| Chemicals / Materials | 1 | $18B |
|
||
Price history
-31.4% since first listed15 events — show timeline
- 2026-04-10 Pending — PMAR
- 2026-03-17 Listed $259,900 PMAR
- 2025-05-02 Price Changed $299,900 PMAR
- 2025-03-27 Listed $305,000 PMAR
- 2025-03-24 Delisted — PMAR
- 2025-03-07 Relisted — PMAR
- 2025-01-31 Price Changed $307,500 PMAR
- 2025-01-22 Price Changed $315,000 PMAR
- 2025-01-02 Price Changed $320,000 PMAR
- 2025-01-02 Relisted — PMAR
- 2024-10-15 Listed $325,000 PMAR
- 2024-07-02 Relisted — PMAR
- 2024-05-01 Price Changed $349,000 PMAR
- 2024-04-26 Price Changed $369,000 PMAR
- 2024-04-09 Listed $379,000 PMAR
Property tax history
-0.1%/yrLatest (2026): $5,979 · +2.9% YoY. Source: county tax records.
Cash-flow waterfall
monthlySold comps — $/sqft
last 12 mo · ≤1 miLoading sold comps…