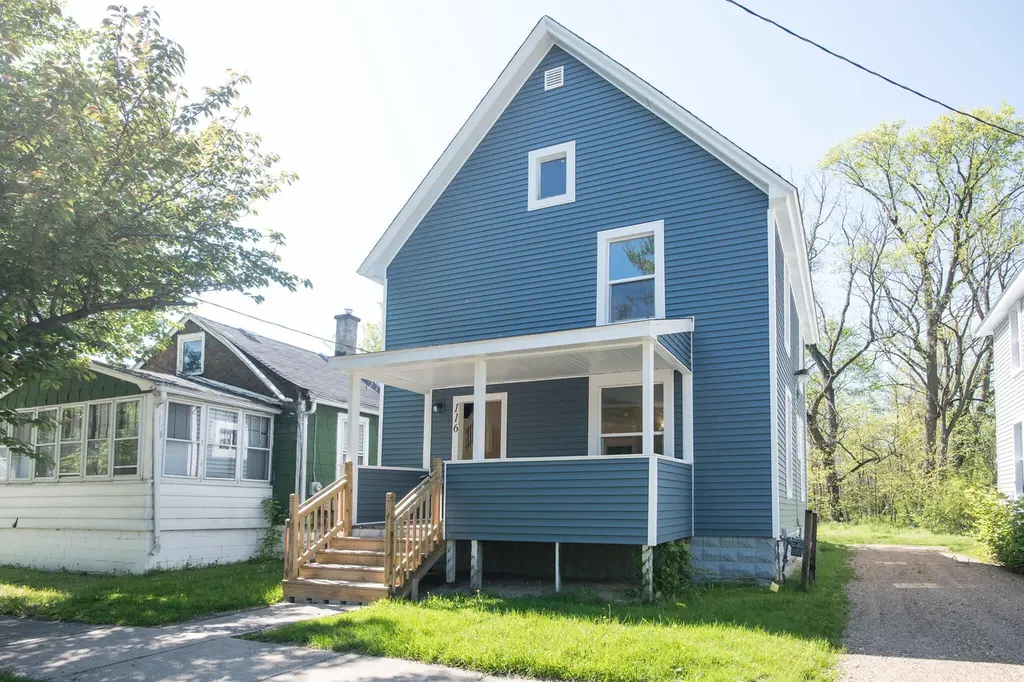
116 E Clay St · Kalamazoo, MI
Flood risk 1/10 · Minimal
- FEMA flood zone
- X (unshaded)
- Chance of flooding over 30 yrs
- 0.0%
- Est. flood insurance / yr
- $507 – $1,088
Fire risk 1/10 · Minimal
- Est. fire insurance / yr
- $784 – $1,456
Heat risk 2/10 · Minimal
- Hot days now (above 100°F)
- 7 days/yr
- Hot days in 30 yrs
- 16 days/yr
Wind risk 2/10 · Minimal
- Chance of severe wind over 30 yrs
- —
Air-quality risk 2/10 · Minimal
- Unhealthy air days now
- 1 days/yr
- Unhealthy air days in 30 yrs
- 2 days/yr
Risk factors via First Street. Map © Google.
Why this score? — see what drove the C- grade
The composite is a weighted blend of 9 inputs, each scored 0–100. Each bar is that input's sub-score; the figure is the points it added to the 100-point composite (weight × sub-score).
- Cash flow +24.9/30.0
- DSCR +8.1/10.0
- 1% rule +6.5/10.0
- Schools +4.7/10.0
- Livability +3.8/5.0
- Condition / age +2.5/5.0
- Rent growth +2.3/5.0
- ARV discount +1.4/15.0
- Appreciation +0.0/10.0
$136,900
🖨 Deal sheet 📄 Offer letter ✓ Due diligence
Listing remarks MLS
Completely renovated, this two-bedroom home with one & one-half baths could be your dream home. It has a new roof, new siding, new double pane windows, new all-electric HVAC, new kitchen cabinets, and new stainless-steel appliances. This house won't need any of those expensive repairs for years! This is a must-see house on Kalamazoo's Northside. Set up a showing today! Preference is given to First-Time Homebuyers or those who have not owned a home in the past 3 years. Buyers must be under 80% of the Area Median Income.
Key facts
- 3,920 sq ft lot
- Built 1905
- Listed 15 days
Property features AI
Exterior
- Utilities: Public water
- Home design: Traditional single-family residence; Built in 1905
- Construction: Vinyl siding; Composition roof; Full basement
- Exterior features: Paved road access; Lot roughly 0.09 acres
Interior
- Kitchen: Dishwasher; Disposal; Microwave; Range; Refrigerator
- Bathrooms: One full bathroom; One half bathroom
- Heating & cooling: Forced air heating; Has cooling
- Interior features: Seven total rooms; Replacement insulated windows
- Laundry & utility: Electric water heater
Neighborhood map
What this means for you Summary
Snapshot
- This is a 3-bed/1.0-bath single-family listed at $137k.
Deal economics
- At list price, monthly cash flow is $296 ($4k/yr) — positive.
- The deal already cash-flows at list — no discount required.
- Meets the 1% rule at list price ($2k rent vs $137k).
- Recommended offer: $135k (1.5% below list) — sets the bar for market timing.
- Cap rate 8.9% vs local median 4.1% in Kalamazoo — top-decile yield for the area; either an underpriced asset or a hidden risk that comps aren't pricing in. Stress-test before assuming the spread holds.
Location & tenants
- Location reads 76/100 on livability (#141 in MI, #3,492 nationally) — a middle-class / working-renter tenant base. Strengths: commute A+, cost of living A+, housing A+; Watch: crime F, employment D-.
- Kalamazoo Public Schools (urban): math 43% / reading 72% proficiency, ranked #71 of 540 in MI (top 13%) — acceptable for families but not a draw, mixed tenant base, ~2y average lease; 66% free/reduced lunch — lower-income household profile, screen leases tightly.
- Market conditions: Rents soft (-0.8%/yr); 77 active listings in the ZIP; 14 comparable units currently listed for rent nearby; rentals at typical pace (median 21d on market — plan ~3-4 weeks tenant-placement turnaround); lower-income renter base — watch delinquency; 339 units permitted in Kalamazoo County in 2024 (22 in 5+ unit buildings).
- At $1,572/mo this rent would consume 48% of the median local household income ($39k/yr) (locally 816% of renters already pay >50% of income on rent) — very limited rent-growth headroom before tenants either downsize or default.
Forward outlook
- Local home prices are declining (-3.0%/yr); year-one equity from $946 of loan paydown is wiped out by about $4k of value loss. Plan a longer hold.
- Kalamazoo County population projected at +18% by 2050 — long-run rental-demand tailwind backs the buy-and-hold thesis.
Negotiation context
- It's been on market 15 days — a 2% lower offer ($135k) is reasonable based on typical stale-listing flexibility.
- 5 sale attempts with the ask held roughly flat each time — persistent listings suggest the price (not the market) is what's stuck; bring a comps-based counter.
Risks & watch-outs
- Watch-outs: built in 1905 — expect roof / HVAC / electrical / plumbing capex.
Questions for the listing agent
- Built in 1905 — when were the roof, HVAC, electrical panel, plumbing, and water heater last replaced?
- Is there a deadline driving the sale (1031 exchange, divorce, estate, relocation)? That informs how much negotiation room exists.
- Crime grade is F in this area — have there been break-ins, vandalism, or insurance claims at this property in the last 3 years? What carrier currently insures it and at what premium?
- What's the average days-on-market for RENTAL listings here right now (not sales)? A rising rental-DOM trend means longer vacancies and softer asking-rent achievability than the comps imply.
- What's the recent tenant-quality profile in this submarket — average credit score on applications, eviction rate, late-payment / NSF rate, and stable-employment percentage? A property-management company in the area should have these aggregated.
- How much new for-sale + rental construction is in the pipeline within 1–3 miles? Heavy new supply typically softens prices + rents 12–24 months out; constrained supply supports both.
Investment metrics
- 1% rule
- 1.15% ✓
- Cap rate
- 8.88%
- Cash-on-cash
- 9.26%
- DSCR
- 1.41
- GRM
- 7.3
CMA / ARV
- ARV (on-the-fly)
- $120,510
- Comps found
- 12
Show comp detail 12 sales within ~0.75 mi
| Address | Dist | Beds/Ba | Sqft | Sold | Price | $/sf | Match |
|---|---|---|---|---|---|---|---|
| 1018 N Rose St | 0.28mi | 4/2.0 (+1) | 1,398 (+4%) | 2mo | $135,000 | $97 | 69 |
| 116 Martin St | 0.18mi | 4/2.0 (+1) | 1,440 (+8%) | 7mo | $190,000 | $132 | 64 |
| 410 W Paterson St | 0.29mi | 3/2.0 | 1,486 (+11%) | 1mo | $129,900 | $87 | 64 |
| 1212 Princeton Ave | 0.33mi | 3/1.0 | 1,200 (-10%) | 6mo | $147,000 | $123 | 63 |
| 302 W Frank St | 0.46mi | 3/1.5 | 1,465 (+9%) | 0mo | $176,000 | $120 | 61 |
| 534 Lulu St | 0.44mi | 4/1.0 (+1) | 1,224 (-9%) | 3mo | $55,000 | $45 | 58 |
| 731 Mabel St | 0.67mi | 4/1.5 (+1) | 1,386 (+4%) | 1mo | $63,000 | $45 | 55 |
| 708 Harrison St | 0.63mi | 4/1.0 (+1) | 1,248 (-7%) | 4mo | $112,000 | $90 | 50 |
| 625 Ada St | 0.69mi | 3/1.0 | 1,202 (-10%) | 1mo | $129,000 | $107 | 50 |
| 2022 N Westnedge Ave | 0.56mi | 3/1.5 | 1,200 (-10%) | 6mo | $105,000 | $88 | 50 |
| 1115 Woodward Ave | 0.72mi | 3/1.0 | 1,144 (-15%) | 1mo | $103,000 | $90 | 41 |
| 716 Elizabeth St | 0.63mi | 4/1.5 (+1) | 1,170 (-13%) | 5mo | $65,000 | $56 | 39 |
Match score weights: distance 35% · size 25% · config 20% · recency 20%. Top-matched comps best support the ARV.
Projected returns pro-forma
-3.0% appreciation · 0.0% rent growth · sell at horizon
- IRR
- -5.7%
- Equity multiple
- 0.79×
- Total profit
- $-7,933
- Equity at exit
- $20,412
- IRR
- -0.2%
- Equity multiple
- 0.99×
- Total profit
- $-362
- Equity at exit
- $11,837
Cash invested: $38,332 (down + closing). Projections, not guarantees.
Landlord ↔ Tenant lean methodology
- Overall (STATE)
- 62 Landlord-Friendly
- State Michigan
- 62 Landlord-Friendly · EVEN
- County
- — inherits STATE
- City
- — inherits STATE
ZIP-level market 49007
- Rents YoY
- -0.8%
- Active inventory
- 77
- Price-to-rent
- 7.3×
Monthly cashflow live
- Estimated rent
- $1,572 high interval (Pro) →
- Mortgage (P&I)
- −$718
- Tax est. 1.5%
- −$171 /mo · $2,054/yr
- Insurance
- −$57
- HOA
- −$0
- Vacancy / Maint / Mgmt
- −$330
- Net cashflow
- $296
Break-even live
UW: 25.0% down · 7.5% · 30yr · 1.5% tax · 5.0% vac · 8.0% maint · 8.0% mgmt
Financing live
Cash to close
- Down payment
- $34,225
- Closing costs
- $4,107
- Reserves months
- —
- Total cash needed
- —
Loan-product check · same deal, 3 products live
Conventional
25% down · 7.5% · 30yr
- Down + closing
- —
- Monthly P&I
- —
- Monthly cashflow
- —
- DSCR
- —
- Eligible?
- —
Personal DTI + credit; lowest rate.
DSCR
20% down · 8.5% · 30yr
- Down + closing
- —
- Monthly P&I
- —
- Monthly cashflow
- —
- DSCR
- —
- Eligible?
- —
No personal income docs; deal must DSCR.
Hard money
10% down · 12.0% · 12mo
- Down + closing
- —
- Monthly P&I
- —
- Monthly cashflow
- —
- DSCR
- —
- Eligible?
- —
Short-term bridge; refi at stabilization.
Rent comps 14 comps
| Address | Beds | Baths | Sqft | Rent | $/sqft | DOM | Units | Dist |
|---|---|---|---|---|---|---|---|---|
| 815 N Pitcher St Unit 12 Kalamazoo, MI | 2.0 | 2.0 | 982 | $1,550 | $1.58 | 20d | 1 | 0.41mi |
| 708 Elizabeth St Kalamazoo, MI | 3.0 | 1.5 | 1128 | $1,250 | $1.11 | 13d | 1 | 0.61mi |
| 525 E Ransom St Kalamazoo, MI | 1.0–2.0 | 1.0–2.0 | 807 | $1,625 | $2.01 | 20d | 1 | 0.64mi |
| 2004 Woodward Ave Kalamazoo, MI | 4.0 | 2.0 | 1710 | $1,500 | $0.88 | 13d | 1 | 0.77mi |
| 310 E Michigan Ave Kalamazoo, MI | 2.0 | 2.0 | 1100 | $1,385 | $1.26 | 20d | 1 | 0.89mi |
| 722 W Kalamazoo Ave Unit 2 Kalamazoo, MI | 3.0 | 1.0 | 1800 | $1,600 | $0.89 | 20d | 1 | 0.90mi |
| 125 S Kalamazoo Mall Kalamazoo, MI | 2.0 | 2.0 | 1833 | $3,088 | $1.68 | 13d | 1 | 0.96mi |
| 2420 Upper Riverview Dr Kalamazoo, MI | 3.0 | 1.0 | 925 | $1,300 | $1.41 | 20d | 1 | 0.99mi |
| 232 Woodward Ave Unit 5 Kalamazoo, MI | 2.0 | 1.0 | 1400 | $999 | $0.71 | 13d | 1 | 1.03mi |
| 816 W Main St Kalamazoo, MI | 3.0 | 1.0 | 1005 | $1,100 | $1.09 | 20d | 1 | 1.09mi |
| 838 W Main St Kalamazoo, MI | 4.0 | 1.0 | 1470 | $1,300 | $0.88 | 20d | 1 | 1.11mi |
| 1403 Sherwood Ave Unit 2 Kalamazoo, MI | 2.0 | 1.0 | 900 | $1,000 | $1.11 | 20d | 1 | 1.17mi |
| 525 S Burdick St Kalamazoo, MI | 2.0 | 2.0 | 1555 | $2,928 | $1.88 | 13d | 2 | 1.27mi |
| 1928 Colgrove Ave Kalamazoo, MI | 1.0–3.0 | 1.0–2.0 | 912 | $1,390 | $1.52 | 13d | 13 | 1.48mi |
Listing history 8 events
-
2026-05-23status Pending
-
2026-05-08$136,900 Active
Show marketing remark (530 chars)
Completely renovated, this two-bedroom home with one & one-half baths could be your dream home. It has a new roof, new siding, new double pane windows, new all-electric HVAC, new kitchen cabinets, and new stainless-steel appliances. This house won't need any of those expensive repairs for years! This is a must-see house on Kalamazoo's Northside. Set up a showing today! Preference is given to First-Time Homebuyers or those who have not owned a home in the past 3 years. Buyers must be under 80% of the Area Median Income.
-
2026-05-08$136,900 Active 530-char remark
Show marketing remark (530 chars)
Completely renovated, this two-bedroom home with one & one-half baths could be your dream home. It has a new roof, new siding, new double pane windows, new all-electric HVAC, new kitchen cabinets, and new stainless-steel appliances. This house won't need any of those expensive repairs for years! This is a must-see house on Kalamazoo's Northside. Set up a showing today! Preference is given to First-Time Homebuyers or those who have not owned a home in the past 3 years. Buyers must be under 80% of the Area Median Income.
-
2026-04-30historical
-
2026-04-30historical
-
2026-02-10$136,900 Active
-
2026-02-10$136,900 Active
ⓘ Source: listings_history table (triggers on properties + properties_extension) + one-shot
backfill from property_details.listing_events for pre-trigger history.
Climate risk First Street
- Flood 1/10 Low FEMA zone X (unshaded) · 0% chance over 30 yrs
- Wildfire 1/10 Low
- Heat 2/10 Low 7 d/yr ≥100°F today · 16 d/yr by 30 yrs out
- Wind 2/10 Low
- Air quality 2/10 Low 1 unhealthy d/yr today · 2 by 30 yrs out
Nearby sold comps map
Loading sold comps map…
Walkable amenities ~0.75 mi
Loading nearby amenities…
Taxation est. · year 1
- Rental income
- $18,863
- − Mortgage interest
- −$7,669
- − Property taxes
- −$2,054
- − Insurance
- −$684
- − Repairs & maintenance
- −$1,509
- − Management
- −$1,509
- − Depreciation
- −$3,983
- Taxable income
- $1,456
- Est. tax owed @ 24.0%
- −$349
- After-tax cash flow
- $3,199/yr
For passive investors: Depreciation is non-cash, so a rental often shows a tax loss while cash-flowing — sheltering income. Rental losses are passive: they offset passive income freely, and up to $25,000/yr can offset ordinary (W-2) income if you actively participate and your MAGI is under $100k (phasing out to $0 by $150k); unused losses carry forward. On sale, claimed depreciation is recaptured at up to 25%, and gains may owe capital-gains tax (a 1031 exchange can defer both). Figures are a year-1 estimate at your 24.0% rate — not tax advice; consult a CPA.
Schools (NCES district)
- District
- Kalamazoo Public Schools
- NCES district ID
- 2619950
- Math proficiency
- 43% ▲ 13.00%
- Reading proficiency
- 72% ▲ 33.00%
- Median HH income
- $35,291
- Composite
- 47.48/100
- National rank
- #2275
- State rank
- #71 of 540 in MI
Livability — Kalamazoo
- Score
- 76/100
- State rank
- #141
- US rank
- #3492
Category grades
Schools grade is shown separately in the Schools card above.
Census & demographics
- Census place
- Kalamazoo, MI
- County
- Kalamazoo County · 224,317 people
- City population
- 121,397
- Metro
- Kalamazoo-Portage, MI
- Population (ZIP)
- 9,836
- Household income
- $39,344
- Rent vs Own
- Severe rent burden
- 816.0
Population outlook (Kalamazoo County) Hauer SSP2
- Today (2025)
- 280,982 people
- By 2030
- 292,068 · +3.9%
- By 2040
- 312,191 · +11.1%
- By 2050
- 331,196 · +17.9%
- By 2075
- 379,021 · +34.9%
- By 2100
- 396,579 · +41.1%
Race, ethnicity, and origin ACS 2023
- Neighborhood character
- Diverse neighborhood (Simpson 0.61)
- Race & ethnicity
- White 44% Black 44% Two or more races 7% Hispanic / Latino 3%
- Common ancestry
- Iranian 3% Romanian 2% Lithuanian 1%
- Foreign-born
- 3% · Canada
- Languages at home
- 94% English-only · Spanish 4% French/Haitian/Cajun 1% Arabic 1%
Political lean MEDSL · Kalamazoo
- 2024 margin
- D (+17.7) · D 58.0% · R 40.3% · Other 1.7%
- 2008→2024 swing
- -1.8pp toward R · 2008: 19.5pp · 2024: 17.7pp
- All cycles
- 2024: D+17.7 2020: D+18.7 2016: D+12.8 2012: D+13.3 2008: D+19.5
Not yet ingested
- Civics
- —
Market trends
- HPI YoY
- ▼ -68.80%
- Current HPI
- 112.4973
- Rent YoY
- ▼ -0.85%
- Metro
- Kalamazoo-Portage, MI
- State GDP YoY
- ▲ 1.37%
- F500 in state
- 28
Industry mix (Fortune 500 HQ in MI)
| Industry | F500 HQs | Revenue |
|---|---|---|
| Automotive Parts | 3 | $48B |
|
||
| Automotive | 2 | $372B |
|
||
| Chemicals | 1 | $45B |
|
||
| Automotive Retail | 1 | $29B |
|
||
| Healthcare / Medical Devices | 1 | $23B |
|
||
| Automotive Technology | 1 | $20B |
|
||
Price history
+0.0% since first listed8 events — show timeline
- 2026-05-23 Pending — SW Michigan MLS
- 2026-05-08 Listed $136,900 REALCOMP
- 2026-05-08 Listed $136,900 MiRealSource-MiMLS
- 2026-05-08 Listed $136,900 SW Michigan MLS
- 2026-04-30 Listing Removed — REALCOMP
- 2026-04-30 Listing Removed — MiRealSource-MiMLS
- 2026-02-10 Listed $136,900 REALCOMP
- 2026-02-10 Listed $136,900 MiRealSource-MiMLS
Property tax history
-37.8%/yrLatest (2024): $115 · -95.1% YoY. Source: county tax records.
Cash-flow waterfall
monthlySold comps — $/sqft
last 12 mo · ≤1 miLoading sold comps…