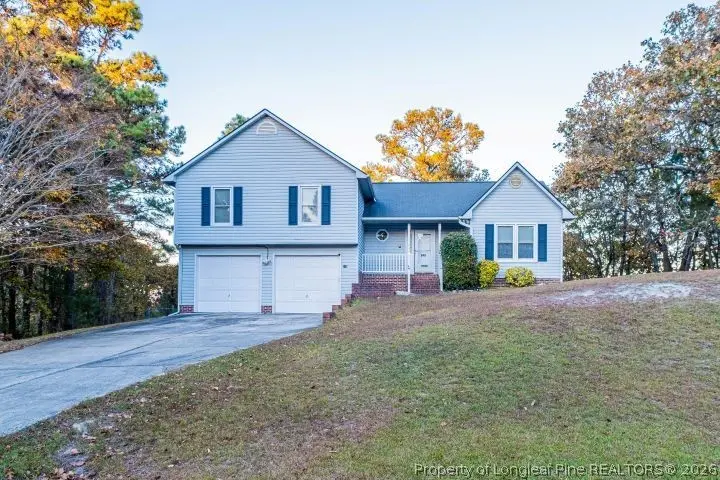
648 Lakeridge Dr · Spout Springs, NC
Flood risk 1/10 · Minimal
- FEMA flood zone
- X (unshaded)
- Chance of flooding over 30 yrs
- 0.0%
- Est. flood insurance / yr
- $507 – $1,088
Fire risk 7/10 · Major
- Est. fire insurance / yr
- $906 – $1,684
Heat risk 7/10 · Major
- Hot days now (above 107°F)
- 7 days/yr
- Hot days in 30 yrs
- 16 days/yr
Wind risk 6/10 · Moderate
- Chance of severe wind over 30 yrs
- 64.0%
Air-quality risk 1/10 · Minimal
- Unhealthy air days now
- 0 days/yr
- Unhealthy air days in 30 yrs
- 0 days/yr
Risk factors via First Street. Map © Google.
Why this score? — see what drove the D- grade
The composite is a weighted blend of 9 inputs, each scored 0–100. Each bar is that input's sub-score; the figure is the points it added to the 100-point composite (weight × sub-score).
- Cash flow +14.4/30.0
- ARV discount +5.4/15.0
- DSCR +4.4/10.0
- Rent growth +3.2/5.0
- 1% rule +3.0/10.0
- Schools +3.0/10.0
- Livability +2.5/5.0
- Condition / age +2.5/5.0
- Appreciation +0.0/10.0
$245,000
🖨 Deal sheet 📄 Offer letter ✓ Due diligence
Listing remarks
1.5-story home a quiet neighborhood on a spacious lot. 3 bedrooms and 2 full bathrooms, offering ample space for comfortable living. The formal dining room is perfect for hosting gatherings and special occasions. With its inviting atmosphere and picturesque surroundings, this property is ideal for those seeking a peaceful retreat. The large lot provides plenty of outdoor space for relaxation and recreation. Don't miss the opportunity to make this house your home. New vanities in both bathrooms, new carpet and paint in living room and ceilings, garage has new paint as well. This is a court ordered sale with a 10 day upset bid period. Seller is Ryan J. Adams, as commissioner in Harnett County
Key facts
- Formal dining room
- New carpet
- Spacious lot
Tags
Property features AI
Exterior
- Parking: Attached carport; 2 covered spaces; 2-car garage
- Utilities: Public water; Septic tank and holding tank
- Home design: Single family residence; One and one-half story; Aluminum and vinyl siding; RA-20 (Residential Agricultural) zoning
- Construction: Aluminum siding; Vinyl siding
- Exterior features: Private yard; Back yard fencing; Cleared lot; Paved road access
Interior
- Kitchen: Dishwasher; Refrigerator; Microwave; Cooktop; Range; Exhaust fan; Water heater
- Bedrooms: Bedrooms with walk-in closets
- Flooring: Carpet; Vinyl
- Bathrooms: 2 full bathrooms
- Heating & cooling: Central air; Ceiling fans; Electric heating; Heat pump
- Interior features: Ceiling fans; Eat-in kitchen; Walk-in closets; Wood-burning fireplace in the den; Crawl space
- Laundry & utility: Washer hookup in garage; Washer included
Neighborhood map
What this means for you Summary
Snapshot
- This is a 3-bed/2.0-bath single-family listed at $245k.
Deal economics
- At list price, monthly cash flow is $51 ($618/yr) — positive.
- The deal already cash-flows at list — no discount required.
- To meet the 1% rule (rent ≥ 1% of price), the offer needs to be $197k (19.6% below list).
- Recommended offer: $197k (19.6% below list) — sets the bar for 1% rule.
- Cap rate 6.5% vs local median 4.1% in Spout Springs — top-decile yield for the area; either an underpriced asset or a hidden risk that comps aren't pricing in. Stress-test before assuming the spread holds.
Location & tenants
- Location reads: area grade D — affects rentability + tenant quality, not the cash-flow math above.
- Harnett County Schools (rural): math 31% / reading 39% proficiency, ranked #130 of 178 in NC (top 73%) — families likely to look elsewhere, expect single-tenant / working-renter base with shorter leases.
- Zoned schools: Johnsonville Elementary (math 28% / reading 31%, grade F, #975 of 1,410 statewide, top 71%, 475 students, 99% FRL); Highland Middle (math 34% / reading 41%, grade F, #256 of 475 statewide, top 55%, 875 students, 64% FRL); Western Harnett High (math 57% / reading 58%, grade C, #245 of 535 statewide, top 46%, 1,386 students, 60% FRL) — zoned schools average 74% FRL vs 51% district-wide (24 pts higher); higher-poverty schools than district average — tighter screening recommended.
- Market conditions: Rents rising (+3.0%/yr); 244 active listings in the ZIP; solid renter incomes; 2,080 units permitted in Harnett County in 2024 (12 in 5+ unit buildings).
- This rent runs 31% of the median local income ($75k/yr) — at the standard rent-burdened threshold; future hikes will face affordability resistance.
Forward outlook
- Local home prices are declining (-3.0%/yr); year-one equity from $2k of loan paydown is wiped out by about $7k of value loss. Plan a longer hold.
- Harnett County population projected at +42% by 2050 — long-run rental-demand tailwind backs the buy-and-hold thesis.
Negotiation context
- It's been on market 29 days — a 2% lower offer ($241k) is reasonable based on typical stale-listing flexibility.
- 3 sale attempts with the ask held roughly flat each time — persistent listings suggest the price (not the market) is what's stuck; bring a comps-based counter.
Risks & watch-outs
- Climate carrying-cost: major wind risk, 64% chance of damaging wind over 30y; major wildfire risk; extreme-heat days projected 7→16/yr by 2055 (HVAC capex compounding) — expect insurance premiums to compound above CPI over the hold.
Questions for the listing agent
- Is there a deadline driving the sale (1031 exchange, divorce, estate, relocation)? That informs how much negotiation room exists.
- The area grade is low — what's the realistic commute time and amenity access for the typical tenant pool here? Any planned neighborhood developments (good or bad) we should know about?
- What's the average days-on-market for RENTAL listings here right now (not sales)? A rising rental-DOM trend means longer vacancies and softer asking-rent achievability than the comps imply.
- What's the recent tenant-quality profile in this submarket — average credit score on applications, eviction rate, late-payment / NSF rate, and stable-employment percentage? A property-management company in the area should have these aggregated.
- How much new for-sale + rental construction is in the pipeline within 1–3 miles? Heavy new supply typically softens prices + rents 12–24 months out; constrained supply supports both.
Investment metrics
- 1% rule
- 0.80% ✗
- Cap rate
- 6.55%
- Cash-on-cash
- 0.90%
- DSCR
- 1.04
- GRM
- 10.4
CMA / ARV
- ARV (on-the-fly)
- $234,080
- Comps found
- 5
Show comp detail 5 sales within ~0.75 mi
| Address | Dist | Beds/Ba | Sqft | Sold | Price | $/sf | Match |
|---|---|---|---|---|---|---|---|
| 235 Lakeridge Dr | 0.23mi | 3/2.0 | 1,738 (+13%) | 5mo | $250,000 | $144 | 64 |
| 366 Pineridge Dr | 0.48mi | 3/2.5 | 1,645 (+7%) | 5mo | $275,000 | $167 | 60 |
| 22 Woodridge Ln | 0.29mi | 3/2.0 | 1,746 (+13%) | 12mo | $264,900 | $152 | 54 |
| 234 Sunridge Dr | 0.39mi | 3/2.0 | 1,770 (+15%) | 10mo | $289,900 | $164 | 49 |
| 56 Elijah Ct | 0.61mi | 3/2.0 | 1,355 (-12%) | 15mo | $185,000 | $137 | 39 |
Match score weights: distance 35% · size 25% · config 20% · recency 20%. Top-matched comps best support the ARV.
Projected returns pro-forma
-3.0% appreciation · 2.95% rent growth · sell at horizon
- IRR
- -15.0%
- Equity multiple
- 0.47×
- Total profit
- $-36,608
- Equity at exit
- $36,530
- IRR
- -6.5%
- Equity multiple
- 0.59×
- Total profit
- $-28,413
- Equity at exit
- $21,183
Cash invested: $68,600 (down + closing). Projections, not guarantees.
Landlord ↔ Tenant lean methodology
- Overall (STATE)
- 85 Strongly Landlord-Friendly
- State North Carolina
- 85 Strongly Landlord-Friendly · R+3
- County
- — inherits STATE
- City
- — inherits STATE
ZIP-level market 28326
- Home prices YoY
- -9.9%
- Rents YoY
- 3.0%
- Active inventory
- 244
- Price-to-rent
- 10.4×
Monthly cashflow live
- Estimated rent
- $1,969 medium interval (Pro) →
- Mortgage (P&I)
- −$1,285
- Tax from tax record
- −$117 /mo · $1,406/yr
- Insurance
- −$102
- HOA
- −$0
- Vacancy / Maint / Mgmt
- −$414
- Net cashflow
- $51
Break-even live
UW: 25.0% down · 7.5% · 30yr · 1.5% tax · 5.0% vac · 8.0% maint · 8.0% mgmt
Financing live
Cash to close
- Down payment
- $61,250
- Closing costs
- $7,350
- Reserves months
- —
- Total cash needed
- —
Loan-product check · same deal, 3 products live
Conventional
25% down · 7.5% · 30yr
- Down + closing
- —
- Monthly P&I
- —
- Monthly cashflow
- —
- DSCR
- —
- Eligible?
- —
Personal DTI + credit; lowest rate.
DSCR
20% down · 8.5% · 30yr
- Down + closing
- —
- Monthly P&I
- —
- Monthly cashflow
- —
- DSCR
- —
- Eligible?
- —
No personal income docs; deal must DSCR.
Hard money
10% down · 12.0% · 12mo
- Down + closing
- —
- Monthly P&I
- —
- Monthly cashflow
- —
- DSCR
- —
- Eligible?
- —
Short-term bridge; refi at stabilization.
Listing history 19 events
-
2026-06-18days on market $245,000 Active 29 DOM
-
2026-06-17days on market $245,000 Active 28 DOM
-
2026-06-16days on market $245,000 Active 27 DOM
-
2026-06-15days on market $245,000 Active 26 DOM
-
2026-06-14days on market $245,000 Active 24 DOM
-
2026-06-10days on market $245,000 Active 21 DOM
-
2026-06-09days on market $245,000 Active 20 DOM
-
2026-06-08days on market $245,000 Active 19 DOM
-
2026-06-07days on market $245,000 Active 18 DOM
-
2026-06-05days on market $245,000 Active 15 DOM
-
2026-06-03days on market $245,000 Active 14 DOM
-
2026-06-02days on market $245,000 Active 13 DOM
-
2026-06-01days on market $245,000 Active 12 DOM
-
2026-05-31days on market $245,000 Active 11 DOM
-
2026-05-30days on market $245,000 Active 10 DOM
-
2026-05-20$245,000 Active
-
2026-02-21status Active
-
2026-01-22status Pending
-
2025-11-08$245,000 Active
ⓘ Source: listings_history table (triggers on properties + properties_extension) + one-shot
backfill from property_details.listing_events for pre-trigger history.
Tax reassessment forecast NC · Resets to sale price
- Current annual tax
- $1,406 · $117/mo
- Projected year-2 tax
- $2,009 · $167/mo
- Expected delta
- +$603/yr (+$50/mo · 42.8%)
ⓘ Screening estimate from a state-policy table — verify with the county assessor before closing.
Climate risk First Street
- Flood 1/10 Low FEMA zone X (unshaded) · 0% chance over 30 yrs
- Wildfire 7/10 Severe
- Heat 7/10 Severe 7 d/yr ≥107°F today · 16 d/yr by 30 yrs out
- Wind 6/10 Major 64% chance of damaging wind over 30 yrs
- Air quality 1/10 Low 0 unhealthy d/yr today · 0 by 30 yrs out
Nearby sold comps map
Loading sold comps map…
Walkable amenities ~0.75 mi
Loading nearby amenities…
Taxation est. · year 1
- Rental income
- $23,629
- − Mortgage interest
- −$13,724
- − Property taxes
- −$1,406
- − Insurance
- −$1,225
- − Repairs & maintenance
- −$1,890
- − Management
- −$1,890
- − Depreciation
- −$7,127
- Taxable loss
- −$3,634
- Est. tax savings @ 24.0%
- +$872
- After-tax cash flow
- $1,490/yr
For passive investors: Depreciation is non-cash, so a rental often shows a tax loss while cash-flowing — sheltering income. Rental losses are passive: they offset passive income freely, and up to $25,000/yr can offset ordinary (W-2) income if you actively participate and your MAGI is under $100k (phasing out to $0 by $150k); unused losses carry forward. On sale, claimed depreciation is recaptured at up to 25%, and gains may owe capital-gains tax (a 1031 exchange can defer both). Figures are a year-1 estimate at your 24.0% rate — not tax advice; consult a CPA.
Schools (NCES district)
- District
- Harnett County Schools
- NCES district ID
- 3702010
- Math proficiency
- 31% ▼ -2.00%
- Reading proficiency
- 39% ▼ -1.00%
- Median HH income
- $45,400
- Composite
- 29.88/100
- National rank
- #6397
- State rank
- #130 of 178 in NC
Livability — Spout Springs
No livability data for this city. (Only ~50 U.S. cities are tracked.)
Census & demographics
- County
- Harnett County · 125,715 people
- Metro
- Fayetteville, NC
- Population (ZIP)
- 26,068
- Household income
- $75,431
- Rent vs Own
- Severe rent burden
- 456.0
Population outlook (Harnett County) Hauer SSP2
- Today (2025)
- 153,758 people
- By 2030
- 166,581 · +8.3%
- By 2040
- 192,741 · +25.4%
- By 2050
- 218,332 · +42.0%
- By 2075
- 275,422 · +79.1%
- By 2100
- 313,511 · +103.9%
Race, ethnicity, and origin ACS 2023
- Neighborhood character
- Diverse neighborhood (Simpson 0.64)
- Race & ethnicity
- White 52% Black 27% Hispanic / Latino 12% Two or more races 8% Asian 1%
- Hispanic origin (detail)
- Mexican 5% Puerto Rican 6%
- Common ancestry
- Slovak 3% Lithuanian 3% Serbian 2%
- Foreign-born
- 4% · Canada
- Languages at home
- 91% English-only · Spanish 7%
Political lean MEDSL · Harnett
- 2024 margin
- Strong R (+25.1) · D 36.9% · R 62.0% · Other 1.1%
- 2008→2024 swing
- -8.4pp toward R · 2008: -16.7pp · 2024: -25.1pp
- All cycles
- 2024: R+25.1 2020: R+22.4 2016: R+24.1 2012: R+19.4 2008: R+16.7
Not yet ingested
- Civics
- —
Market trends
- HPI YoY
- ▼ -24.96%
- Current HPI
- 226.8295
- Rent YoY
- ▲ 2.95%
- Metro
- Fayetteville, NC
- State GDP YoY
- ▲ 3.28%
- F500 in state
- 26
Industry mix (Fortune 500 HQ in NC)
| Industry | F500 HQs | Revenue |
|---|---|---|
| Financial Services | 2 | $213B |
|
||
| Retail | 2 | $95B |
|
||
| Industrial Conglomerate | 1 | $38B |
|
||
| Metals / Steel | 1 | $35B |
|
||
| Utilities | 1 | $30B |
|
||
| Industrial Machinery | 1 | $19B |
|
||
Price history
+0.0% since first listed4 events — show timeline
- 2026-05-20 Listed $245,000 LPRMLS
- 2026-02-21 Relisted — LPRMLS
- 2026-01-22 Pending — LPRMLS
- 2025-11-08 Listed $245,000 LPRMLS
Property tax history
+5.0%/yrLatest (2025): $1,406 · +0.0% YoY. Source: county tax records.
Cash-flow waterfall
monthlySold comps — $/sqft
last 12 mo · ≤1 miLoading sold comps…