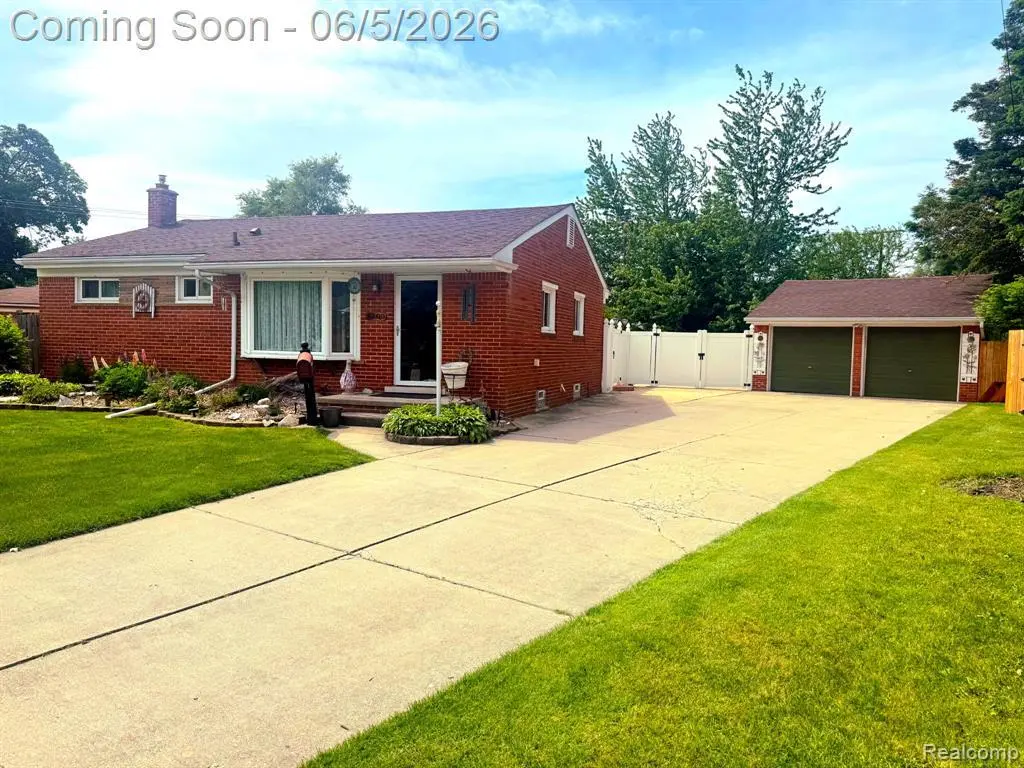
4300 Evans St · Wayne, MI
Flood risk 1/10 · Minimal
- FEMA flood zone
- X (unshaded)
- Chance of flooding over 30 yrs
- 0.0%
- Est. flood insurance / yr
- $473 – $860
Fire risk 2/10 · Minimal
- Est. fire insurance / yr
- $784 – $1,456
Heat risk 3/10 · Minor
- Hot days now (above 97°F)
- 7 days/yr
- Hot days in 30 yrs
- 15 days/yr
Wind risk 2/10 · Minimal
- Chance of severe wind over 30 yrs
- —
Air-quality risk 2/10 · Minimal
- Unhealthy air days now
- 1 days/yr
- Unhealthy air days in 30 yrs
- 3 days/yr
Risk factors via First Street. Map © Google.
Why this score? — see what drove the F grade
The composite is a weighted blend of 9 inputs, each scored 0–100. Each bar is that input's sub-score; the figure is the points it added to the 100-point composite (weight × sub-score).
- Cash flow +7.1/30.0
- Livability +3.6/5.0
- Rent growth +2.5/5.0
- Condition / age +2.5/5.0
- Schools +1.6/10.0
- 1% rule +1.3/10.0
- DSCR +1.3/10.0
- ARV discount +0.0/15.0
- Appreciation +0.0/10.0
$199,900
🖨 Deal sheet (PDF) 📄 Offer letter ✓ Due diligence
Listing remarks
* * Offer Deadline Sunday, June 7 at Noon. Responses by Monday June 8 at 6PM * * Move in ready, Meticulously cared for full brick ranch! This home features oversized rear yard, 100% fenced in! Rear patio features stamped concrete and a convenient shade awning! The finished basement has bonus heat with wall heater for large holiday gatherings. Full basement features an open lay out with storage, 1/2 bath and 2 extra large rooms with large closet space, great for an office/or craft rooms! Detached 2-Car garage with 3 car wide concrete drive, * * * * space for many vehicles * * * * bonus street parking on partial cul-de-sac corner lot. Window treatments and blinds, All appliances in
Key facts
- 6,970 sq ft lot
- 2 garage spots
- Built 1956
Property features AI
Exterior
- Parking: Detached 2-car garage with electric and garage door opener
- Utilities: Public water; Natural gas; Electric service (implied by electric in garage)
- Home design: Residential, single-story home; Built in 1956; Basement present
- Construction: Brick construction; Basement foundation
- Exterior features: Brick exterior; Fenced yard; Patio; Frontage approximately 29 feet; Paved street access; Pets allowed
Interior
- Kitchen: Wood flooring; Kitchen approximately 9 x 11; Range/Oven; Microwave; Dishwasher
- Bedrooms: Bedroom 1 (Entry level) — 13 x 11, wood flooring; Bedroom 2 (Entry level) — 13 x 9, carpet; Bedroom 3 (Entry level) — width 11, wood flooring
- Flooring: Wood flooring in kitchen and most bedrooms; Carpet in living room and one bedroom
- Bathrooms: 1 full bathroom; 2 total baths/lavatories; Lavatory located in basement
- Heating & cooling: Forced air heating; Central air conditioning; Natural gas heating fuel; Gas water heater
- Interior features: Total of 8 rooms; Finished basement
- Laundry & utility: Laundry room in basement (about 10 x 10); Washer; Dryer
Neighborhood map
What this means for you Summary
Snapshot
- This is a 3-bed/1.0-bath single-family listed at $200k.
Deal economics
- At list price, monthly cash flow is $-282 ($-3k/yr) — negative.
- To cash-flow at today's rent, offer at most $150k (24.9% below list).
- To meet the 1% rule (rent ≥ 1% of price), the offer needs to be $125k (37.4% below list).
- Recommended offer: $125k (37.4% below list) — sets the bar for 1% rule.
Location & tenants
- Location reads 72/100 on livability (#252 in MI) — a middle-class / working-renter tenant base. Strengths: commute A+, cost of living A+, housing A+; Watch: schools F, crime F, employment D-.
- Wayne-Westland Community School District (suburban): math 11% / reading 27% proficiency, ranked #474 of 540 in MI (top 88%) — low school quality limits family demand, transient renter base, plan for 1-2y turnover.
- Market conditions: 56 active listings in the ZIP; 25 comparable units currently listed for rent nearby; rentals at typical pace (median 19d on market — plan ~3-4 weeks tenant-placement turnaround); 40% of comp listings sitting > 30 days — soft ceiling on asking rent; 2,639 units permitted in Wayne County in 2024 (1,216 in 5+ unit buildings).
Forward outlook
- Local home prices are declining (-3.0%/yr); year-one equity from $1k of loan paydown is wiped out by about $6k of value loss. Plan a longer hold.
- Wayne County population projected at -17% by 2050 — secular population decline; favor cash flow + early exit over multi-decade hold.
Negotiation context
- Only 4 days on market — expect competitive offers; lowballing is unlikely to land.
- Current owner paid $62k; list at $200k implies a 222% gain — meaningful room to come down on a strong offer.
Risks & watch-outs
- Watch-outs: built in 1956 — expect roof / HVAC / electrical / plumbing capex.
Questions for the listing agent
- What do current leases actually rent for vs. the listed asking? Can we see a recent rent roll and the last 12 months of T-12 income?
- Built in 1956 — when were the roof, HVAC, electrical panel, plumbing, and water heater last replaced?
- Is there a deadline driving the sale (1031 exchange, divorce, estate, relocation)? That informs how much negotiation room exists.
- Schools are F-rated, which usually means shorter tenancies and higher turnover. Who's the typical renter profile here, and what's been the actual vacancy rate?
- Crime grade is F in this area — have there been break-ins, vandalism, or insurance claims at this property in the last 3 years? What carrier currently insures it and at what premium?
- The area grade is low — what's the realistic commute time and amenity access for the typical tenant pool here? Any planned neighborhood developments (good or bad) we should know about?
- What's the average days-on-market for RENTAL listings here right now (not sales)? A rising rental-DOM trend means longer vacancies and softer asking-rent achievability than the comps imply.
- What's the recent tenant-quality profile in this submarket — average credit score on applications, eviction rate, late-payment / NSF rate, and stable-employment percentage? A property-management company in the area should have these aggregated.
- How much new for-sale + rental construction is in the pipeline within 1–3 miles? Heavy new supply typically softens prices + rents 12–24 months out; constrained supply supports both.
Investment metrics
- 1% rule
- 0.63% ✗
- Cap rate
- 4.60%
- Cash-on-cash
- -6.04%
- DSCR
- 0.73
- GRM
- 13.3
CMA / ARV
- ARV (on-the-fly)
- $139,720
- Comps found
- 12
Show comp detail 12 sales within ~0.75 mi
| Address | Dist | Beds/Ba | Sqft | Sold | Price | $/sf | Match |
|---|---|---|---|---|---|---|---|
| 33988 Richard St | 0.45mi | 3/1.0 | 1,022 (+2%) | 4mo | $180,000 | $176 | 72 |
| 4643 S Hubbard St | 0.54mi | 3/1.0 | 1,020 (+2%) | 4mo | $200,000 | $196 | 68 |
| 34084 Currier St | 0.61mi | 3/1.0 | 1,014 (+2%) | 4mo | $170,700 | $168 | 66 |
| 4537 Winifred St | 0.63mi | 3/1.0 | 1,024 (+3%) | 2mo | $95,000 | $93 | 64 |
| 4173 Columbus St | 0.32mi | 2/1.0 (-1) | 918 (-8%) | 3mo | $110,000 | $120 | 64 |
| 5109 S Hubbard St | 0.62mi | 3/1.0 | 1,020 (+2%) | 4mo | $85,000 | $83 | 64 |
| 4004 Howe Rd | 0.31mi | 3/2.0 | 1,104 (+11%) | 2mo | $152,000 | $138 | 62 |
| 4052 Howe Rd | 0.30mi | 3/2.0 | 1,104 (+11%) | 3mo | $155,000 | $140 | 62 |
| 32360 Carlisle Pkwy | 0.62mi | 3/1.0 | 961 (-4%) | 4mo | $90,000 | $94 | 61 |
| 4827 Winifred St | 0.67mi | 3/1.0 | 1,020 (+2%) | 4mo | $170,000 | $167 | 61 |
| 3963 S Hubbard St | 0.53mi | 3/1.0 | 1,088 (+9%) | 1mo | $175,000 | $161 | 59 |
| 3953 Niagara St | 0.71mi | 3/1.0 | 1,088 (+9%) | 6mo | $145,000 | $133 | 47 |
Match score weights: distance 35% · size 25% · config 20% · recency 20%. Top-matched comps best support the ARV.
Projected returns pro-forma
-3.0% appreciation · 3.0% rent growth · sell at horizon
- IRR
- -26.7%
- Equity multiple
- 0.10×
- Total profit
- $-50,379
- Equity at exit
- $29,806
- IRR
- -24.3%
- Equity multiple
- -0.20×
- Total profit
- $-67,168
- Equity at exit
- $17,284
Cash invested: $55,972 (down + closing). Projections, not guarantees.
Landlord ↔ Tenant lean methodology
- Overall (STATE)
- 62 Landlord-Friendly
- State Michigan
- 62 Landlord-Friendly · EVEN
- County
- — inherits STATE
- City
- — inherits STATE
ZIP-level market 48184
- Active inventory
- 56
- Price-to-rent
- 13.3×
Monthly cashflow live
- Estimated rent
- $1,250 high interval (Pro) →
- Mortgage (P&I)
- −$1,048
- Tax from tax record
- −$138 /mo · $1,655/yr
- Insurance
- −$83
- HOA
- −$0
- Vacancy / Maint / Mgmt
- −$263
- Net cashflow
- $-282
Break-even live
Sensitivity live
| Price | -10% $-168 | -5% $-225 | +0% $-282 | +5% $-338 | +10% $-395 |
|---|---|---|---|---|---|
| Rent | -10% $-380 | -5% $-331 | +0% $-282 | +5% $-232 | +10% $-183 |
| Rate | -1.0pp $-181 | -0.5pp $-231 | base $-282 | +0.5pp $-333 | +1.0pp $-386 |
UW: 25.0% down · 7.5% · 30yr · 1.5% tax · 5.0% vac · 8.0% maint · 8.0% mgmt
Financing live
Cash to close
- Down payment
- $49,975
- Closing costs
- $5,997
- Reserves months
- —
- Total cash needed
- —
Loan-product check · same deal, 3 products live
Conventional
25% down · 7.5% · 30yr
- Down + closing
- —
- Monthly P&I
- —
- Monthly cashflow
- —
- DSCR
- —
- Eligible?
- —
Personal DTI + credit; lowest rate.
DSCR
20% down · 8.5% · 30yr
- Down + closing
- —
- Monthly P&I
- —
- Monthly cashflow
- —
- DSCR
- —
- Eligible?
- —
No personal income docs; deal must DSCR.
Hard money
10% down · 12.0% · 12mo
- Down + closing
- —
- Monthly P&I
- —
- Monthly cashflow
- —
- DSCR
- —
- Eligible?
- —
Short-term bridge; refi at stabilization.
Rent comps 25 comps
| Address | Beds | Baths | Sqft | Rent | $/sqft | DOM | Units | Dist |
|---|---|---|---|---|---|---|---|---|
| 33095 Forest St Wayne, MI | 1.0–2.0 | 1.0 | 815 | $1,142 | $1.40 | 3d | 5 | 0.15mi |
| 4924 Howe Rd Wayne, MI | 3.0 | 1.0 | 1022 | $1,300 | $1.27 | 18d | 1 | 0.41mi |
| 34420 Sims St Unit 14 Wayne, MI | 2.0 | 1.0 | 800 | $900 | $1.12 | 44d | 1 | 0.61mi |
| 34420 Sims St Unit 11 Wayne, MI | 2.0 | 1.0 | 800 | $849 | $1.06 | 5d | 1 | 0.62mi |
| 34639 Brush St Wayne, MI | 2.0 | 1.0 | 780 | $1,200 | $1.54 | 44d | 1 | 0.65mi |
| 5672 Howe Rd Unit 15 Wayne, MI | 2.0 | 1.0 | 700 | $850 | $1.21 | 18d | 1 | 0.68mi |
| 33000 Parkhill St Wayne, MI | 1.0–2.0 | 1.0–1.5 | 800 | $1,240 | $1.55 | 25d | 1 | 0.74mi |
| 3741 S Wayne Rd Wayne, MI | 2.0 | 1.5 | 1114 | $1,500 | $1.35 | 0d | 1 | 0.83mi |
| 34510 Van Born Rd Wayne, MI | 2.0 | 1.0 | 990 | $1,325 | $1.34 | 15d | 1 | 0.86mi |
| 32860 Mecosta St Unit 1 Westland, MI | 2.0 | 1.0 | 900 | $1,200 | $1.33 | 44d | 1 | 0.95mi |
| 32860 Mecosta St Westland, MI | 2.0 | 1.0 | 1000 | $1,150 | $1.15 | 44d | 1 | 0.95mi |
| 2758 Ackley Ave Westland, MI | 2.0 | 1.0 | 656 | $1,175 | $1.79 | 0d | 3 | 0.99mi |
| 33507 Berville Ct Westland, MI | 2.0 | 1.5 | 907 | $1,350 | $1.49 | 3d | 1 | 1.01mi |
| 34039 Cambria Ct Westland, MI | 2.0 | 1.0 | 836 | $1,395 | $1.67 | 44d | 1 | 1.03mi |
| 34630 Glenwood Rd Westland, MI | 2.0 | 1.0 | 710 | $1,150 | $1.62 | 44d | 1 | 1.06mi |
| 35505 E Michigan Ave Unit 1 Wayne, MI | 2.0 | 1.0 | 780 | $775 | $0.99 | 44d | 1 | 1.08mi |
| 4916 S Wayne Rd Unit 1 Wayne, MI | 2.0 | 1.0 | 650 | $975 | $1.50 | 13d | 1 | 1.11mi |
| 2310 Deerfield Ct Westland, MI | 3.0 | 1.5 | 1100 | $1,125 | $1.02 | 44d | 1 | 1.13mi |
| 35390 Van Born Rd #103 Wayne, MI | 2.0 | 1.0 | 925 | $1,100 | $1.19 | 44d | 1 | 1.14mi |
| 2264 Delton Ct Westland, MI | 3.0 | 1.5 | 1076 | $1,300 | $1.21 | 15d | 1 | 1.16mi |
| 2036 Alberta St Westland, MI | 3.0 | 1.0 | 936 | $1,325 | $1.42 | 44d | 1 | 1.19mi |
| 35700 E Michigan Ave Wayne, MI | 2.0 | 1.0 | 701 | $1,060 | $1.51 | 5d | 6 | 1.20mi |
| 2040 Dryden St Westland, MI | 3.0 | 1.0 | 1100 | $1,150 | $1.05 | 18d | 1 | 1.24mi |
| 5228 Fletcher St Wayne, MI | 3.0 | 1.0 | 900 | $1,750 | $1.94 | 0d | 1 | 1.34mi |
| 31809 Tuscola Ct Westland, MI | 3.0 | 1.0 | 1078 | $1,400 | $1.30 | 0d | 1 | 1.39mi |
Listing history 6 events
-
2026-06-08statusdays on market $199,900 Pending 4 DOM
-
2026-06-07statusdays on market $199,900 Active 3 DOM
-
2026-06-04days on market $199,900 Coming Soon 2 DOM
-
2026-06-03remarks 699-char remark
-
2026-06-02remarks 293-char remark
-
2026-06-02$199,900 Coming Soon 1 DOM
ⓘ Source: listings_history table (triggers on properties + properties_extension) + one-shot
backfill from property_details.listing_events for pre-trigger history.
Tax reassessment forecast MI · Partial reset (capped growth)
- Current annual tax
- $1,655 · $138/mo
- Projected year-2 tax
- $2,367 · $197/mo
- Expected delta
- +$712/yr (+$59/mo · 43.0%)
ⓘ Screening estimate from a state-policy table — verify with the county assessor before closing.
Climate risk First Street
- Flood 1/10 Low FEMA zone X (unshaded) · 0% chance over 30 yrs
- Wildfire 2/10 Low
- Heat 3/10 Moderate 7 d/yr ≥97°F today · 15 d/yr by 30 yrs out
- Wind 2/10 Low
- Air quality 2/10 Low 1 unhealthy d/yr today · 3 by 30 yrs out
Nearby sold comps map
Loading sold comps map…
Walkable amenities ~0.75 mi
Loading nearby amenities…
Taxation est. · year 1
- Rental income
- $15,006
- − Mortgage interest
- −$11,198
- − Property taxes
- −$1,655
- − Insurance
- −$1,000
- − Repairs & maintenance
- −$1,200
- − Management
- −$1,200
- − Depreciation
- −$5,815
- Taxable loss
- −$7,062
- Est. tax savings @ 24.0%
- +$1,695
- After-tax cash flow
- $-1,684/yr
For passive investors: Depreciation is non-cash, so a rental often shows a tax loss while cash-flowing — sheltering income. Rental losses are passive: they offset passive income freely, and up to $25,000/yr can offset ordinary (W-2) income if you actively participate and your MAGI is under $100k (phasing out to $0 by $150k); unused losses carry forward. On sale, claimed depreciation is recaptured at up to 25%, and gains may owe capital-gains tax (a 1031 exchange can defer both). Figures are a year-1 estimate at your 24.0% rate — not tax advice; consult a CPA.
Schools (NCES district)
- District
- Wayne-Westland Community School District
- NCES district ID
- 2600015
- Math proficiency
- 11% ▼ -6.00%
- Reading proficiency
- 27% ▼ -2.00%
- Median HH income
- $43,524
- Composite
- 16.4/100
- National rank
- #9195
- State rank
- #474 of 540 in MI
Livability — Wayne
- Score
- 72/100
- State rank
- #252
- US rank
- #6284
Category grades
Schools grade is shown separately in the Schools card above.
Census & demographics
- Census place
- Wayne, MI
- County
- Wayne County · 1,562,939 people
- City population
- 17,348
- Metro
- Detroit-Warren-Dearborn, MI
- Population (ZIP)
- 17,348
- Household income
- $59,171
- Rent vs Own
- Severe rent burden
- 720.0
Population outlook (Wayne County) Hauer SSP2
- Today (2025)
- 1,675,273 people
- By 2030
- 1,620,300 · -3.3%
- By 2040
- 1,502,341 · -10.3%
- By 2050
- 1,384,039 · -17.4%
- By 2075
- 1,124,592 · -32.9%
- By 2100
- 881,193 · -47.4%
Race, ethnicity, and origin ACS 2023
- Neighborhood character
- Diverse neighborhood (Simpson 0.56)
- Race & ethnicity
- White 61% Black 25% Two or more races 7% Hispanic / Latino 5% Asian 2% Native American 1%
- Hispanic origin (detail)
- Mexican 4% Puerto Rican 1%
- Common ancestry
- Romanian 7% Lithuanian 3% Italian 2%
- Foreign-born
- 6% · Canada, South Korea
- Languages at home
- 92% English-only · Spanish 3% Other Indo-European 1% French/Haitian/Cajun 1%
Political lean MEDSL · Wayne
- 2024 margin
- Strong D (+29.0) · D 62.7% · R 33.7% · Other 3.6%
- 2008→2024 swing
- -20.5pp toward R · 2008: 49.5pp · 2024: 29.0pp
- All cycles
- 2024: D+29.0 2020: D+38.1 2016: D+37.3 2012: D+46.9 2008: D+49.5
Not yet ingested
- Civics
- —
Market trends
- HPI YoY
- ▼ -171.12%
- Current HPI
- 217.8548
- Rent YoY
- —
- Metro
- Detroit-Warren-Dearborn, MI
- State GDP YoY
- ▲ 1.37%
- F500 in state
- 28
Industry mix (Fortune 500 HQ in MI)
| Industry | F500 HQs | Revenue |
|---|---|---|
| Automotive Parts | 3 | $48B |
|
||
| Automotive | 2 | $372B |
|
||
| Chemicals | 1 | $45B |
|
||
| Automotive Retail | 1 | $29B |
|
||
| Healthcare / Medical Devices | 1 | $23B |
|
||
| Automotive Technology | 1 | $20B |
|
||
Price history
+222.4% since first listed6 events — show timeline
- 2026-06-02 Coming Soon $199,900 MiRealSource-MiMLS
- 2023-08-11 Coming Soon — MiRealSource-MiMLS
- 2023-08-11 Coming Soon — REALCOMP
- 2023-08-11 Listing Removed — MiRealSource-MiMLS
- 2023-08-11 Listing Removed — REALCOMP
- 1992-04-06 Sold (Public Records) $62,000 Public Records
Property tax history
+0.7%/yrLatest (2025): $1,655 · -15.8% YoY. Source: county tax records.
Cash-flow waterfall
monthlySold comps — $/sqft
last 12 mo · ≤1 miLoading sold comps…