 Triplex
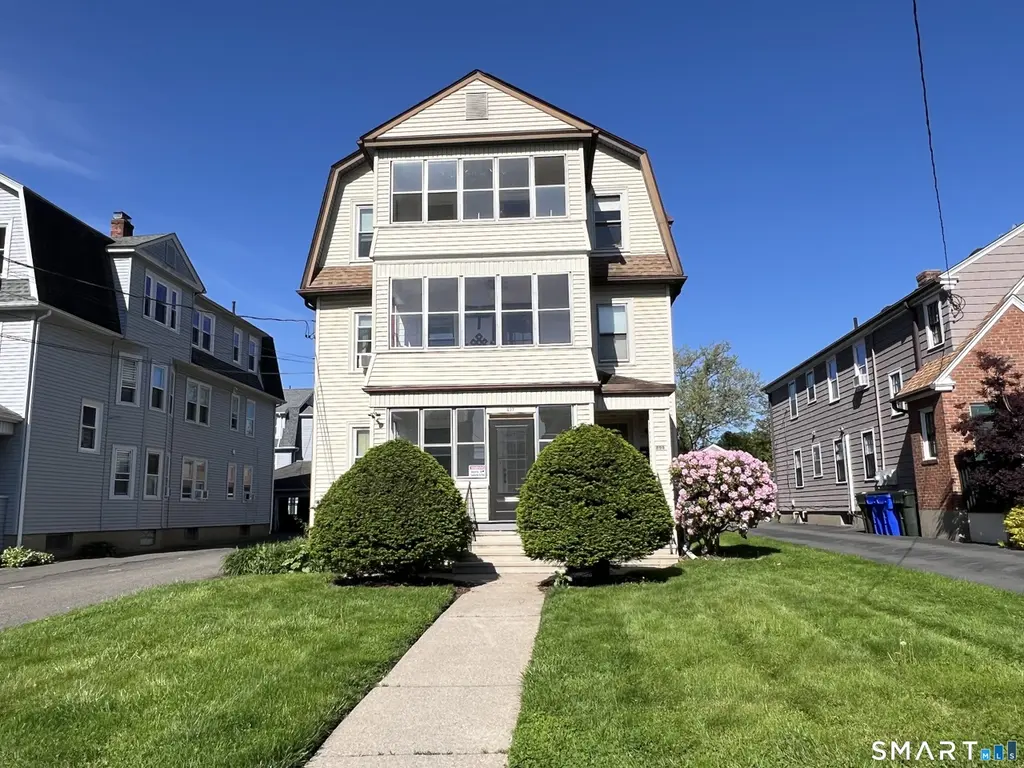
497 PROSPECT Ave · West Hartford, CT
Flood risk 1/10 · Minimal
- FEMA flood zone
- X (unshaded)
- Chance of flooding over 30 yrs
- 0.0%
- Est. flood insurance / yr
- $473 – $860
Fire risk 1/10 · Minimal
- Est. fire insurance / yr
- $829 – $1,539
Heat risk 5/10 · Moderate
- Hot days now (above 97°F)
- 7 days/yr
- Hot days in 30 yrs
- 16 days/yr
Wind risk 6/10 · Moderate
- Chance of severe wind over 30 yrs
- 27.0%
Air-quality risk 3/10 · Minor
- Unhealthy air days now
- 3 days/yr
- Unhealthy air days in 30 yrs
- 4 days/yr
Risk factors via First Street. Map © Google.
Why this score? — see what drove the C+ grade
The composite is a weighted blend of 9 inputs, each scored 0–100. Each bar is that input's sub-score; the figure is the points it added to the 100-point composite (weight × sub-score).
- Cash flow +20.2/30.0
- ARV discount +11.7/15.0
- DSCR +6.4/10.0
- 1% rule +5.8/10.0
- Schools +5.6/10.0
- Rent growth +4.2/5.0
- Livability +4.0/5.0
- Condition / age +2.5/5.0
- Appreciation +0.0/10.0
$700,000
🖨 Deal sheet 📄 Offer letter ✓ Due diligence
Multi-family units
County records classify this as Multi-Family (2-4 Unit). Listing-text estimate: 3 units. confirmed
Listing remarks MLS
Call your investors! Best in class multi-family turnkey, excellent rental history, prime location, minutes to blue back square great opportunity for owner occupied.
Key facts
- 7,405 sq ft lot
- 3 garage spots
- Built 1924
Neighborhood map
What this means for you Summary
Snapshot
- This is a 3 × 3-bed/1.0-bath units multifamily listed at $700k.
Deal economics
- At list price, monthly cash flow is $886 ($11k/yr) — positive. Per door: $295/mo.
- The deal already cash-flows at list — no discount required.
- Meets the 1% rule at list price ($8k rent vs $700k).
- Cap rate 7.8% vs local median 3.3% in West Hartford — top-decile yield for the area; either an underpriced asset or a hidden risk that comps aren't pricing in. Stress-test before assuming the spread holds.
Location & tenants
- Location reads 79/100 on livability (#27 in CT, #1,989 nationally) — a middle-class / working-renter tenant base. Strengths: schools A+, employment A+, housing A+; Watch: amenities F, cost of living F.
- West Hartford School District (urban): math 56% / reading 67% proficiency, ranked #39 of 153 in CT (top 26%) — acceptable for families but not a draw, mixed tenant base, ~2y average lease; only 16% free/reduced lunch — higher-income household profile.
- Market conditions: Rents rising fast (+6.7%/yr); 47 active listings in the ZIP; lower-income renter base — watch delinquency; 1,867 units permitted in Capitol Planning Region in 2024 (1,399 in 5+ unit buildings).
- At $7,575/mo this rent would consume 217% of the median local household income ($42k/yr) (locally 2389% of renters already pay >50% of income on rent) — very limited rent-growth headroom before tenants either downsize or default.
Forward outlook
- Local home prices are declining (-3.0%/yr); year-one equity from $5k of loan paydown is wiped out by about $21k of value loss. Plan a longer hold.
- At projected returns (-3.0% appreciation + 6.7% rent growth), your $196k cash investment doubles in ~10 years — after that, you're playing with house money.
Negotiation context
- Only 1 days on market — expect competitive offers; lowballing is unlikely to land.
- 3 sale attempts since 17y ago with the ask held roughly flat each time — persistent listings suggest the price (not the market) is what's stuck; bring a comps-based counter.
- Current owner paid $389k; list at $700k implies a 80% gain — meaningful room to come down on a strong offer.
Risks & watch-outs
- Watch-outs: built in 1924 — expect roof / HVAC / electrical / plumbing capex.
- Climate carrying-cost: major wind risk, 27% chance of damaging wind over 30y; extreme-heat days projected 7→16/yr by 2055 (HVAC capex compounding) — expect insurance premiums to compound above CPI over the hold.
Questions for the listing agent
- Can we see the unit-by-unit rent roll, current vacancy, and any below-market leases? What's the average tenancy length?
- What capital expenditures (roof, boiler, parking lot, exteriors) have been made in the last 5 years, and what's planned in the next 2?
- Built in 1924 — when were the roof, HVAC, electrical panel, plumbing, and water heater last replaced?
- Is there a deadline driving the sale (1031 exchange, divorce, estate, relocation)? That informs how much negotiation room exists.
- Schools are A-rated — typically a magnet for longer-tenancy family renters. What's the average tenant stay here, and is there a school-zone premium baked into asking?
- What's the average days-on-market for RENTAL listings here right now (not sales)? A rising rental-DOM trend means longer vacancies and softer asking-rent achievability than the comps imply.
- What's the recent tenant-quality profile in this submarket — average credit score on applications, eviction rate, late-payment / NSF rate, and stable-employment percentage? A property-management company in the area should have these aggregated.
- How much new apartment / multifamily construction is in the pipeline within 1–3 miles? Heavy new supply (>2% of stock underway) typically softens rents 12–24 months out; light construction supports rent growth.
Investment metrics
- 1% rule
- 1.08% ✓
- Cap rate
- 7.81%
- Cash-on-cash
- 5.42%
- DSCR
- 1.24
- GRM
- 7.7
CMA / ARV
- ARV (on-the-fly)
- $772,275
- Comps found
- 4
Show comp detail 4 sales within ~0.75 mi
| Address | Dist | Beds/Ba | Sqft | Sold | Price | $/sf | Match |
|---|---|---|---|---|---|---|---|
| 49-51 Maplewood Ave | 0.63mi | 7/3.0 (+1) | 4,036 (-8%) | 13mo | $705,000 | $175 | 40 |
| 97-99 Maplewood Ave | 0.64mi | 7/5.0 (+1) | 4,068 (-8%) | 14mo | $746,500 | $184 | 33 |
| 19 Thomas St | 0.67mi | 6/3.0 | 3,756 (-15%) | 19mo | $655,000 | $174 | 28 |
| 28 Quaker Ln S | 0.71mi | 7/3.0 (+1) | 3,804 (-14%) | 22mo | $550,000 | $145 | 21 |
Match score weights: distance 35% · size 25% · config 20% · recency 20%. Top-matched comps best support the ARV.
Projected returns pro-forma
-3.0% appreciation · 6.73% rent growth · sell at horizon
- IRR
- -3.6%
- Equity multiple
- 0.86×
- Total profit
- $-27,262
- Equity at exit
- $104,372
- IRR
- 10.1%
- Equity multiple
- 1.92×
- Total profit
- $180,697
- Equity at exit
- $60,523
Cash invested: $196,000 (down + closing). Projections, not guarantees.
Landlord ↔ Tenant lean methodology
- Overall (STATE)
- 27 Tenant-Leaning
- State Connecticut
- 27 Tenant-Leaning · D+7
- County
- — inherits STATE
- City
- — inherits STATE
ZIP-level market 06105
- Home prices YoY
- -25.6%
- Rents YoY
- 6.7%
- Active inventory
- 47
- Price-to-rent
- 23.1×
Monthly cashflow live
- Estimated rent
- $7,575 high interval (Pro) →
- Mortgage (P&I)
- −$3,671
- Tax from tax record
- −$1,136 /mo · $13,634/yr
- Insurance
- −$292
- HOA
- −$0
- Vacancy / Maint / Mgmt
- −$1,591
- Net cashflow
- $886
Break-even live
3-unit breakdown (identical units grouped — click to expand)
| Units | Beds | Baths | Est. rent |
|---|---|---|---|
| 3× units | 3 | 1 | $7,575 |
| #1 | 3 | 1 | $2,525 |
| #2 | 3 | 1 | $2,525 |
| #3 | 3 | 1 | $2,525 |
| Total (3 units) | $7,575 | ||
UW: 25.0% down · 7.5% · 30yr · 1.5% tax · 5.0% vac · 8.0% maint · 8.0% mgmt
Financing live
Cash to close
- Down payment
- $175,000
- Closing costs
- $21,000
- Reserves months
- —
- Total cash needed
- —
Loan-product check · same deal, 3 products live
Conventional
25% down · 7.5% · 30yr
- Down + closing
- —
- Monthly P&I
- —
- Monthly cashflow
- —
- DSCR
- —
- Eligible?
- —
Personal DTI + credit; lowest rate.
DSCR
20% down · 8.5% · 30yr
- Down + closing
- —
- Monthly P&I
- —
- Monthly cashflow
- —
- DSCR
- —
- Eligible?
- —
No personal income docs; deal must DSCR.
Hard money
10% down · 12.0% · 12mo
- Down + closing
- —
- Monthly P&I
- —
- Monthly cashflow
- —
- DSCR
- —
- Eligible?
- —
Short-term bridge; refi at stabilization.
Listing history 7 events
-
2026-05-20status Under Contract
-
2026-05-18$700,000 Active
-
2014-04-14soldstatus $389,000
-
2014-04-10soldstatus $389,000 170-char remark
Show marketing remark (170 chars)
Call your investors! Best in class multi-family turnkey, excellent rental history, prime location, minutes to blue back square great opportunity for owner occupied.
-
2013-10-30$389,000 170-char remark
Show marketing remark (170 chars)
Call your investors! Best in class multi-family turnkey, excellent rental history, prime location, minutes to blue back square great opportunity for owner occupied.
-
2010-03-25historical
-
2009-11-24$439,900
ⓘ Source: listings_history table (triggers on properties + properties_extension) + one-shot
backfill from property_details.listing_events for pre-trigger history.
Tax reassessment forecast CT · Partial reset (capped growth)
- Current annual tax
- $13,634 · $1,136/mo
- Projected year-2 tax
- $14,307 · $1,192/mo
- Expected delta
- +$673/yr (+$56/mo · 4.9%)
ⓘ Screening estimate from a state-policy table — verify with the county assessor before closing.
Climate risk First Street
- Flood 1/10 Low FEMA zone X (unshaded) · 0% chance over 30 yrs
- Wildfire 1/10 Low
- Heat 5/10 Major 7 d/yr ≥97°F today · 16 d/yr by 30 yrs out
- Wind 6/10 Major 27% chance of damaging wind over 30 yrs
- Air quality 3/10 Moderate 3 unhealthy d/yr today · 4 by 30 yrs out
Nearby sold comps map
Loading sold comps map…
Walkable amenities ~0.75 mi
Loading nearby amenities…
Taxation est. · year 1
- Rental income
- $90,900
- − Mortgage interest
- −$39,211
- − Property taxes
- −$13,634
- − Insurance
- −$3,500
- − Repairs & maintenance
- −$7,272
- − Management
- −$7,272
- − Depreciation
- −$20,364
- Taxable loss
- −$353
- Est. tax savings @ 24.0%
- +$85
- After-tax cash flow
- $10,711/yr
For passive investors: Depreciation is non-cash, so a rental often shows a tax loss while cash-flowing — sheltering income. Rental losses are passive: they offset passive income freely, and up to $25,000/yr can offset ordinary (W-2) income if you actively participate and your MAGI is under $100k (phasing out to $0 by $150k); unused losses carry forward. On sale, claimed depreciation is recaptured at up to 25%, and gains may owe capital-gains tax (a 1031 exchange can defer both). Figures are a year-1 estimate at your 24.0% rate — not tax advice; consult a CPA.
Schools (NCES district)
- District
- West Hartford School District
- NCES district ID
- 0904920
- Math proficiency
- 56% ▼ -6.00%
- Reading proficiency
- 67% ▼ -5.00%
- Median HH income
- $85,173
- Composite
- 55.64/100
- National rank
- #1228
- State rank
- #39 of 153 in CT
Livability — West Hartford
- Score
- 79/100
- State rank
- #27
- US rank
- #1989
Category grades
Schools grade is shown separately in the Schools card above.
Census & demographics
- Census place
- West Hartford, CT
- County
- Hartford County · 754,208 people
- City population
- 63,441
- Metro
- Hartford-East Hartford-Middletown, CT
- Population (ZIP)
- 19,174
- Household income
- $41,937
- Rent vs Own
- Severe rent burden
- 2389.0
Population outlook (Capitol County) Hauer SSP2
- By 2040
- 1,063,519
Race, ethnicity, and origin ACS 2023
- Neighborhood character
- Highly diverse neighborhood (Simpson 0.71)
- Race & ethnicity
- Black 39% White 28% Hispanic / Latino 26% Two or more races 14% Asian 2%
- Hispanic origin (detail)
- Puerto Rican 18% Cuban 1% Dominican 3%
- Common ancestry
- Romanian 3% Lithuanian 2% Estonian 1%
- Foreign-born
- 20% · Canada, United Kingdom
- Languages at home
- 74% English-only · Spanish 18% Other Indo-European 3% French/Haitian/Cajun 2%
Political lean MEDSL · Capitol
- 2024 margin
- Strong D (+21.9) · D 60.1% · R 38.2% · Other 1.7%
- All cycles
- 2024: D+21.9
Not yet ingested
- Civics
- —
Market trends
- HPI YoY
- ▼ -59.58%
- Current HPI
- 173.3602
- Rent YoY
- ▲ 6.73%
- Metro
- Hartford-East Hartford-Middletown, CT
- State GDP YoY
- ▲ 1.06%
- F500 in state
- 38
Industry mix (Fortune 500 HQ in CT)
| Industry | F500 HQs | Revenue |
|---|---|---|
| Industrial Machinery | 4 | $38B |
|
||
| Insurance | 3 | $71B |
|
||
| Financial Services | 2 | $25B |
|
||
| Transportation / Logistics | 2 | $18B |
|
||
| Healthcare | 1 | $247B |
|
||
| Telecommunications | 1 | $55B |
|
||
Price history
+59.1% since first listed7 events — show timeline
- 2026-05-20 Pending — Smart MLS
- 2026-05-18 Listed $700,000 Smart MLS
- 2014-04-14 Sold (Public Records) $389,000 Public Records
- 2014-04-10 Sold (MLS) $389,000 Smart MLS
- 2013-10-30 Listed $389,000 Smart MLS
- 2010-03-25 Listing Removed — Smart MLS
- 2009-11-24 Listed $439,900 Smart MLS
Property tax history
+3.5%/yrLatest (2025): $13,634 · +5.7% YoY. Source: county tax records.
Cash-flow waterfall
monthlySold comps — $/sqft
last 12 mo · ≤1 miLoading sold comps…