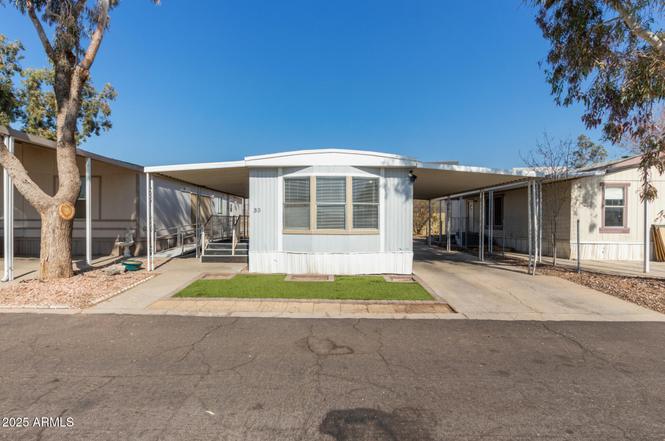
1221 N Dysart Rd #35 · Avondale, AZ
Flood risk 1/10 · Minimal
- FEMA flood zone
- X (shaded)
- Chance of flooding over 30 yrs
- 0.0%
- Est. flood insurance / yr
- $507 – $1,088
Fire risk 5/10 · Moderate
- Est. fire insurance / yr
- $610 – $1,132
Heat risk 9/10 · Severe
- Hot days now (above 113°F)
- 6 days/yr
- Hot days in 30 yrs
- 15 days/yr
Wind risk 1/10 · Minimal
- Chance of severe wind over 30 yrs
- —
Air-quality risk 2/10 · Minimal
- Unhealthy air days now
- 0 days/yr
- Unhealthy air days in 30 yrs
- 1 days/yr
Risk factors via First Street. Map © Google.
Why this score? — see what drove the B+ grade
The composite is a weighted blend of 9 inputs, each scored 0–100. Each bar is that input's sub-score; the figure is the points it added to the 100-point composite (weight × sub-score).
- Cash flow +30.0/30.0
- ARV discount +15.0/15.0
- 1% rule +10.0/10.0
- DSCR +10.0/10.0
- Livability +3.6/5.0
- Schools +2.8/10.0
- Rent growth +2.6/5.0
- Condition / age +2.5/5.0
- Appreciation +0.0/10.0
$40,000
🖨 Deal sheet (PDF) 📄 Offer letter ✓ Due diligence
Listing remarks
Home, sweet home! This charming 2-bedroom mobile home welcomes you with an inviting front porch for enjoying morning coffee. Inside, you'll find an open layout with a soothing palette, blinds, and contemporary wood-look flooring. The kitchen comes with white cabinetry and built-in appliances for a seamless cooking experience. Both bedrooms are well-sized and provide a cozy space for relaxation. Outside, discover a shed in the backyard, offering extra storage space. Don't miss out on this one!
Key facts
- Built-in appliances
- Front porch
- Shed in backyard
Tags
Property features AI
Finance
- HOA & community: Land lease community (monthly land lease $750); No association fees included; Community pool
Exterior
- Parking: 2 covered parking spaces; 2 carport spaces
- Utilities: City water; Public sewer
- Home design: Manufactured/Mobile home; Leasehold ownership
- Construction: Steel frame construction; Painted exterior; Metal roof
- Exterior features: Storage on property; Gravel/stone front; Synthetic grass front; East/West exposure
Interior
- Kitchen: Built-in microwave; Laminate counters; Electric range/oven; Refrigerator; Garbage disposal
- Bedrooms: Up to 2 bedrooms
- Flooring: Vinyl flooring
- Bathrooms: 1 full bathroom
- Heating & cooling: Electric heating; Window/wall cooling unit
- Interior features: High-speed internet available; No interior steps; Laminate counters; Storage
- Laundry & utility: Laundry inside
Neighborhood map
What this means for you Summary
Snapshot
- This is a 2-bed/1.0-bath manufactured listed at $40k.
Deal economics
- At list price, monthly cash flow is $900 ($11k/yr) — positive.
- The deal already cash-flows at list — no discount required.
- Meets the 1% rule at list price ($1k rent vs $40k).
- Recommended offer: $35k (12.0% below list) — sets the bar for market timing.
- Cap rate 33.3% vs local median 3.4% in Avondale — top-decile yield for the area; either an underpriced asset or a hidden risk that comps aren't pricing in. Stress-test before assuming the spread holds.
Location & tenants
- Location reads 72/100 on livability (#29 in AZ) — a middle-class / working-renter tenant base. Strengths: housing A+, commute A; Watch: health & safety C-, crime D+, amenities F.
- Agua Fria Union High School District (4289) (suburban): math 24% / reading 37% proficiency, ranked #99 of 249 in AZ (top 40%) — families likely to look elsewhere, expect single-tenant / working-renter base with shorter leases.
- Zoned schools: Lattie Coor (344 students, 84% FRL); Avondale Middle School (math 11% / reading 18%, grade F, #160 of 218 statewide, top 75%, 409 students, 78% FRL); Agua Fria High School (math 15% / reading 26%, grade F, #222 of 381 statewide, top 59%, 1,652 students, 62% FRL).
- Zoned-school proficiency averages 18% at this address vs 30% district-wide (-13 pts) — the specific schools serving this property underperform the Agua Fria Union High School District (4289) average; the district grade overstates school quality for this exact location.
- Market conditions: Rents flat; 316 active listings in the ZIP; 23 comparable units currently listed for rent nearby; rentals leasing fast (median 0d on market — plan ~1-2 weeks tenant-placement turnaround); solid renter incomes; 36,011 units permitted in Maricopa County in 2024 (12,801 in 5+ unit buildings).
Forward outlook
- Local home prices are declining (-3.0%/yr); year-one equity from $277 of loan paydown is wiped out by about $1k of value loss. Plan a longer hold.
- Maricopa County population projected at +38% by 2050 — long-run rental-demand tailwind backs the buy-and-hold thesis.
- At projected returns (-3.0% appreciation + 0.3% rent growth), your $11k cash investment doubles in ~2 years — after that, you're playing with house money.
Negotiation context
- It's been on market 505 days — a 12% lower offer ($35k) is reasonable based on typical stale-listing flexibility.
Risks & watch-outs
- Climate carrying-cost: moderate wildfire risk; extreme-heat days projected 6→15/yr by 2055 (HVAC capex compounding) — expect insurance premiums to compound above CPI over the hold.
Questions for the listing agent
- It's been on market 505 days. Have you received any prior offers? Is the seller open to a 12% concession, seller financing, or rate buy-down credit?
- Why hasn't it sold? Are there any deal-killer items the seller is aware of (foundation, flood, title, zoning, code violations)?
- Is there a deadline driving the sale (1031 exchange, divorce, estate, relocation)? That informs how much negotiation room exists.
- Crime grade is D in this area — have there been break-ins, vandalism, or insurance claims at this property in the last 3 years? What carrier currently insures it and at what premium?
- What's the average days-on-market for RENTAL listings here right now (not sales)? A rising rental-DOM trend means longer vacancies and softer asking-rent achievability than the comps imply.
- What's the recent tenant-quality profile in this submarket — average credit score on applications, eviction rate, late-payment / NSF rate, and stable-employment percentage? A property-management company in the area should have these aggregated.
- How much new for-sale + rental construction is in the pipeline within 1–3 miles? Heavy new supply typically softens prices + rents 12–24 months out; constrained supply supports both.
Investment metrics
- 1% rule
- 3.72% ✓
- Cap rate
- 33.30%
- Cash-on-cash
- 96.45%
- DSCR
- 5.29
- GRM
- 2.2
CMA / ARV
- ARV (on-the-fly)
- $75,200
- Comps found
- 1
Show comp detail 1 sale within ~0.75 mi
| Address | Dist | Beds/Ba | Sqft | Sold | Price | $/sf | Match |
|---|---|---|---|---|---|---|---|
| 1221 N Dysart Rd #37 | 0.00mi | 3/2.0 (+1) | 800 (0%) | 13mo | $75,000 | $94 | 80 |
Match score weights: distance 35% · size 25% · config 20% · recency 20%. Top-matched comps best support the ARV.
Projected returns pro-forma
-3.0% appreciation · 0.34% rent growth · sell at horizon
- IRR
- 94.4%
- Equity multiple
- 5.20×
- Total profit
- $46,994
- Equity at exit
- $5,964
- IRR
- 96.6%
- Equity multiple
- 9.90×
- Total profit
- $99,734
- Equity at exit
- $3,458
Cash invested: $11,200 (down + closing). Projections, not guarantees.
Landlord ↔ Tenant lean methodology
- Overall (STATE)
- 87 Strongly Landlord-Friendly
- State Arizona
- 87 Strongly Landlord-Friendly · R+3
- County
- — inherits STATE
- City
- — inherits STATE
ZIP-level market 85323
- Home prices YoY
- -27.1%
- Rents YoY
- 0.3%
- Active inventory
- 316
- Price-to-rent
- 2.2×
Monthly cashflow live
- Estimated rent
- $1,489 high interval (Pro) →
- Mortgage (P&I)
- −$210
- Tax est. 1.5%
- −$50 /mo · $600/yr
- Insurance
- −$17
- HOA
- −$0
- Vacancy / Maint / Mgmt
- −$313
- Net cashflow
- $900
Break-even live
Sensitivity live
| Price | -10% $928 | -5% $914 | +0% $900 | +5% $886 | +10% $873 |
|---|---|---|---|---|---|
| Rent | -10% $783 | -5% $841 | +0% $900 | +5% $959 | +10% $1,018 |
| Rate | -1.0pp $920 | -0.5pp $910 | base $900 | +0.5pp $890 | +1.0pp $879 |
UW: 25.0% down · 7.5% · 30yr · 1.5% tax · 5.0% vac · 8.0% maint · 8.0% mgmt
Financing live
Cash to close
- Down payment
- $10,000
- Closing costs
- $1,200
- Reserves months
- —
- Total cash needed
- —
Loan-product check · same deal, 3 products live
Conventional
25% down · 7.5% · 30yr
- Down + closing
- —
- Monthly P&I
- —
- Monthly cashflow
- —
- DSCR
- —
- Eligible?
- —
Personal DTI + credit; lowest rate.
DSCR
20% down · 8.5% · 30yr
- Down + closing
- —
- Monthly P&I
- —
- Monthly cashflow
- —
- DSCR
- —
- Eligible?
- —
No personal income docs; deal must DSCR.
Hard money
10% down · 12.0% · 12mo
- Down + closing
- —
- Monthly P&I
- —
- Monthly cashflow
- —
- DSCR
- —
- Eligible?
- —
Short-term bridge; refi at stabilization.
Rent comps 23 comps
| Address | Beds | Baths | Sqft | Rent | $/sqft | DOM | Units | Dist |
|---|---|---|---|---|---|---|---|---|
| 1333 N Dysart Rd Avondale, AZ | 2.0 | 1.0–2.0 | 626 | $1,620 | $2.59 | 0d | 27 | 0.13mi |
| 333 E Van Buren St Avondale, AZ | 2.0 | 1.0–2.0 | 574 | $1,365 | $2.38 | 0d | 13 | 0.50mi |
| 1425 N Palo Verde Dr Goodyear, AZ | 2.0 | 1.0 | 847 | $1,250 | $1.48 | 0d | 4 | 0.52mi |
| 526 N 4th St Unit B Avondale, AZ | 2.0 | 1.0 | 858 | $1,150 | $1.34 | 0d | 1 | 0.59mi |
| 522 N 4th St Unit A Avondale, AZ | 2.0 | 1.0 | 858 | $1,150 | $1.34 | 0d | 1 | 0.61mi |
| 103 E Brinker Dr Avondale, AZ | 3.0 | 1.0 | 900 | $1,150 | $1.28 | 0d | 3 | 0.73mi |
| 12375 W Van Buren St Avondale, AZ | 1.0–3.0 | 1.0–2.0 | 1044 | $1,811 | $1.73 | 0d | 47 | 0.74mi |
| 312 E Kinderman Dr Unit 1 Avondale, AZ | 2.0 | 1.0 | 717 | $1,375 | $1.92 | 21d | 1 | 0.75mi |
| 1701 N Palo Verde Dr Goodyear, AZ | 2.0 | 1.0 | 760 | $1,195 | $1.57 | 0d | 2 | 0.75mi |
| 12721 W Buckeye Rd Avondale, AZ | 2.0–3.0 | 2.0 | 983 | $1,497 | $1.52 | 0d | 6 | 0.85mi |
| 1408 N Central Ave Avondale, AZ | 1.0–3.0 | 1.0–2.0 | 909 | $1,465 | $1.61 | 0d | 15 | 0.87mi |
| 1737 N Central Ave Goodyear, AZ | 1.0–3.0 | 1.0–2.0 | 1009 | $1,544 | $1.53 | 0d | 15 | 0.89mi |
| 207 S 3rd St Unit 11 Avondale, AZ | 2.0 | 1.0 | 950 | $1,000 | $1.05 | 0d | 1 | 0.99mi |
| 1322 N La Jolla Blvd Goodyear, AZ | 1.0 | 1.0 | 575 | $1,170 | $2.03 | 0d | 4 | 1.01mi |
| 12115 W Van Buren St Avondale, AZ | 1.0 | 1.0 | 754 | $1,155 | $1.53 | 18d | 1 | 1.04mi |
| 12115 W Van Buren St Avondale, AZ | 1.0 | 1.0 | 754 | $1,195 | $1.58 | 0d | 1 | 1.04mi |
| 12115 W Van Buren St Avondale, AZ | 1.0 | 1.0 | 729 | $1,263 | $1.73 | 6d | 1 | 1.04mi |
| 231 S 1st St Unit 1 Avondale, AZ | 2.0 | 1.0 | 1050 | $1,600 | $1.52 | 0d | 1 | 1.09mi |
| 13015 W Rancho Santa Fe Blvd Avondale, AZ | 1.0–3.0 | 1.0–2.0 | 971 | $1,494 | $1.54 | 0d | 18 | 1.12mi |
| 620 N Litchfield Rd Goodyear, AZ | 1.0–3.0 | 1.0–2.0 | 802 | $1,532 | $1.91 | 0d | 15 | 1.20mi |
| 102 S 4th Ave Avondale, AZ | 1.0–3.0 | 1.0–2.0 | 853 | $1,541 | $1.81 | 0d | 26 | 1.32mi |
| 105 N Links Dr Avondale, AZ | 1.0–2.0 | 1.0–2.0 | 930 | $1,554 | $1.67 | 0d | 16 | 1.43mi |
| 11850 W Fillmore St Avondale, AZ | 3.0 | 1.0–2.0 | 838 | $1,566 | $1.87 | 0d | 20 | 1.49mi |
Listing history 20 events
-
2026-06-21days on market $40,000 Active 505 DOM
-
2026-06-18days on market $40,000 Active 502 DOM
-
2026-06-17days on market $40,000 Active 501 DOM
-
2026-06-16days on market $40,000 Active 500 DOM
-
2026-06-15days on market $40,000 Active 499 DOM
-
2026-06-13days on market $40,000 Active 497 DOM
-
2026-06-13days on market $40,000 Active 496 DOM
-
2026-06-09days on market $40,000 Active 493 DOM
-
2026-06-08days on market $40,000 Active 492 DOM
-
2026-06-07days on market $40,000 Active 491 DOM
-
2026-06-04days on market $40,000 Active 488 DOM
-
2026-06-02days on market $40,000 Active 486 DOM
-
2026-06-01days on market $40,000 Active 485 DOM
-
2026-05-31days on market $40,000 Active 484 DOM
-
2026-04-14price $40,000
-
2025-11-21price $43,000
-
2025-09-23price $45,000
-
2025-08-18price $50,000
-
2025-06-27price $57,000
-
2025-02-01$60,000 Active
ⓘ Source: listings_history table (triggers on properties + properties_extension) + one-shot
backfill from property_details.listing_events for pre-trigger history.
Climate risk First Street
- Flood 1/10 Low FEMA zone X (shaded) · 0% chance over 30 yrs
- Wildfire 5/10 Major
- Heat 9/10 Extreme 6 d/yr ≥113°F today · 15 d/yr by 30 yrs out
- Wind 1/10 Low
- Air quality 2/10 Low 0 unhealthy d/yr today · 1 by 30 yrs out
Nearby sold comps map
Loading sold comps map…
Walkable amenities ~0.75 mi
Loading nearby amenities…
Taxation est. · year 1
- Rental income
- $17,873
- − Mortgage interest
- −$2,241
- − Property taxes
- −$600
- − Insurance
- −$200
- − Repairs & maintenance
- −$1,430
- − Management
- −$1,430
- − Depreciation
- −$1,164
- Taxable income
- $10,809
- Est. tax owed @ 24.0%
- −$2,594
- After-tax cash flow
- $8,209/yr
For passive investors: Depreciation is non-cash, so a rental often shows a tax loss while cash-flowing — sheltering income. Rental losses are passive: they offset passive income freely, and up to $25,000/yr can offset ordinary (W-2) income if you actively participate and your MAGI is under $100k (phasing out to $0 by $150k); unused losses carry forward. On sale, claimed depreciation is recaptured at up to 25%, and gains may owe capital-gains tax (a 1031 exchange can defer both). Figures are a year-1 estimate at your 24.0% rate — not tax advice; consult a CPA.
Schools (NCES district)
- District
- Agua Fria Union High School District (4289)
- NCES district ID
- 0400450
- Math proficiency
- 24% ▼ -32.00%
- Reading proficiency
- 37% ▼ -12.00%
- Median HH income
- $64,107
- Composite
- 27.92/100
- National rank
- #6865
- State rank
- #99 of 249 in AZ
Livability — Avondale
- Score
- 72/100
- State rank
- #29
- US rank
- #6100
Category grades
Schools grade is shown separately in the Schools card above.
Census & demographics
- Census place
- Avondale, AZ
- County
- Maricopa County · 4,537,380 people
- City population
- 86,122
- Metro
- Phoenix-Mesa-Chandler, AZ
- Population (ZIP)
- 47,043
- Household income
- $83,120
- Rent vs Own
- Severe rent burden
- 1506.0
Population outlook (Maricopa County) Hauer SSP2
- Today (2025)
- 4,979,203 people
- By 2030
- 5,378,229 · +8.0%
- By 2040
- 6,156,598 · +23.6%
- By 2050
- 6,872,376 · +38.0%
- By 2075
- 8,401,270 · +68.7%
- By 2100
- 9,247,439 · +85.7%
Race, ethnicity, and origin ACS 2023
- Neighborhood character
- Diverse neighborhood (Simpson 0.58)
- Race & ethnicity
- Hispanic / Latino 60% Two or more races 26% White 22% Black 13% Asian 2% Native American 2%
- Hispanic origin (detail)
- Mexican 52% Puerto Rican 1%
- Common ancestry
- Italian 2% Portuguese 1% Ukrainian 1%
- Foreign-born
- 19% · Canada, Vietnam
- Languages at home
- 53% English-only · Spanish 42% Arabic 1% Tagalog/Filipino 1%
Political lean MEDSL · Maricopa
- 2024 margin
- Toss-up / Even · D 47.7% · R 51.2% · Other 1.1%
- 2008→2024 swing
- +7.1pp toward D · 2008: -10.6pp · 2024: -3.5pp
- All cycles
- 2024: R+3.5 2020: D+2.2 2016: R+3.5 2012: R+12.0 2008: R+10.6
Not yet ingested
- Civics
- —
Market trends
- HPI YoY
- ▼ -118.44%
- Current HPI
- 319.3653
- Rent YoY
- ▲ 0.34%
- Metro
- Phoenix-Mesa-Chandler, AZ
- State GDP YoY
- ▲ 4.54%
- F500 in state
- 20
Industry mix (Fortune 500 HQ in AZ)
| Industry | F500 HQs | Revenue |
|---|---|---|
| Technology | 2 | $13B |
|
||
| Mining / Metals | 1 | $23B |
|
||
| Environmental Services | 1 | $16B |
|
||
| Metals / Steel | 1 | $14B |
|
||
| Technology Distribution | 1 | $9B |
|
||
| Homebuilding | 1 | $8B |
|
||
Price history
-33.3% since first listed6 events — show timeline
- 2026-04-14 Price Changed $40,000 ARMLS
- 2025-11-21 Price Changed $43,000 ARMLS
- 2025-09-23 Price Changed $45,000 ARMLS
- 2025-08-18 Price Changed $50,000 ARMLS
- 2025-06-27 Price Changed $57,000 ARMLS
- 2025-02-01 Listed $60,000 ARMLS
Cash-flow waterfall
monthlySold comps — $/sqft
last 12 mo · ≤1 miLoading sold comps…